Segmentation is one of my favorite features in Metrics Explorer in Application Insights. It helps you slice and dice the telemetry about what users are doing with your application, as well as helps you understand performance metrics.
Segmentation
Let me show you how easy it is to answer some basic questions by using segmentation. This is for a blog that was instrumented with Application Insights JS.
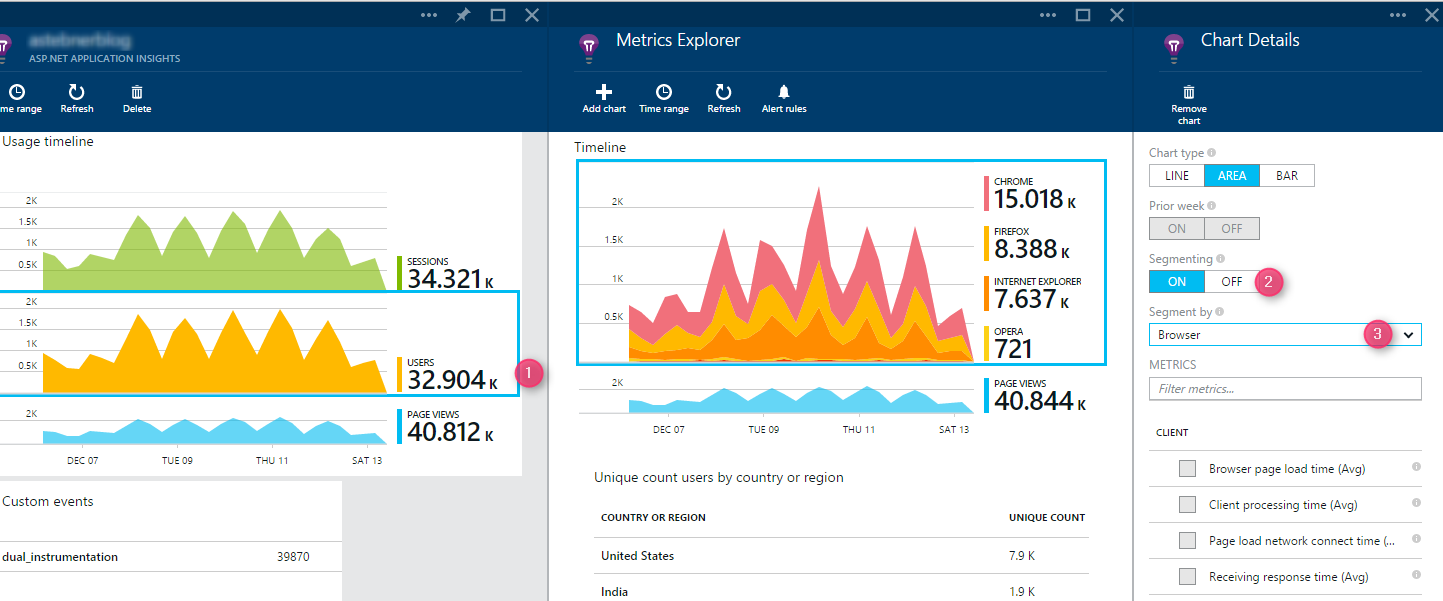
Which browsers are my users using?
- Select the users chart from the usage timeline part
- Turn on segmentation
- Select the dimension browser
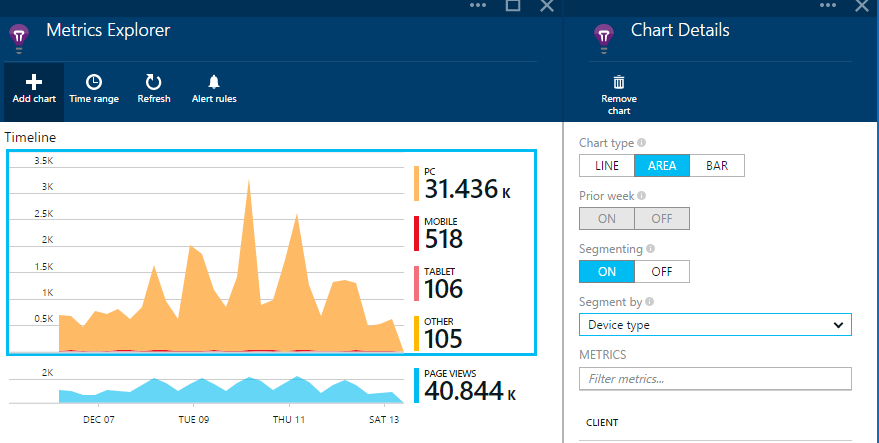
What devices are my users using?
In this case mostly my audience seems to be PC users and that’s expected as they refer to this blog while working. If it was a social site, you may have seen a different mix.
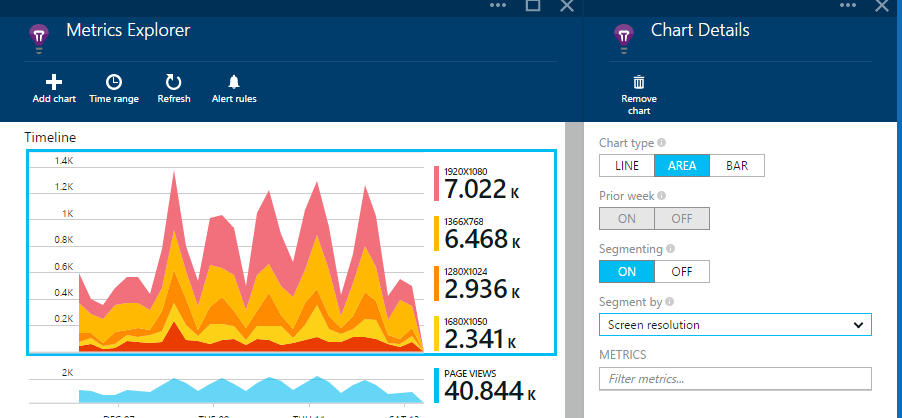
What is the breakdown of the screen resolution of my users devices?
This helps me in adjusting my content and images so that it fits in a screen and avoid scrolling.**
Dimensions for segmentation or grouping
Dimension is any property that is available to facet and filter by (in Search) or segment by (in ME). The list of dimensions that allows you to slice your metrics in ME is dynamic and is based on the metric you select.
For example, in the list of dimensions you’ll see “Request name” only for server based metrics like response name, request count or failed request, and “Page name” only for page view metrics.
We are continuing to refine this list for optimal user experience and would love to get your feedback on your experience as you use the product.
Setting up server performance metrics
How long does it take the server to process a request, which are the slowest requests, and how long are my external dependencies taking?
There are three categories of performance metrics collected from the server: 1) Request metrics 2) Dependency metrics and 3) Performance counters.
The following request metrics are collected automatically by Application Insights SDK or Status Monitor without any special configuration:
- Server response time: Time taken to process the request.
- Server requests: Number of requests processed by the server.
- Failed requests: Number of requests that have failed with http response code >= 400.
Install Application Insights Status Monitor on your server to get dependency metrics:
- Dependency duration: Time spent by process in external modules.
- Dependency calls: Number of calls made to external dependencies.
- Dependency failures: Number of failed calls to external dependencies.
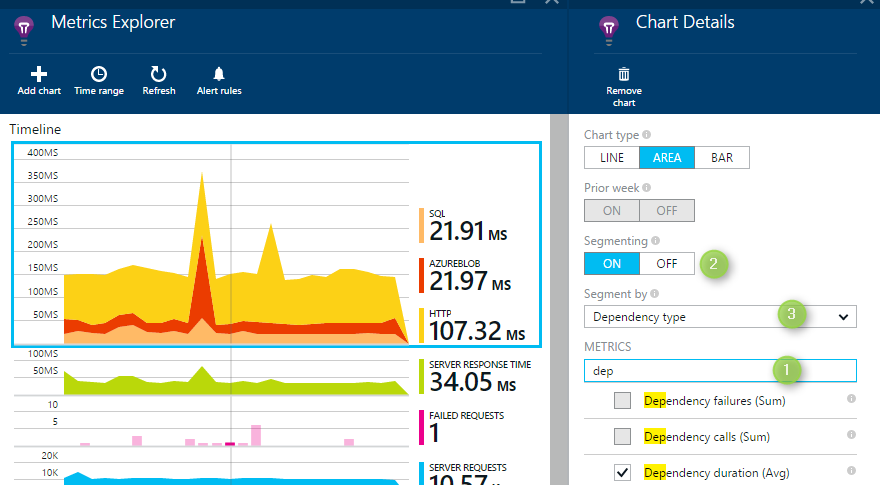
With same simple steps you can get rich insights for your server metrics too, i.e. 1) filter and select a metric 2)Turn on segmentation 3) Select the property to segment by.
**Lets’ take some specific examples:
What is the trend of some of my slowest requests?
As you can see below GET Management/Update… seems to have regular spikes.
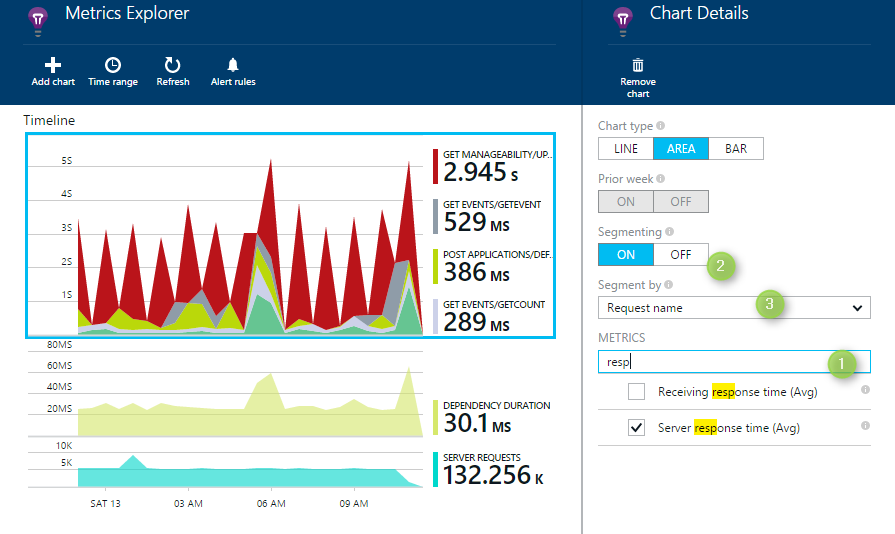
With the chart below I am able to correlate the spike in server response time with most likely the spike in dependency duration for Azure blob request.
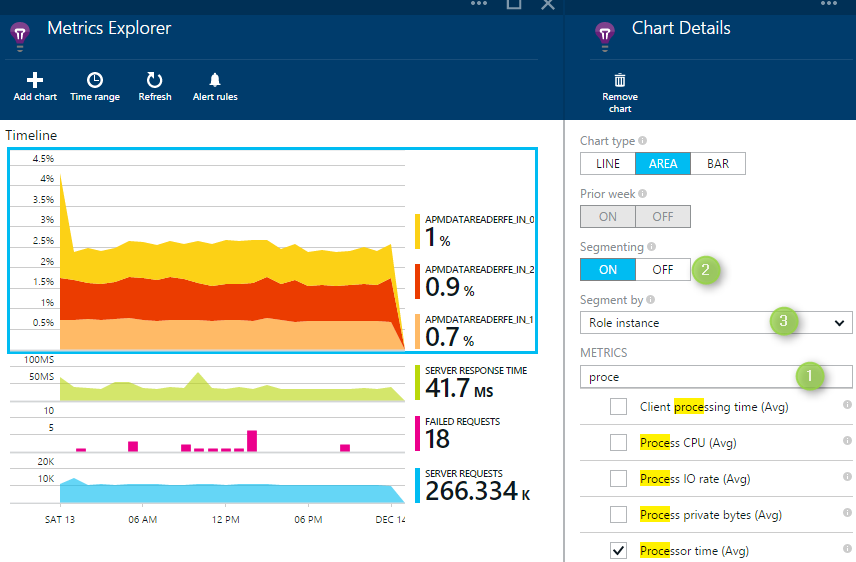
Here is another example showing instance level counters for CPU Processor time.
As you have seen, with segmentation, not only we can get rich insight from usage telemetry but also from server telemetry. In the next blog post, I’ll focus on grids,and some of the failure metrics (like exceptions and failed requests).
If you have not already signed up for Application Insights, then now is the time: Get Started
Have a great Christmas and a Happy New Year!!!

0 comments