When you are running your code and something is behaving unexpectedly, how do you find out what is going wrong? When I was in school the first way I learned how to debug a wonky application was by sticking “print()” statements all over the place, running my code, and looking back through the log of output seeing if I noticed that something looked wrong. Then if I wanted to look at the value of another variable I would have to add a new “print()” statement, recompile, and re-run the application again. This can be a tedious process, so I am pleased to tell you there is a better way than littering your code with a slew of “print()” statements you’ll have to remove later. You can use the tools of the Visual Studio debugger to inspect variables on the fly.
In this post I will review seven different ways to inspect the values of your variables while debugging through your code in the Visual Studio debugger without modifying your code. Which ways do you already use? Let us know in the comments below.
If you’re interested in giving us feedback about our future ideas, please help us improve the Visual Studio debugger by joining our community.
In order to look at the value of variables while you are debugging, you first need to be in break mode. You can be stopped at a breakpoint, stopped while stepping, or even stopped at an Exception, and then you will have access to your variable values using these techniques.
1. DataTip
Hover over a variable to see its value.
The most commonly used way to look at variables is the DataTip. When stopped in the debugger hover the mouse cursor over the variable you want to look at. The DataTip will appear showing you the value of that variable. If the variable is an object, you can expand the object by clicking on the arrow to see the elements of that object.
You can also “pin” a DataTip to your code by clicking on the pin icon next to a value. This way you can see the value change right in-line with your code as you are stepping through it. This can come in handy when debugging inside of loops where you are watching a single value continually change.
2. Autos Window
**See variables used near your instruction pointer. **
As you stop at different places in your code the Autos window will automatically populate with all the variables used in the current statement (the line where the yellow instruction pointer is) and some surrounding statements. The scope of what variables automatically populate from the surrounding statements depends on the language you are debugging. Typically, you will see variables that are referenced 3 lines behind and 1 line ahead of the current statement. Some languages like JavaScript are not supported by the Autos window.
Open up this window from Debug/Windows/Autos Window (Ctrl+Alt+V, A)
3. Locals Window
**See variables that exist in the local scope of your current stack frame. **
The Locals window will populate with the local variables for the current method that have. Like the Autos window, variables that appear here are automatically populated. Deciding which window you prefer to use depends on which scope of the variables you would like to see.
In all of our variable windows, when any values of the variables change the new values will appear in red text.
Open up this window from Debug/Windows/Locals Window (Ctrl+Alt+V, L).
4. Watch Windows
Evaluate variables and **expressions and keep track of the results. **
There are four Watch windows available to use. These windows start out blank and let you add the names of variables that you care about watching as you debug your application. You can click in the editable line under the name column and type in the variable name whose value you want to see. Or you can right click on variables from your code editor and select “Add to Watch”.
Beyond adding just a single variable, you can type in generally any expression. So you can potentially call methods, evaluate lambdas, or just do things like “1+3”. Note that when you type in an expression that executes code there could be side effects that change the state of your application.
Open up these windows from Debug/Windows/Watch (Ctrl+Alt+W, 1).
5. QuickWatch dialog
**Quickly inspect the value and properties of a single variable or expression in a disposable pop-up diag. **
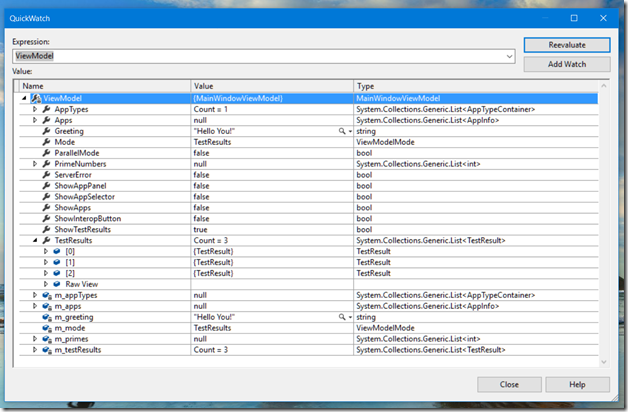
The QuickWatch window is a dialog that you can use to inspect a single variable or expression. This temporary dialog is convenient to use when you want more space to inspect all of the properties of an object, but don’t want to modify your window layout.
Open the QuickWatch window by right clicking on a variable and selecting “QuickWatch…” or by using the keyboard shortcut Shift+F9.
6. Parallel Watch Windows
See the value of a variable or expression simultaneously across multiple threads or recursive calls.
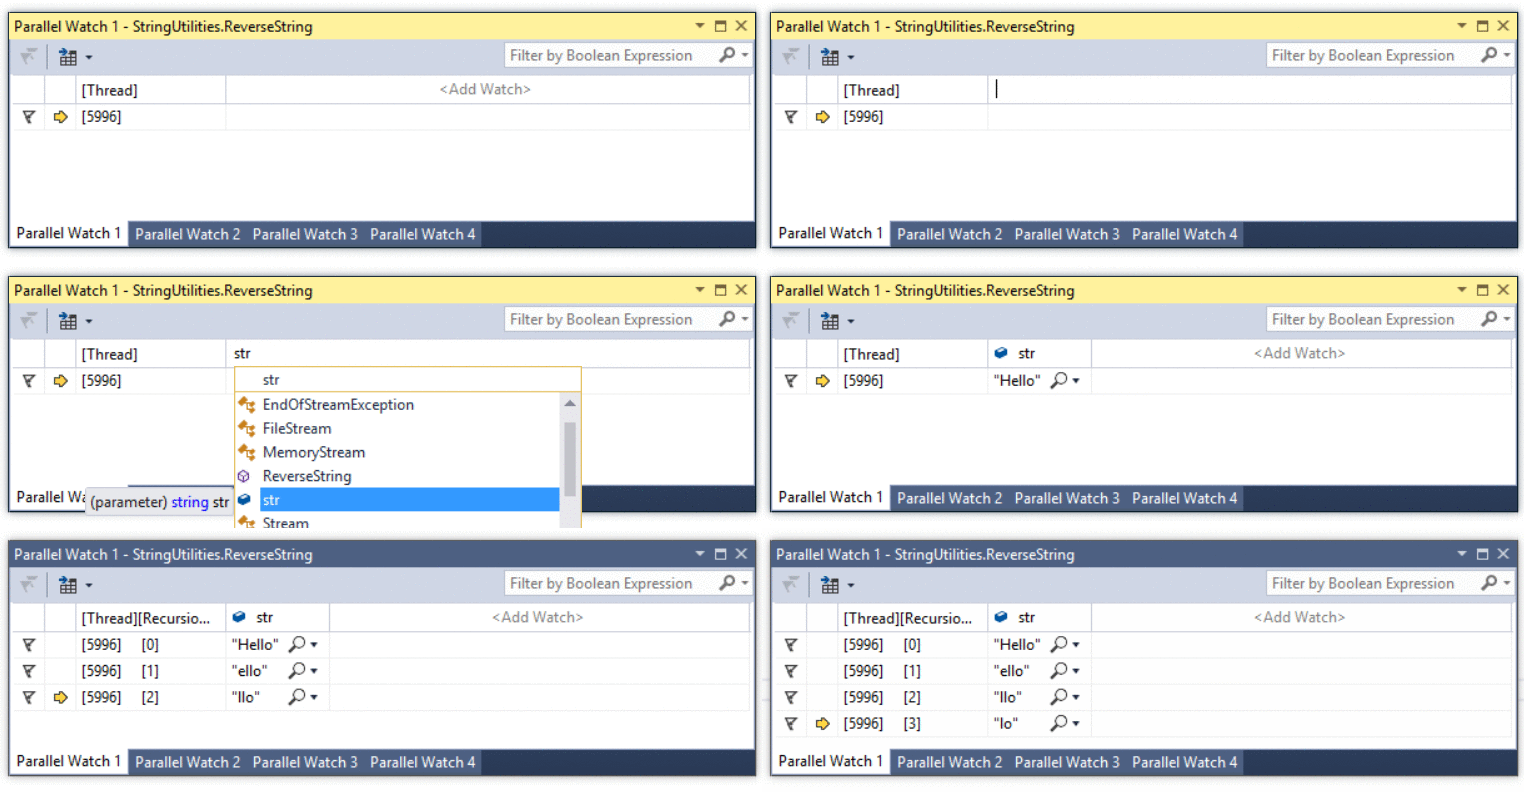
There are four Parallel Watch windows available to use. Similar to the Watch windows, you can click in the editable line
Each row in the window identifies a different thread and so you can see the value of the same variable across all your current threads.
It will also show you the value of a variable in a recursive stack across the same thread, where each row is an iteration of that function call.
Open up these windows from Debug/Windows/Parallel Watch (Ctrl+Shift+D, 1).
7. Immediate Window
Use this scratch pad to view and change the values of variables at a point in time.
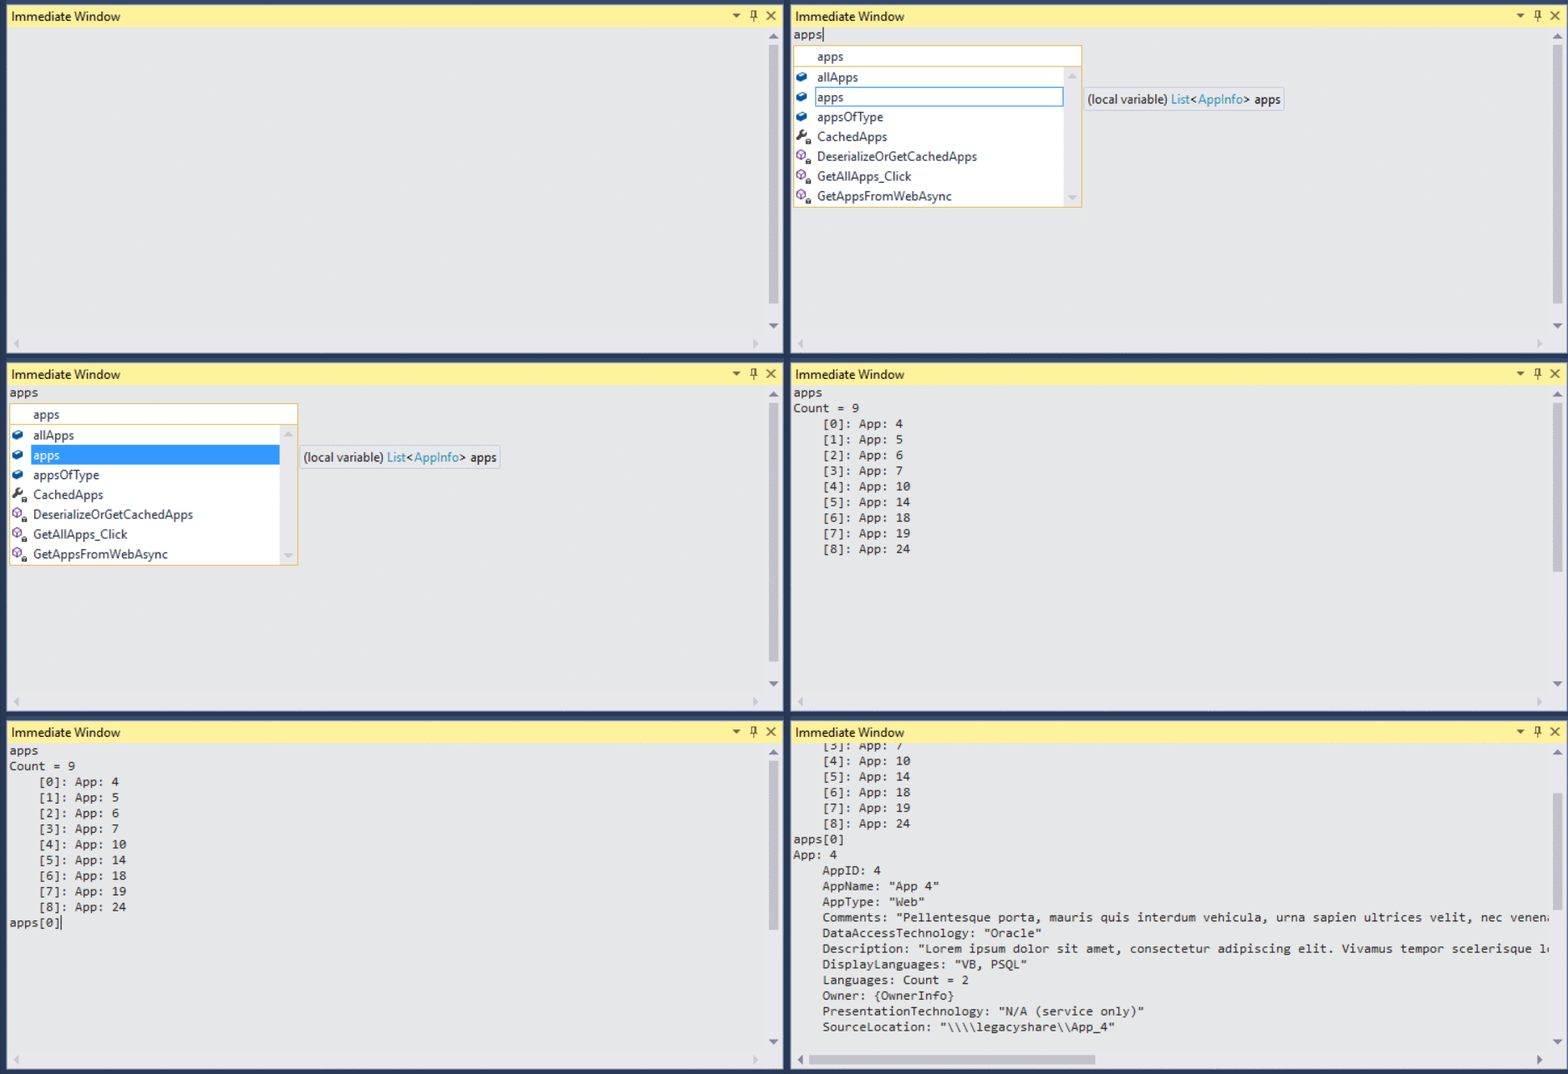
While stopped at a line of code, you can type a variable or expression into the Immediate window and hit enter to view the result. The Immediate window evaluates expressions just like the Watch windows and can result in side effects.
You can also use the Immediate window to execute complex expressions (even evaluate lambda expressions) and view the results without having to edit and re-execute your code. This window can also be used at design time, before you have started a debugging session.
Open the Immediate Window from Debug/Windows/Immediate Window (Ctrl+Alt+I).
Wrap Up
This list provides a basic overview of different ways to inspect variables using Visual Studio. What is your favorite way to see your variable values while debugging? Let us know in the comments below.
If you are interested in helping give feedback about our future ideas, sign up to help us improve the Visual Studio Debugger.


This was a very helpful article. I have recently lost my sight so I am currently in the process of learning how to do my job using JAWS text-to-speech software.
I used to use the hover tip to examine variables during debugging and I did not realise there were other ways of doing this. I have not tried all of the other methods but the ‘Locals’ window works quite well.
Thanks!