Visual Studio Code C/C++ extension May 2017 Update
Earlier this month, the C/C++ extension for Visual Studio Code hit another exciting milestone – it has been installed over 1.5 million times since it first shipped in March last year! Thanks to everyone who has sent us feedback to help us make it this far. We will continue to make improvements to the extension based on your feedback.
Today we are shipping the May 2017 update to the C/C++ extension for Visual Studio Code. In addition to several bug fixes, this update added auto-completion for keywords, enables error squiggles and quick info which shipped in April as experimental features, and improves the experience to configure debugger settings, making it much easier to get started with debugging C/C++ code in VS Code.
The original blog post, which provides an overview of this extension, has been updated with these changes. If you have this extension installed already, Visual Studio Code sends a notification for the update and installs the update for you automatically. If you haven’t installed it before, download the C/C++ extension for Visual Studio Code to try it out.
Improved experience to debugger configuration
One of the common pieces of user feedback we’ve heard constantly is that configuring the debugger is challenging. In this update, we simplified the default configuration in the debugger configuration file (launch.json) to make it relevant to the OS that you’re debugging on, and also now provides snippets to make it easier to add additional configurations.
After installing the May 2017 release of the extension, VS Code will prompt to be reloaded for the new configuration experience to take effect. This will only happen the first time the extension is installed/updated and activated.
Default configuration
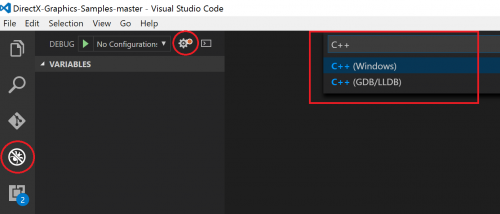
To start debugging, first click on the Debug button on the left side of the VSCode window, then click on the gear icon at the top and type in “C++” in the Command Palette to find the debugger options.
For example, selecting the C++ (GDB/LLDB) option on a Windows machine will create a new launch.json file, if it doesn’t exist, with the following default configuration:
Note that the newly-created launch.json file is much simpler and shorter than it was before. It now only contains one configuration to help you launch and debug your current application on the OS that VS Code is running on. The only things that you need to fill in here are:
- miDebuggerPath: replace the value with the path to the GDB debugger on your machine
- program: replace the value with the path to your program executable
- args: any arguments you want to pass to your program
Once these are completed, you can hit the green arrow button or press F5 to start debugging.
Add additional configurations
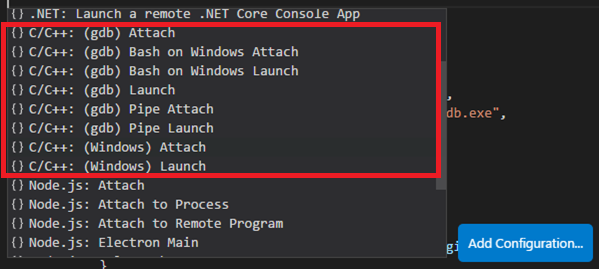
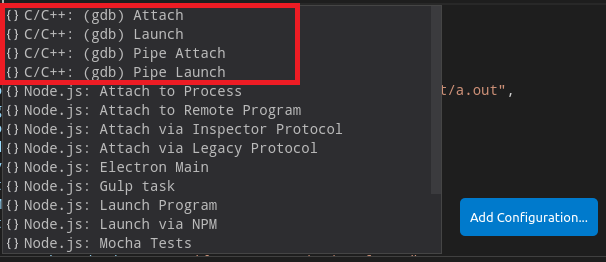
If you want to do other types of debugging, clicking the blue “Add Configuration…” button within the launch.json file will allow you to add other configurations. This button brings up a snippet list which shows the configurations that are applicable to the host OS. For example, the list on Windows (the first screenshot) and the list on Linux (the second screenshot) look like the following:
Configurations available on Windows:
Configurations available on Linux:
Selecting a snippet from the list will add a new configuration in your launch.json file.
Tell us what you think
Download the C/C++ extension for Visual Studio Code, try it out and let us know what you think. File issues and suggestions on GitHub. If you haven’t already provided us feedback, please take this quick survey to help shape this extension for your needs.


 Light
Light Dark
Dark
0 comments