
Visual Studio Code consistently ranks as the most popular IDE for developers, and its flexibility and extension marketplace make it possible for developers using any technology or language to build and debug their applications. In 2026, we’ve brought Aspire support to VS Code, providing an integrated experience for developing, running, and deploying AppHosts inside the IDE you already use.
The Aspire VS Code extension hooks into the Aspire CLI. To use it, ensure that the Aspire CLI is installed and available on your PATH, or run the > Aspire: Install Aspire CLI (stable) command inside VS Code after extension installation.
Come as you are
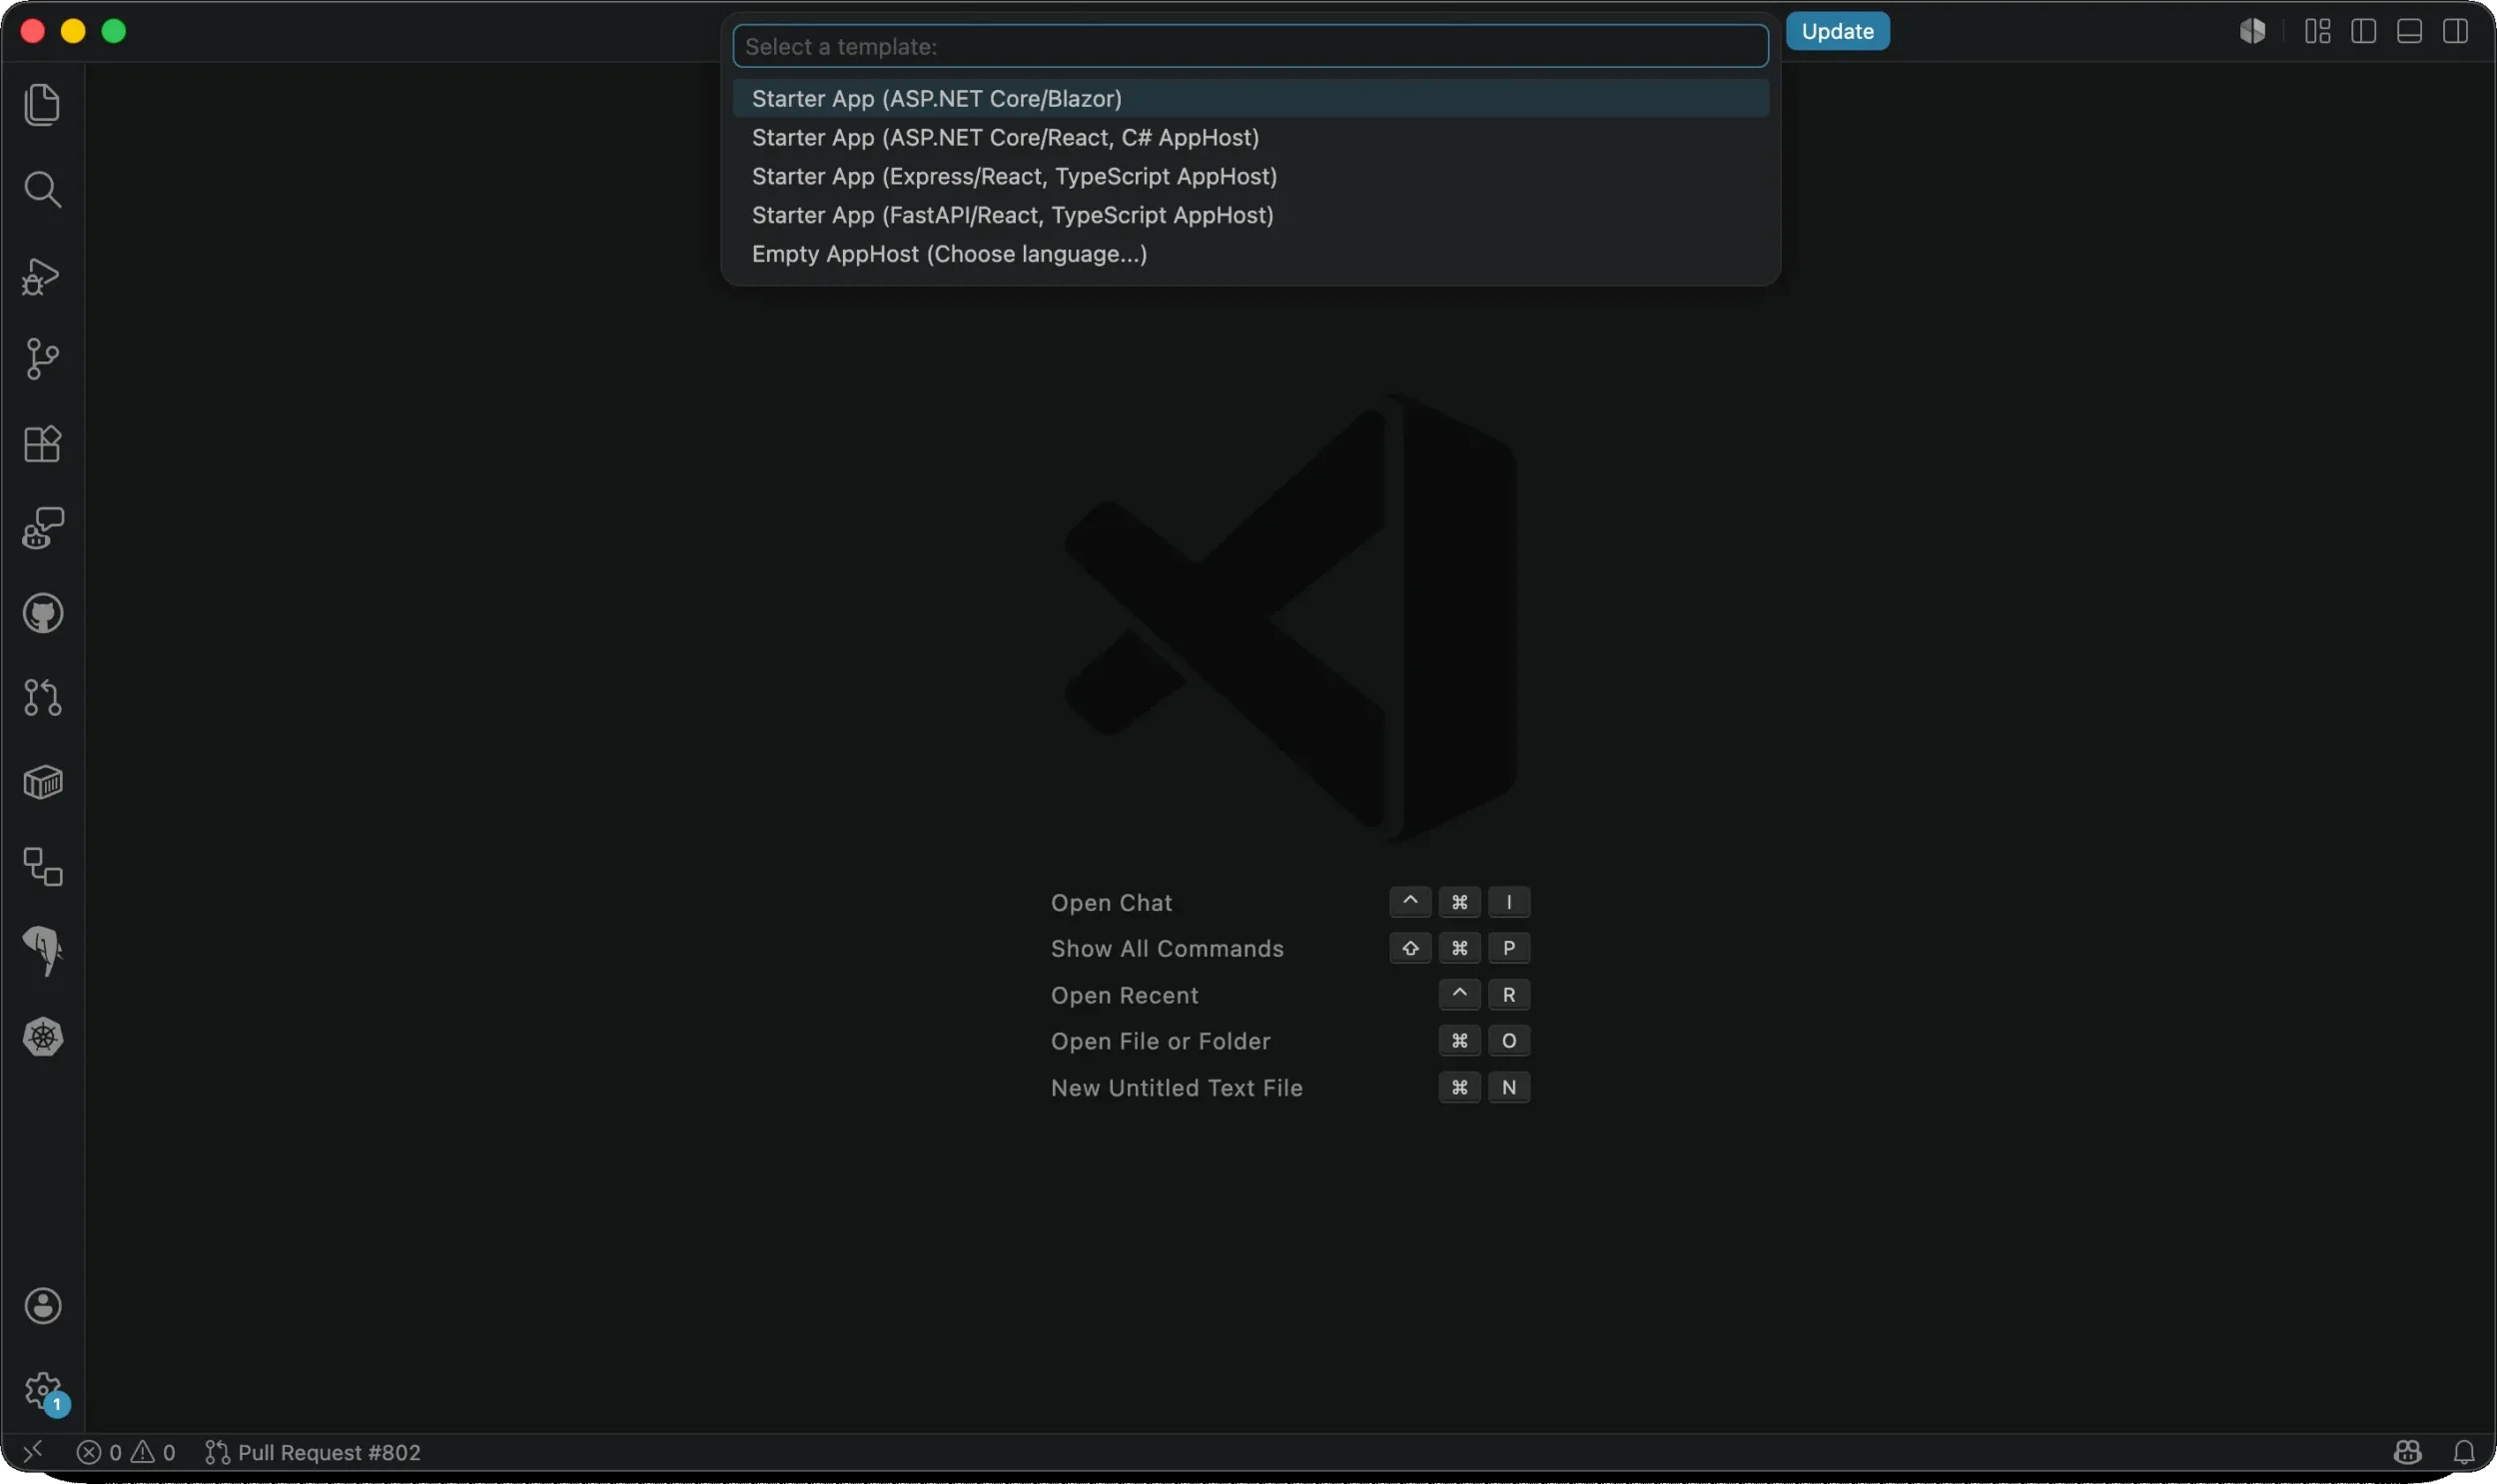
To create a new Aspire app, you can use the > Aspire: New Aspire project command palette command, which will scaffold your application after prompting for a template type, app location, and whether you want to install AI skills that teach coding models how to effectively develop with Aspire.
Aspirify an existing app with the > Aspire: Initialize Aspire in an existing codebase command or open a repo that already has an AppHost.
Debug (almost) all your resources
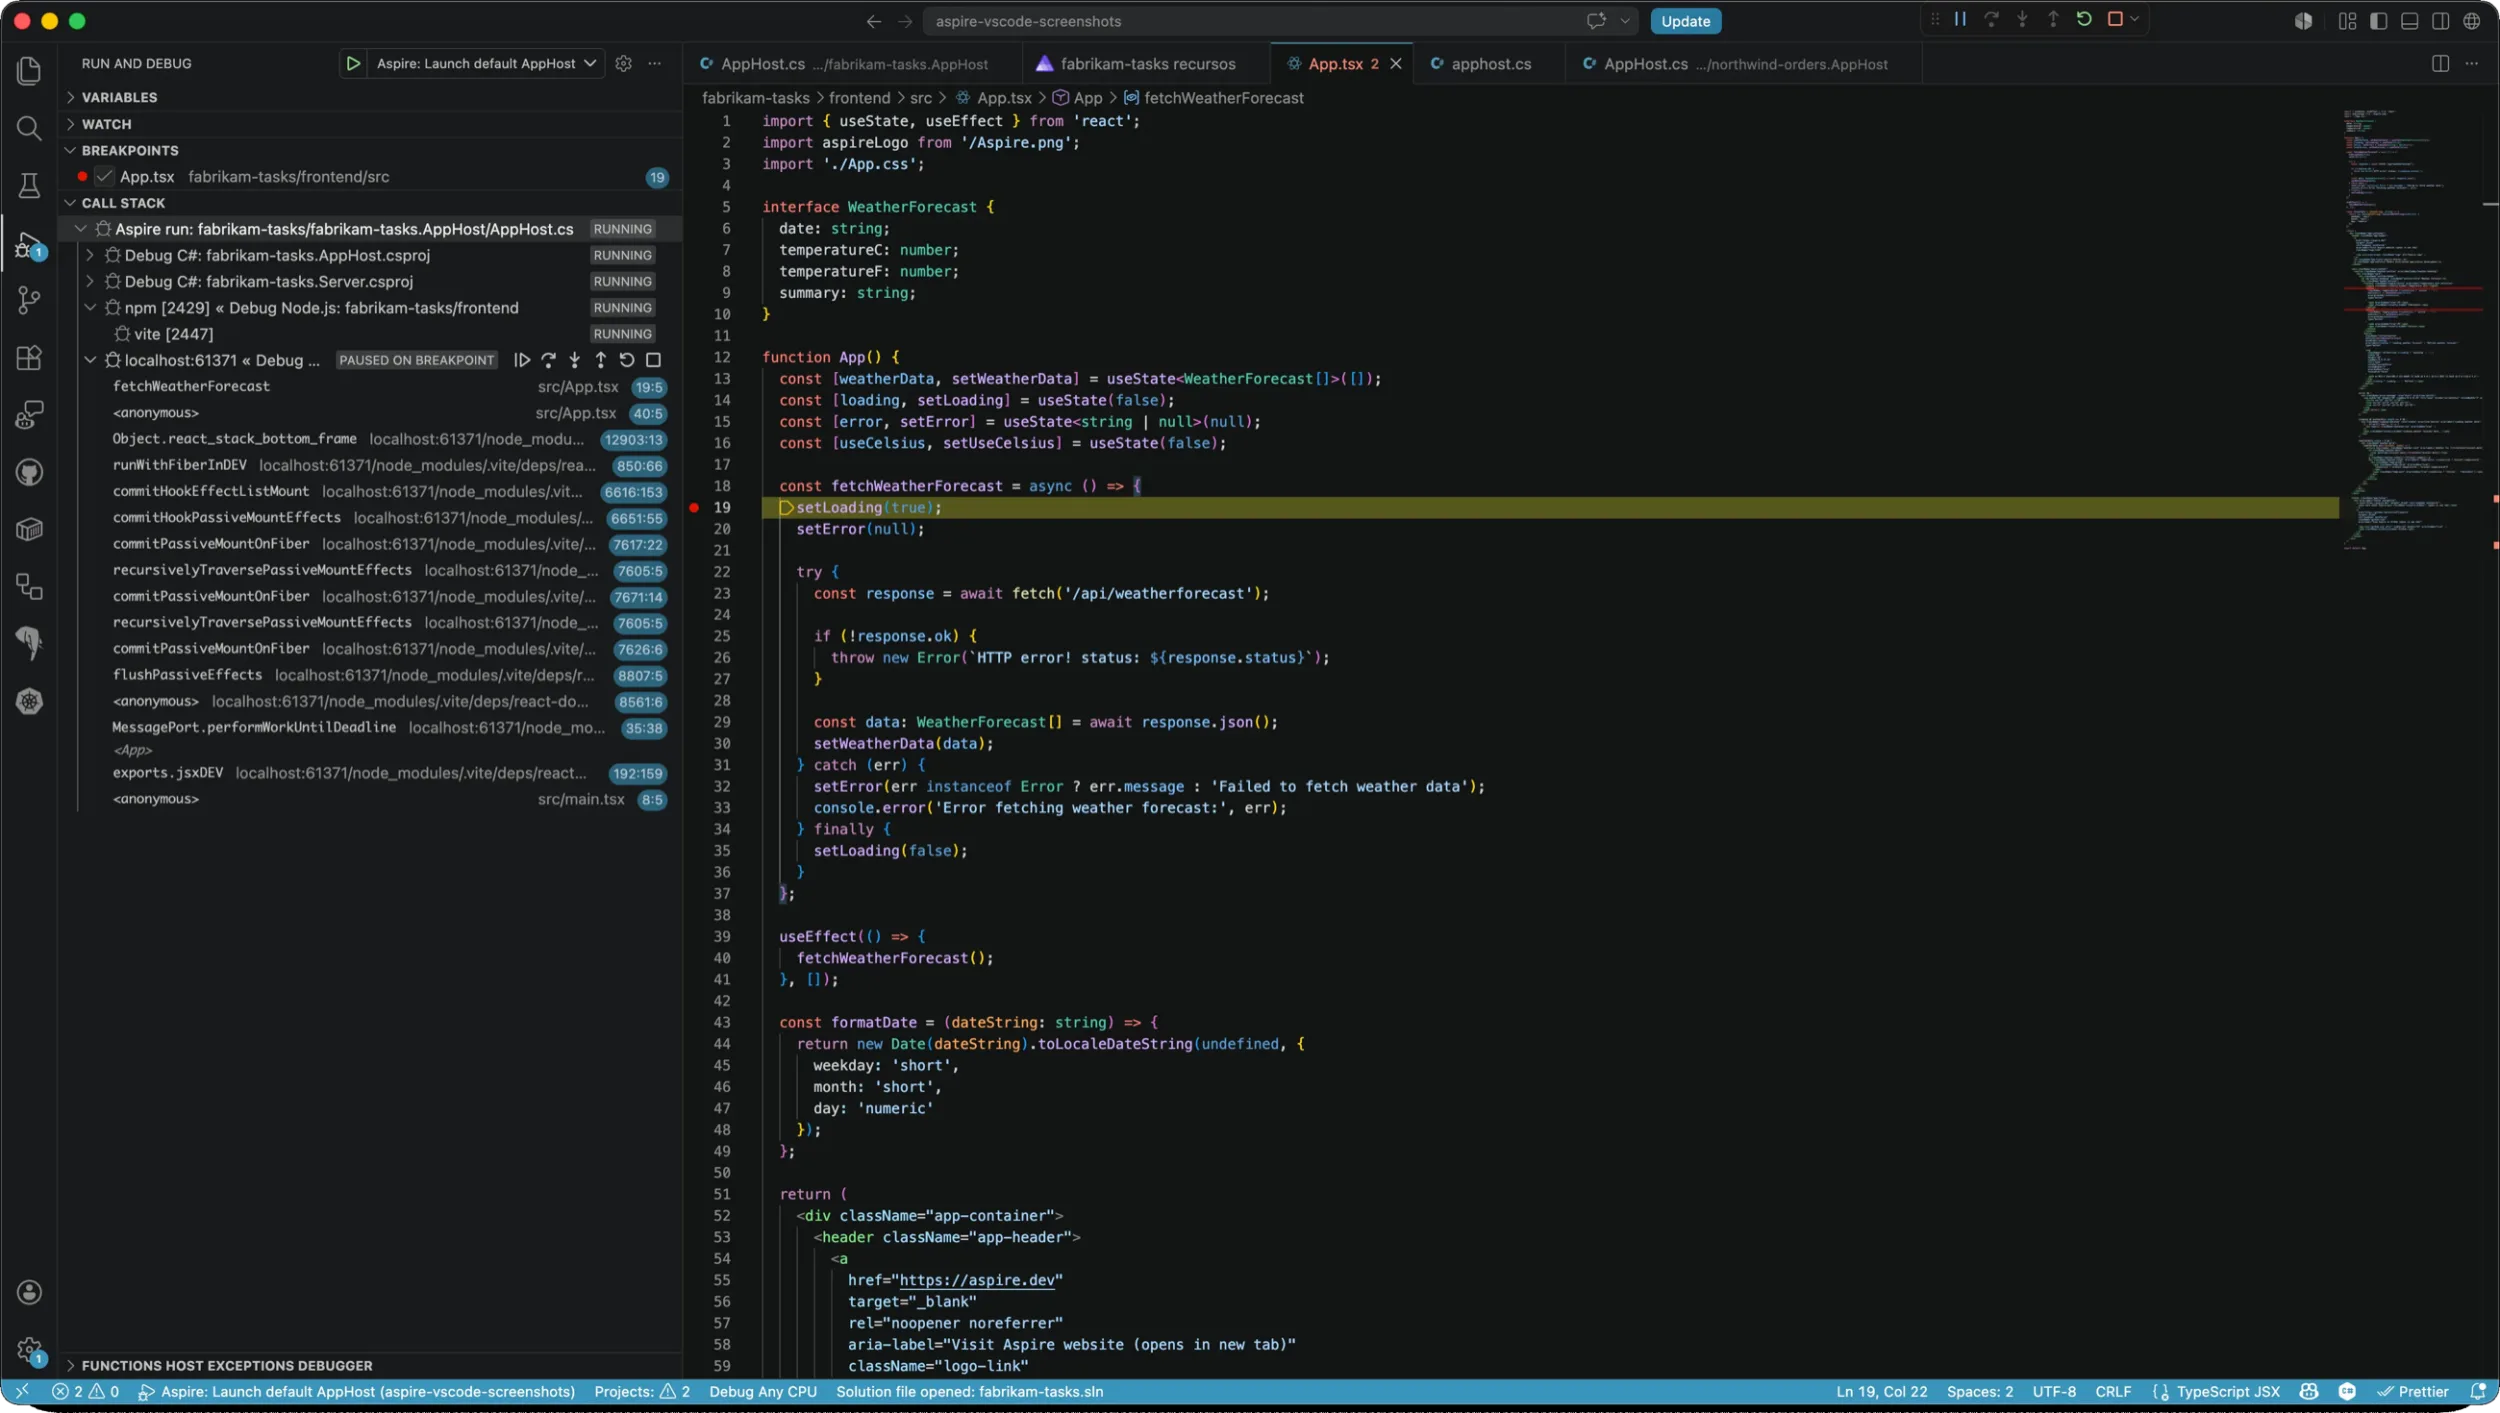
Aspire in Visual Studio Code natively supports debugging for both C# and TypeScript AppHosts.
When launching an AppHost with the Aspire debugger, Aspire will also orchestrate and provide debugging support for C#, TS/JS, Python, and Go resources. You can even use WithBrowserDebugger to automatically launch a debug browser with frontend source after the resource is healthy. Throughout the rest of 2026, we will be expanding debugger support to include additional languages like Java.
Set up debugging
To set up a launch configuration for the first time, run the > Aspire: Configure launch.json file command. The generated launch config can be as small as:
{
  "type": "aspire",
  "request": "launch",
  "name": "Aspire: Launch default AppHost",
  "program": "${workspaceFolder}"
}
That one debug profile is enough for the extension to build the AppHost, start resources, attach supported debuggers, and, if configured, open the Aspire dashboard. If you want more control, the same type: "aspire" launch config also supports deploy, publish, and do (run a pipeline step, must be paired with the step property) commands:
{
  "type": "aspire",
  "request": "launch",
  "name": "Aspire: Deploy AppHost",
  "program": "${workspaceFolder}",
  "command": "deploy",
  "env": {
    "ASPIRE_ENVIRONMENT": "Development",
    "MY_ENVIRONMENT_VARIABLE": "Hello"
  },
  "args": ["--non-interactive"]
}
By using the deploy and do commands, custom publishers and pipeline steps can be debugged from the same VS Code launch path, allowing you full visibility into what your pipeline is producing and how.
You can pass per-language debugger settings through the debuggers property.
Hitting F5
Most Aspire apps have multiple processes. A normal app might have a C# API, a React frontend, a Python worker, a browser target, a database container, and now maybe a Go service too. The extension turns the AppHost model into the right VS Code debug sessions.
The documented support includes C#/.NET, Python, Node.js, browser apps, and Azure Functions. New in Aspire 13.4, we have also added first-party Go hosting with VS Code debugger support through dlv-dap.
Put resource state next to the AppHost code
The Aspire extension’s most noticeable editor addition is showing live resource state in your AppHost file editor. Important state and actions are available at a glance, including resource health, health check status, and available commands. This same information is available elsewhere in VS Code through the Aspire panel.
When the AppHost is running, CodeLens appears above supported resource declarations. Note that you don’t have to start an AppHost inside VS Code to see this UI; CLI-managed runs using aspire run or aspire start are also shown.
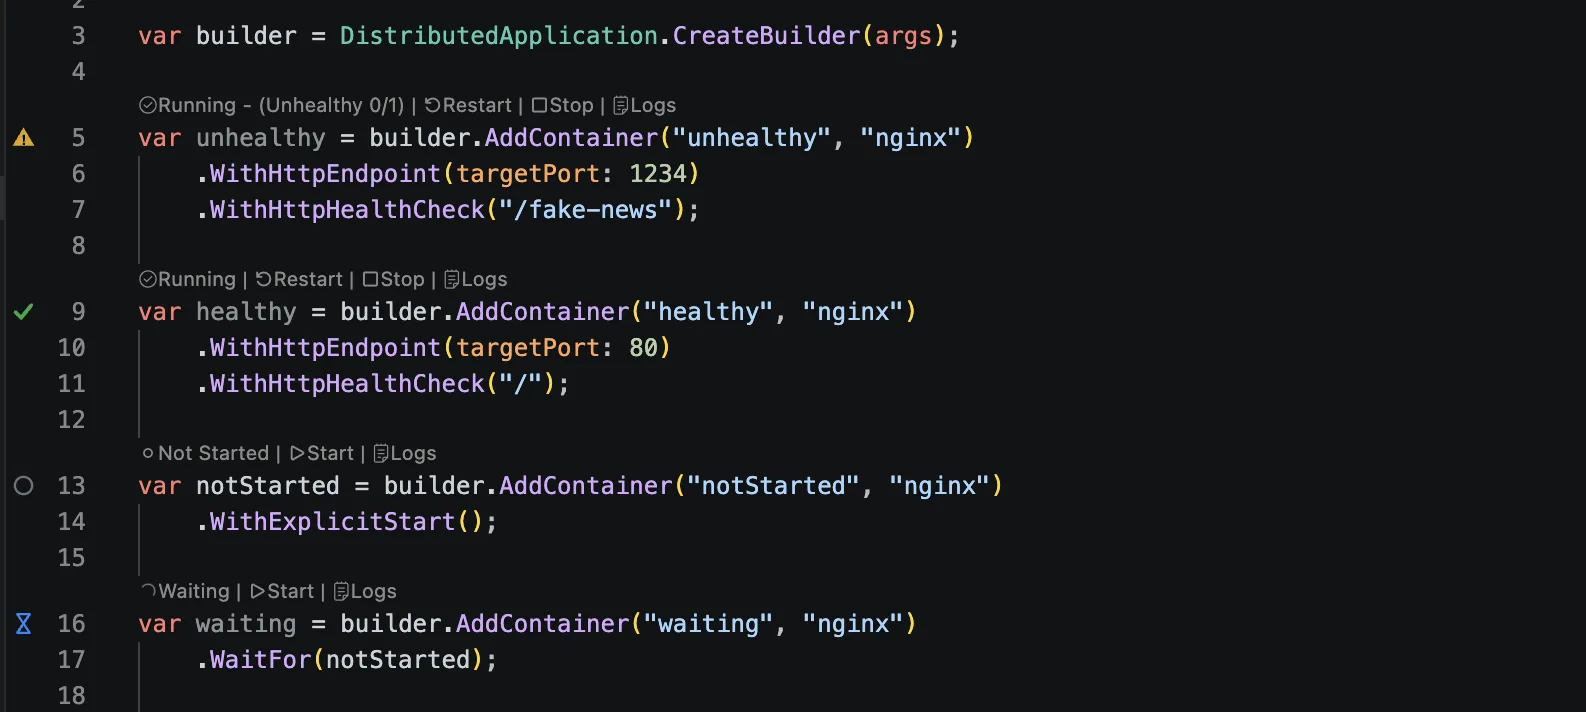
The gutter also gets health-aware icons. They use different shapes and icons, so you can easily and quickly identify any issues or anomalies.
There are two new AppHost-level CodeLens actions worth calling out in 13.4: Open Dashboard and View Logs. They sit by the builder statement, so when you are already looking at the AppHost you can jump to the Aspire dashboard or AppHost logs without switching to the Aspire panel first or needing to execute a terminal command.
The Aspire panel is useful even before you start debugging
Currently, most Aspire work still eventually lands in the Aspire Dashboard: resources, endpoints, logs, traces, metrics, and commands in one place. And the Aspire Dashboard is great!
But one of our goals in 13.4 has been tightening the developer loop, so with the Aspire panel, common actions can be done directly in VS Code, eliminating the need to navigate away from your IDE at all. Health check status, resource type, clickable commands, resource endpoints, and dashboard links are all shown in the panel.
Note
The Aspire panel has two modes: workspace and global. Workspace view shows running and idle AppHosts from inside the open workspace, while global view shows all running AppHosts on your machine.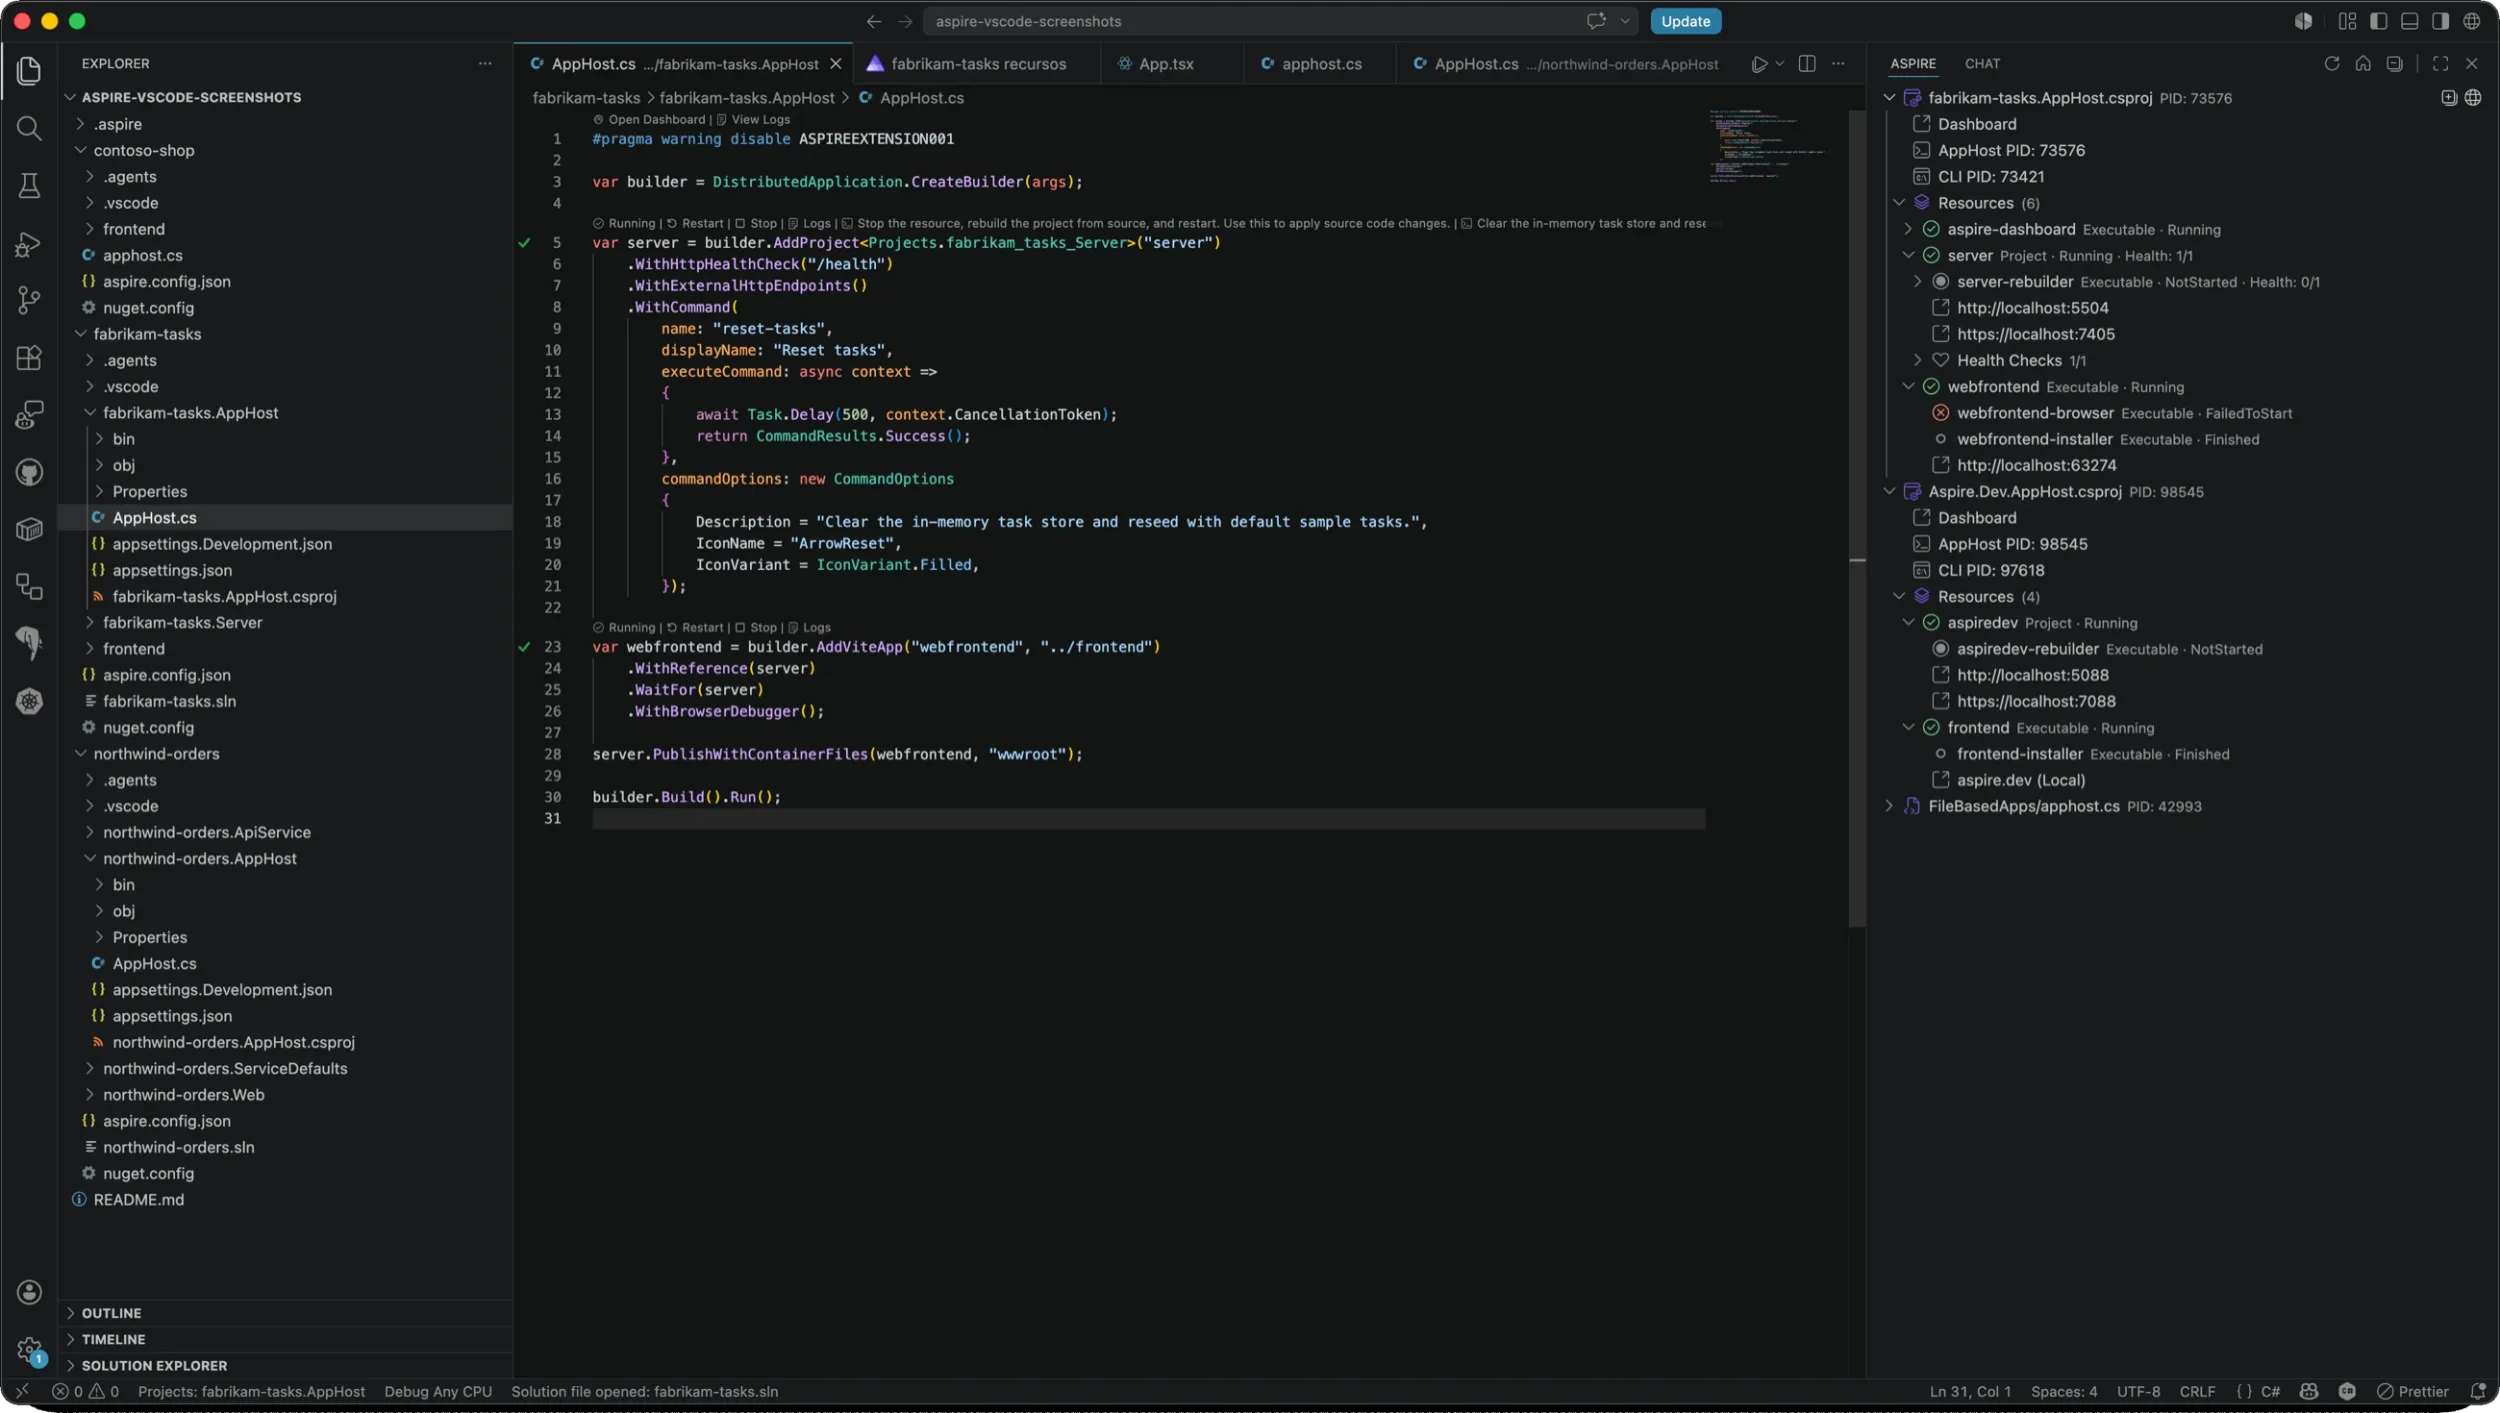
Beginning in Aspire 13.4, commands can declare typed arguments, labels, descriptions, defaults, choices, validation, and secret inputs. The extension uses VS Code prompts for those inputs, then sends the command through the Aspire CLI. Learn more about custom Aspire commands and arguments.
Dashboard stays one click away
Beginning mid-June, the Aspire dashboard will no longer open automatically when you start an AppHost from VS Code. However, you can still open the dashboard via the Aspire panel, AppHost editor, or command palette. The old behavior can be restored by setting aspire.enableAspireDashboardAutoLaunch to true and the aspire.dashboardBrowser VS Code setting to a value that will open the dashboard after launch:
integratedBrowseruses VS Code’s integrated browser.openExternalBrowseruses your system browser.debugChrome,debugEdge, anddebugFirefoxlaunch a browser of the specified type as a child debug session.
I tend to use integratedBrowser when I am in a dashboard-heavy loop, such as when I’m often looking at structured or console logs.
13.4 is also a TypeScript AppHost release
Aspire 13.4 takes the TypeScript AppHost to GA, and the VS Code extension is where a lot of that support becomes visible.
New TypeScript AppHosts use apphost.mts, and generated SDK modules live under .aspire/modules/. The extension discovers those AppHosts through the workspace config and runs/debugs them through the same type: "aspire" launch config as C# AppHosts.
If you are upgrading a 13.3.x TypeScript AppHost, update the CLI first:
aspire update --self # or use the '> Aspire: Update Aspire CLI' command
aspire update # or use the '> Aspire: Update integrations' command
Try the loop
Install or update the Aspire extension for VS Code, open an AppHost, press F5, and try the full loop:
- Use CodeLens to open the dashboard from the AppHost.
- Restart one resource from the editor.
- View that resource’s logs from CodeLens or the Aspire panel.
- Open the same resource in the dashboard when you need traces, metrics, or the full resource graph.
- Switch the Aspire panel to Global mode and interact with other running AppHosts on your machine.
If you want to suggest improvements or notice issues, please send feedback on GitHub, in Discord, or on X / Bluesky. Happy coding!
0 comments
Be the first to start the discussion.