
Debugging distributed apps is hard. When something goes wrong, the problem could be in any service, and the evidence is scattered across separate log streams, trace collectors, and configuration sources. Aspire makes telemetry a first-class concern by configuring OpenTelemetry by default and collecting all telemetry in the Aspire dashboard. The dashboard is your home for debugging:
- All telemetry from every service in one place
- Rich visualizations for traces, logs, and metrics
- Powerful filters to zero in on what matters
- No more digging through log files
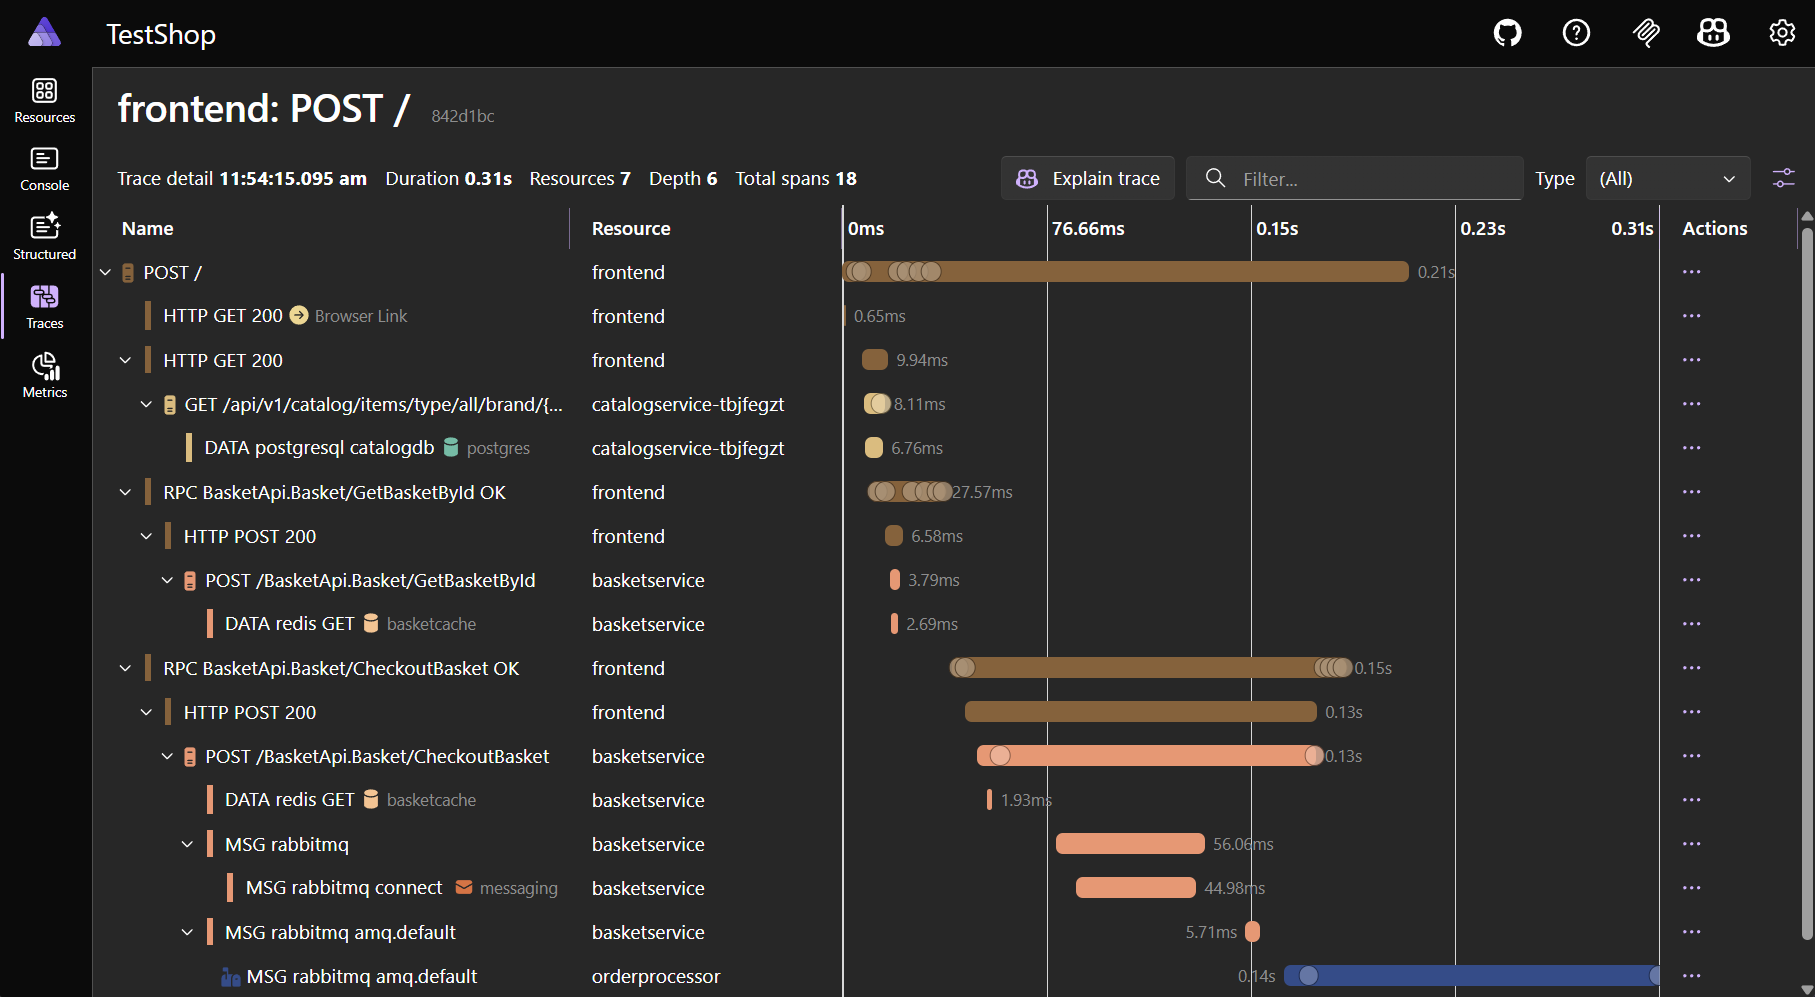
Take a tour of the Aspire dashboard. The rest of this blog post discusses what’s new in Aspire 13.2.
Export & Import Everything, Faster
A big focus for Aspire 13.2 is making telemetry more accessible—both for you and for coding agents. Export telemetry to share with teammates, attach to bug reports, or feed into AI tools for analysis.
Manage logs and telemetry dialog
The Manage logs and telemetry dialog is your one-stop-shop for managing Aspire dashboard data.
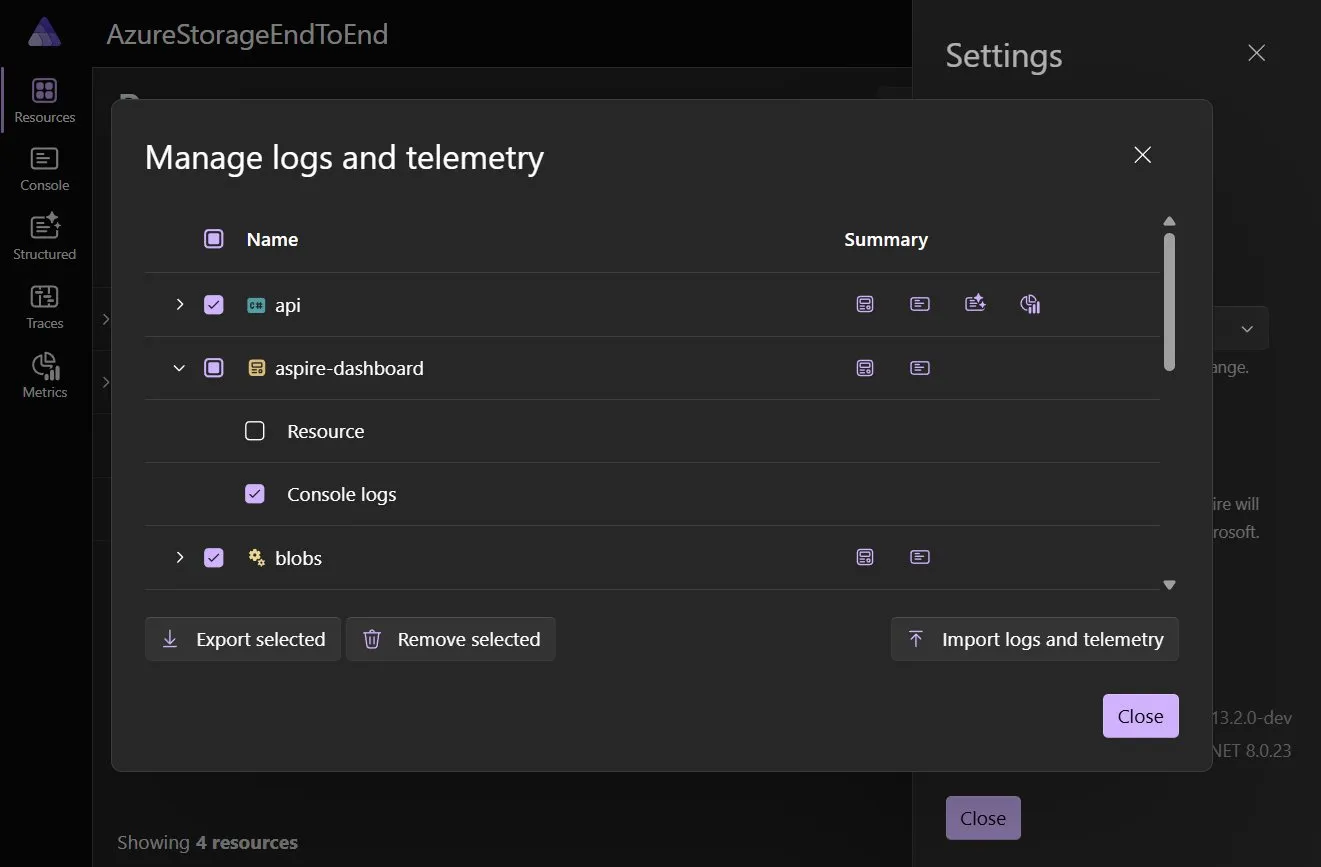
From this dialog you can:
- View resources with telemetry
- Clear telemetry
- Export telemetry
- Import telemetry
These features open up new capabilities while investigating complex issues.
For example, imagine you’re debugging a complex bug that requires a lot of setup. Finding the exact piece of telemetry can be challenging. With the new features in this dialog, you can get your app into the right state, clear all telemetry, repro the bug, and then view just the telemetry related to the bug.
In addition, telemetry can now also be exported from the dashboard. The Export select button saves selected telemetry to JSON and gives you a zip file (telemetry JSON is exported in the standardized OTLP/JSON format). You can attach telemetry to a work issue, send it to a co-worker, or point an AI agent at it for analysis.
Finally, as a cherry on top, this zip file can be re-imported into the Aspire dashboard later by you or someone else working on the app.
Traces, Spans, and Logs as JSON
We got feedback that there wasn’t an easy way to share information about one piece of telemetry. People were either copy/pasting individual fields, or taking a screenshot of the UI.
Aspire 13.2 addresses this by adding support to export data for specific resources and telemetry in the dashboard. Traces, spans, and logs have a new “Export JSON” option in context menus to quickly get telemetry data as JSON.
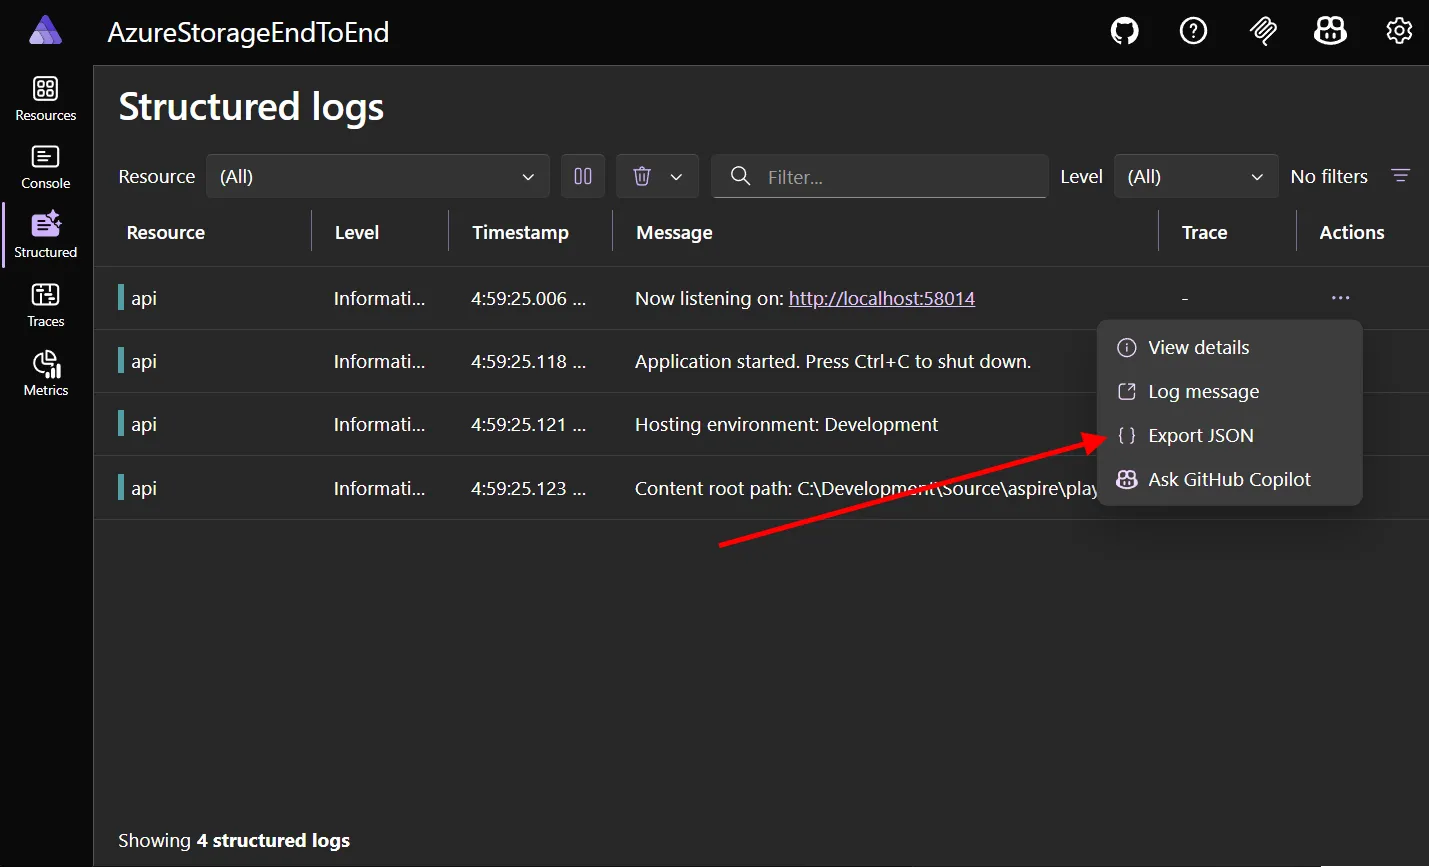
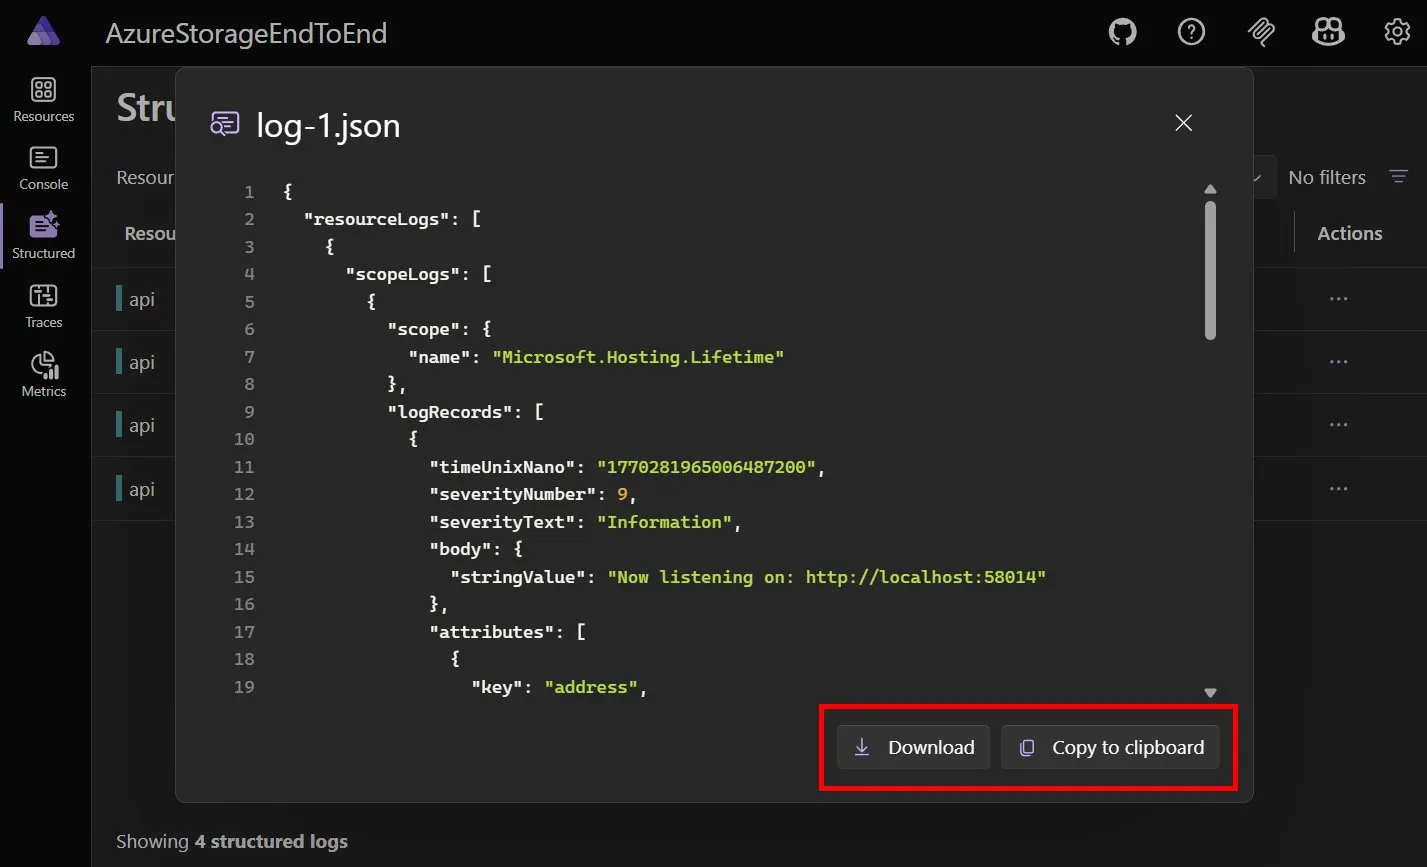
From this dialog you can copy telemetry JSON to your clipboard, or download it to your machine.
Telemetry API
The dashboard now exposes an HTTP API for querying telemetry data programmatically. These APIs power the aspire agent mcp and aspire otel Aspire CLI commands.
The API is served under /api/telemetry and returns data in OTLP JSON format. Available endpoints:
GET /api/telemetry/resources— List resources that have telemetry dataGET /api/telemetry/spans— Query spans with optional filtersGET /api/telemetry/logs— Query logs with optional filtersGET /api/telemetry/traces— List traces with optional filtersGET /api/telemetry/traces/{traceId}— Get all spans for a specific trace
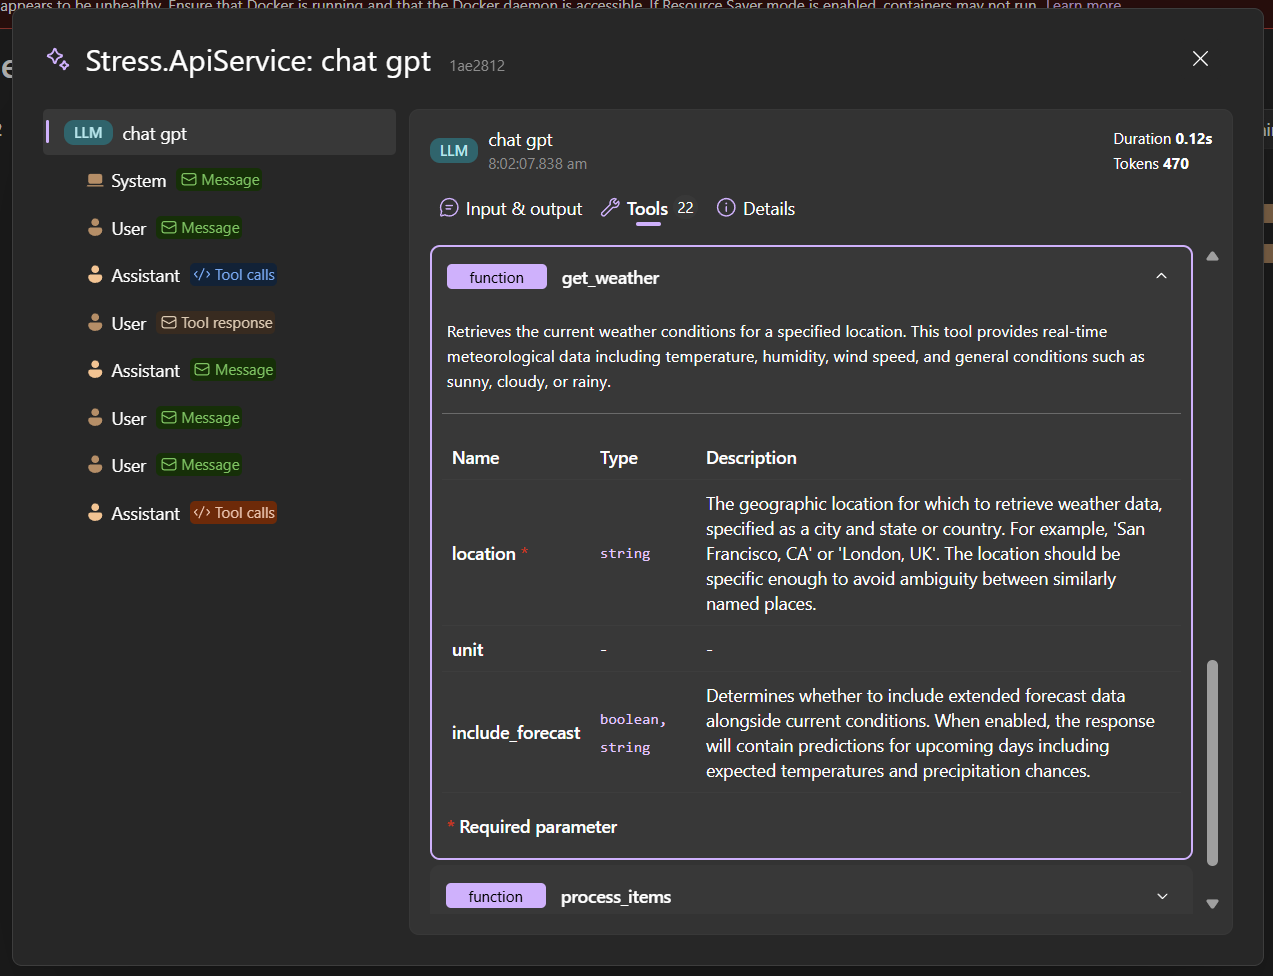
GenAI telemetry improvements
Another big area for improvement in Aspire 13.2 has been the GenAI telemetry visualizer.
Many popular coding agents have added OpenTelemetry support. For example, VS Code Copilot chat, Copilot CLI, and OpenCode all support configuring an OTEL_EXPORTER_OTLP_ENDPOINT. Pointing these agents at the Aspire dashboard has given us insight into debugging complex, real-world GenAI apps. A number of improvements have flowed out of that exercise.
Aspire 13.2 GenAI improvements:
- AI tool descriptions are now formatted as Markdown for better readability
- Selecting a Tool Definition button highlights and scrolls to the corresponding AI tool
- A new GenAI button on the traces page makes it easy to quickly view AI details in traces
- Error handling for truncated and non-standard GenAI JSON is more robust
What’s Next?
These improvements ship in Aspire 13.2. If you’re already running Aspire, upgrade and give the new dashboard features a try. If you’re new to Aspire, check out aspire.dev to get started.
Need help? Check the Aspire docs for the full feature walkthrough, or jump into the Aspire Discord to share what you build.
Get Involved
- 📖 Learn more: Read the full documentation on Aspire dashboard at aspire.dev.
- 💬 Give us feedback: We’d love to hear what you think — file issues or join discussions on the Aspire GitHub repo.
- 🌐 Join the community: Follow us and connect with other Aspire developers at aspire.dev/community.
0 comments