

If you want to skip the explain and get started super quick with adoption + impact insights, use gh-devlake to deploy a GitHub Copilot impact dashboard in a few CLI commands.
So! You’ve rolled out GitHub Copilot to your engineering teams. You’ve got the built-in dashboards. You know how many seats are assigned, what the acceptance rates look like, which editors your teams prefer. Maybe you’ve even pulled the Copilot Metrics API and built some charts.
But here’s the question your VP of Engineering or CTO is actually asking:
“Is GitHub Copilot making us ship faster? Are we more reliable? Is code review getting better?”
And the honest answer, if you’re only looking at data from our Copilot Metrics API, is: you don’t know. You know adoption. You don’t know impact.
I’ve been working with engineering teams evaluating Copilot for a while now, and this gap — between usage data and delivery outcomes — keeps coming up. The usage metrics live in one place. The deployment data lives in your CI/CD tool. The incident data lives in your issue tracker. The code review data lives in GitHub. They’re all siloed. And the question leadership is asking requires connecting them.
This post is about a solution that connects them: Apache DevLake. And more specifically, why it’s not just another dashboard — it’s a data warehouse that lets you actually answer the impact question.
The Observability Gap
GitHub gives you solid Copilot metrics out of the box:
- Seats assigned and active — who has it, who’s using it
- Acceptance rates — how often developers accept suggestions, by language, editor, and model
- Feature breakdown — completions vs. chat vs. PR summaries
- Activity trends — daily/weekly/monthly active users
This is useful for tracking rollout health. e.g. Is adoption growing? Which languages see the most use?
But these metrics exist in isolation. They tell you Copilot is being used. They don’t tell you what that usage is doing to your software delivery. To answer that, you need to correlate Copilot adoption data with the metrics that actually measure delivery performance — and those live in completely different systems.
The missing link is correlating AI adoption with actual software delivery outcomes. Not just “developers are accepting 30% of suggestions” but “during weeks with high Copilot usage, PR cycle times dropped by 33% and deployment frequency doubled.”
That’s a fundamentally different conversation.
What Makes DevLake Different: A Data Warehouse, Not a Dashboard
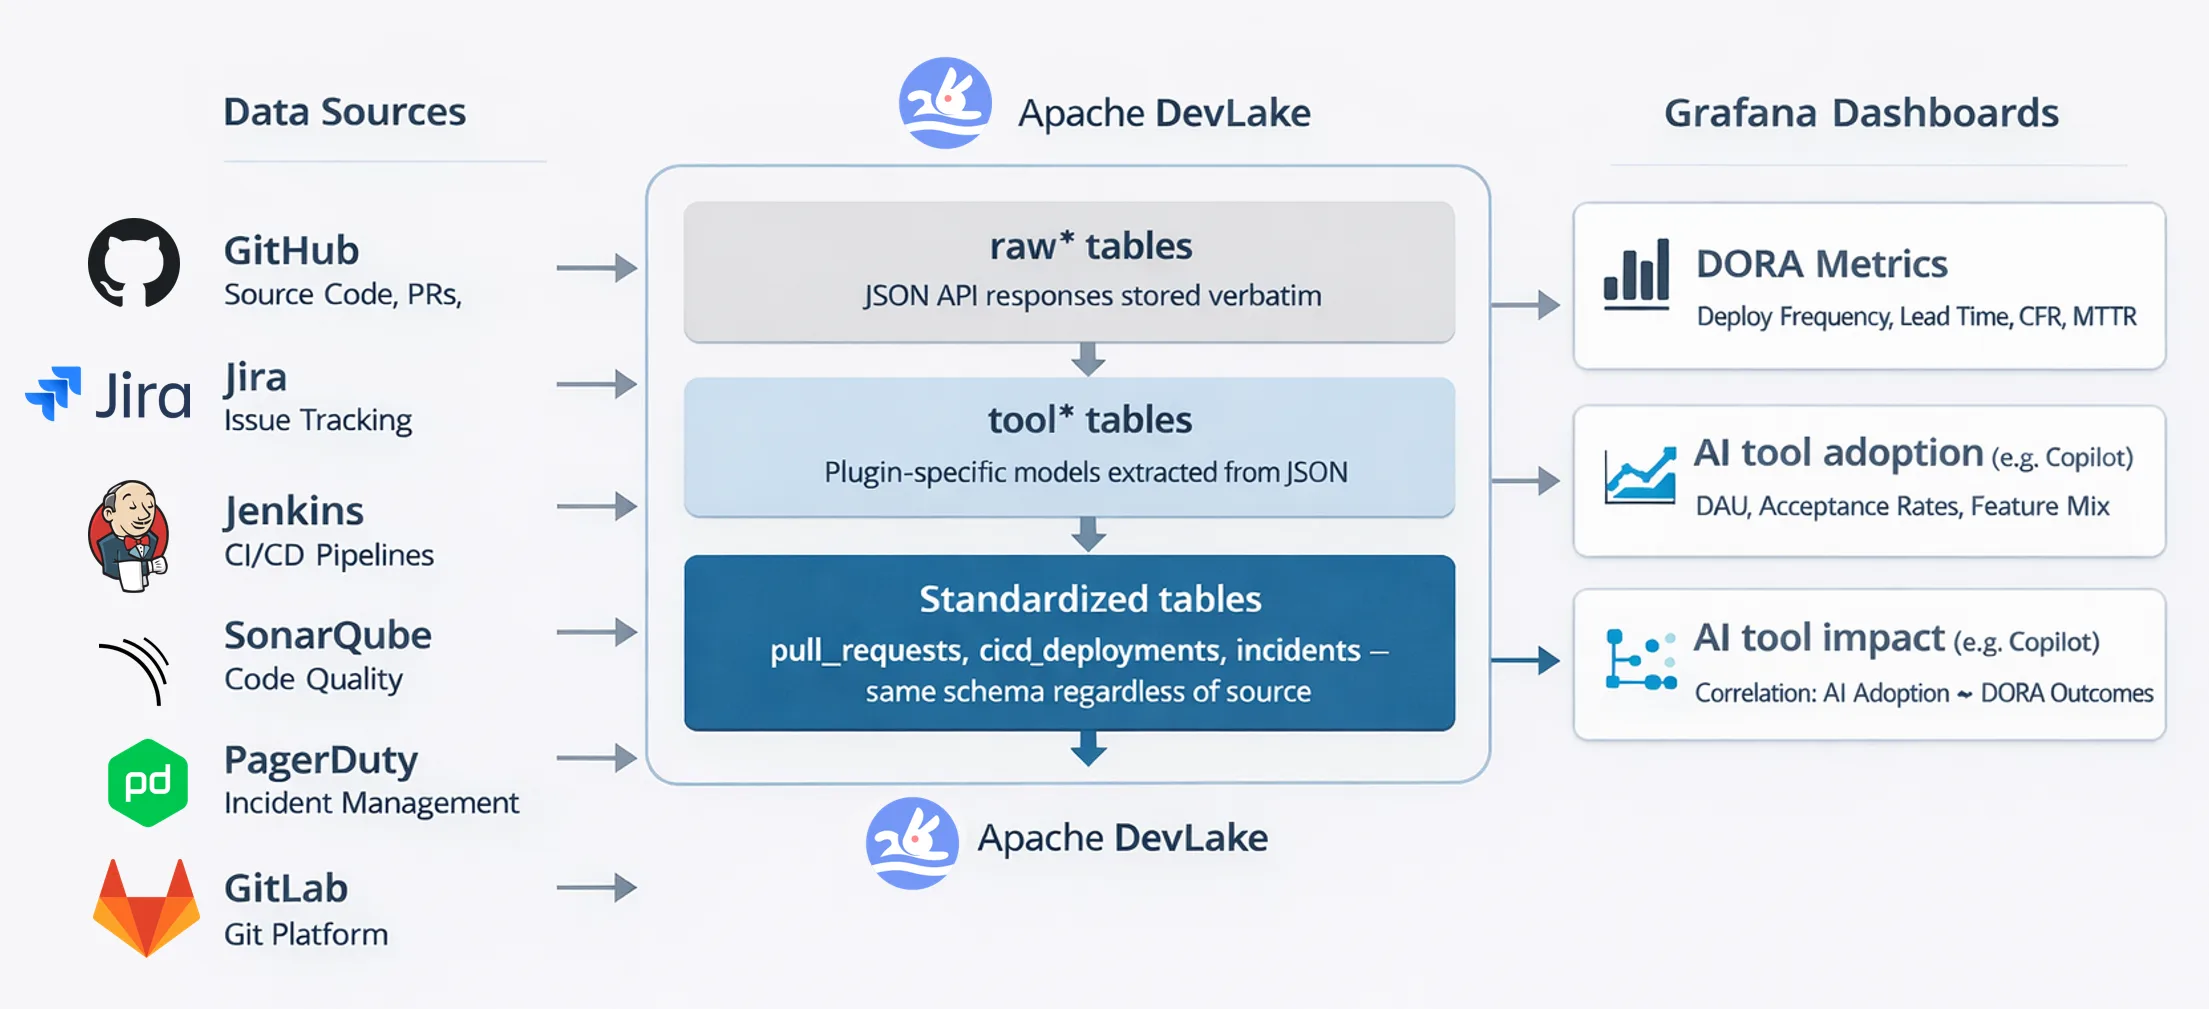
Apache DevLake is an open-source dev data platform. It’s not just a pre-built dashboard you plug in and stare at. It’s a data warehouse that ingests from your DevOps tools, normalizes everything into a standard data model, and lets you query it with SQL through Grafana.
It connects to 20+ data sources: GitHub, GitLab, Jira, Jenkins, Azure DevOps, SonarQube, PagerDuty, Bitbucket, CircleCI, and more. Each tool’s data gets standardized in one coherent schema. A Jenkins build and a GitHub Actions workflow both become cicd_deployment_commits.
This is deceptively powerful: your Jira issues, GitHub PRs, Jenkins deployments, and Copilot metrics are all sitting in the same SQL database. You can correlate them. You can ask questions that span tools.
On top of this, you can organize your data at team/repo/org levels, so you can compare data across your developer community if you are in a large Enterprise.
The Configuration Model
The way it’s setup is actually quite simple. You define:
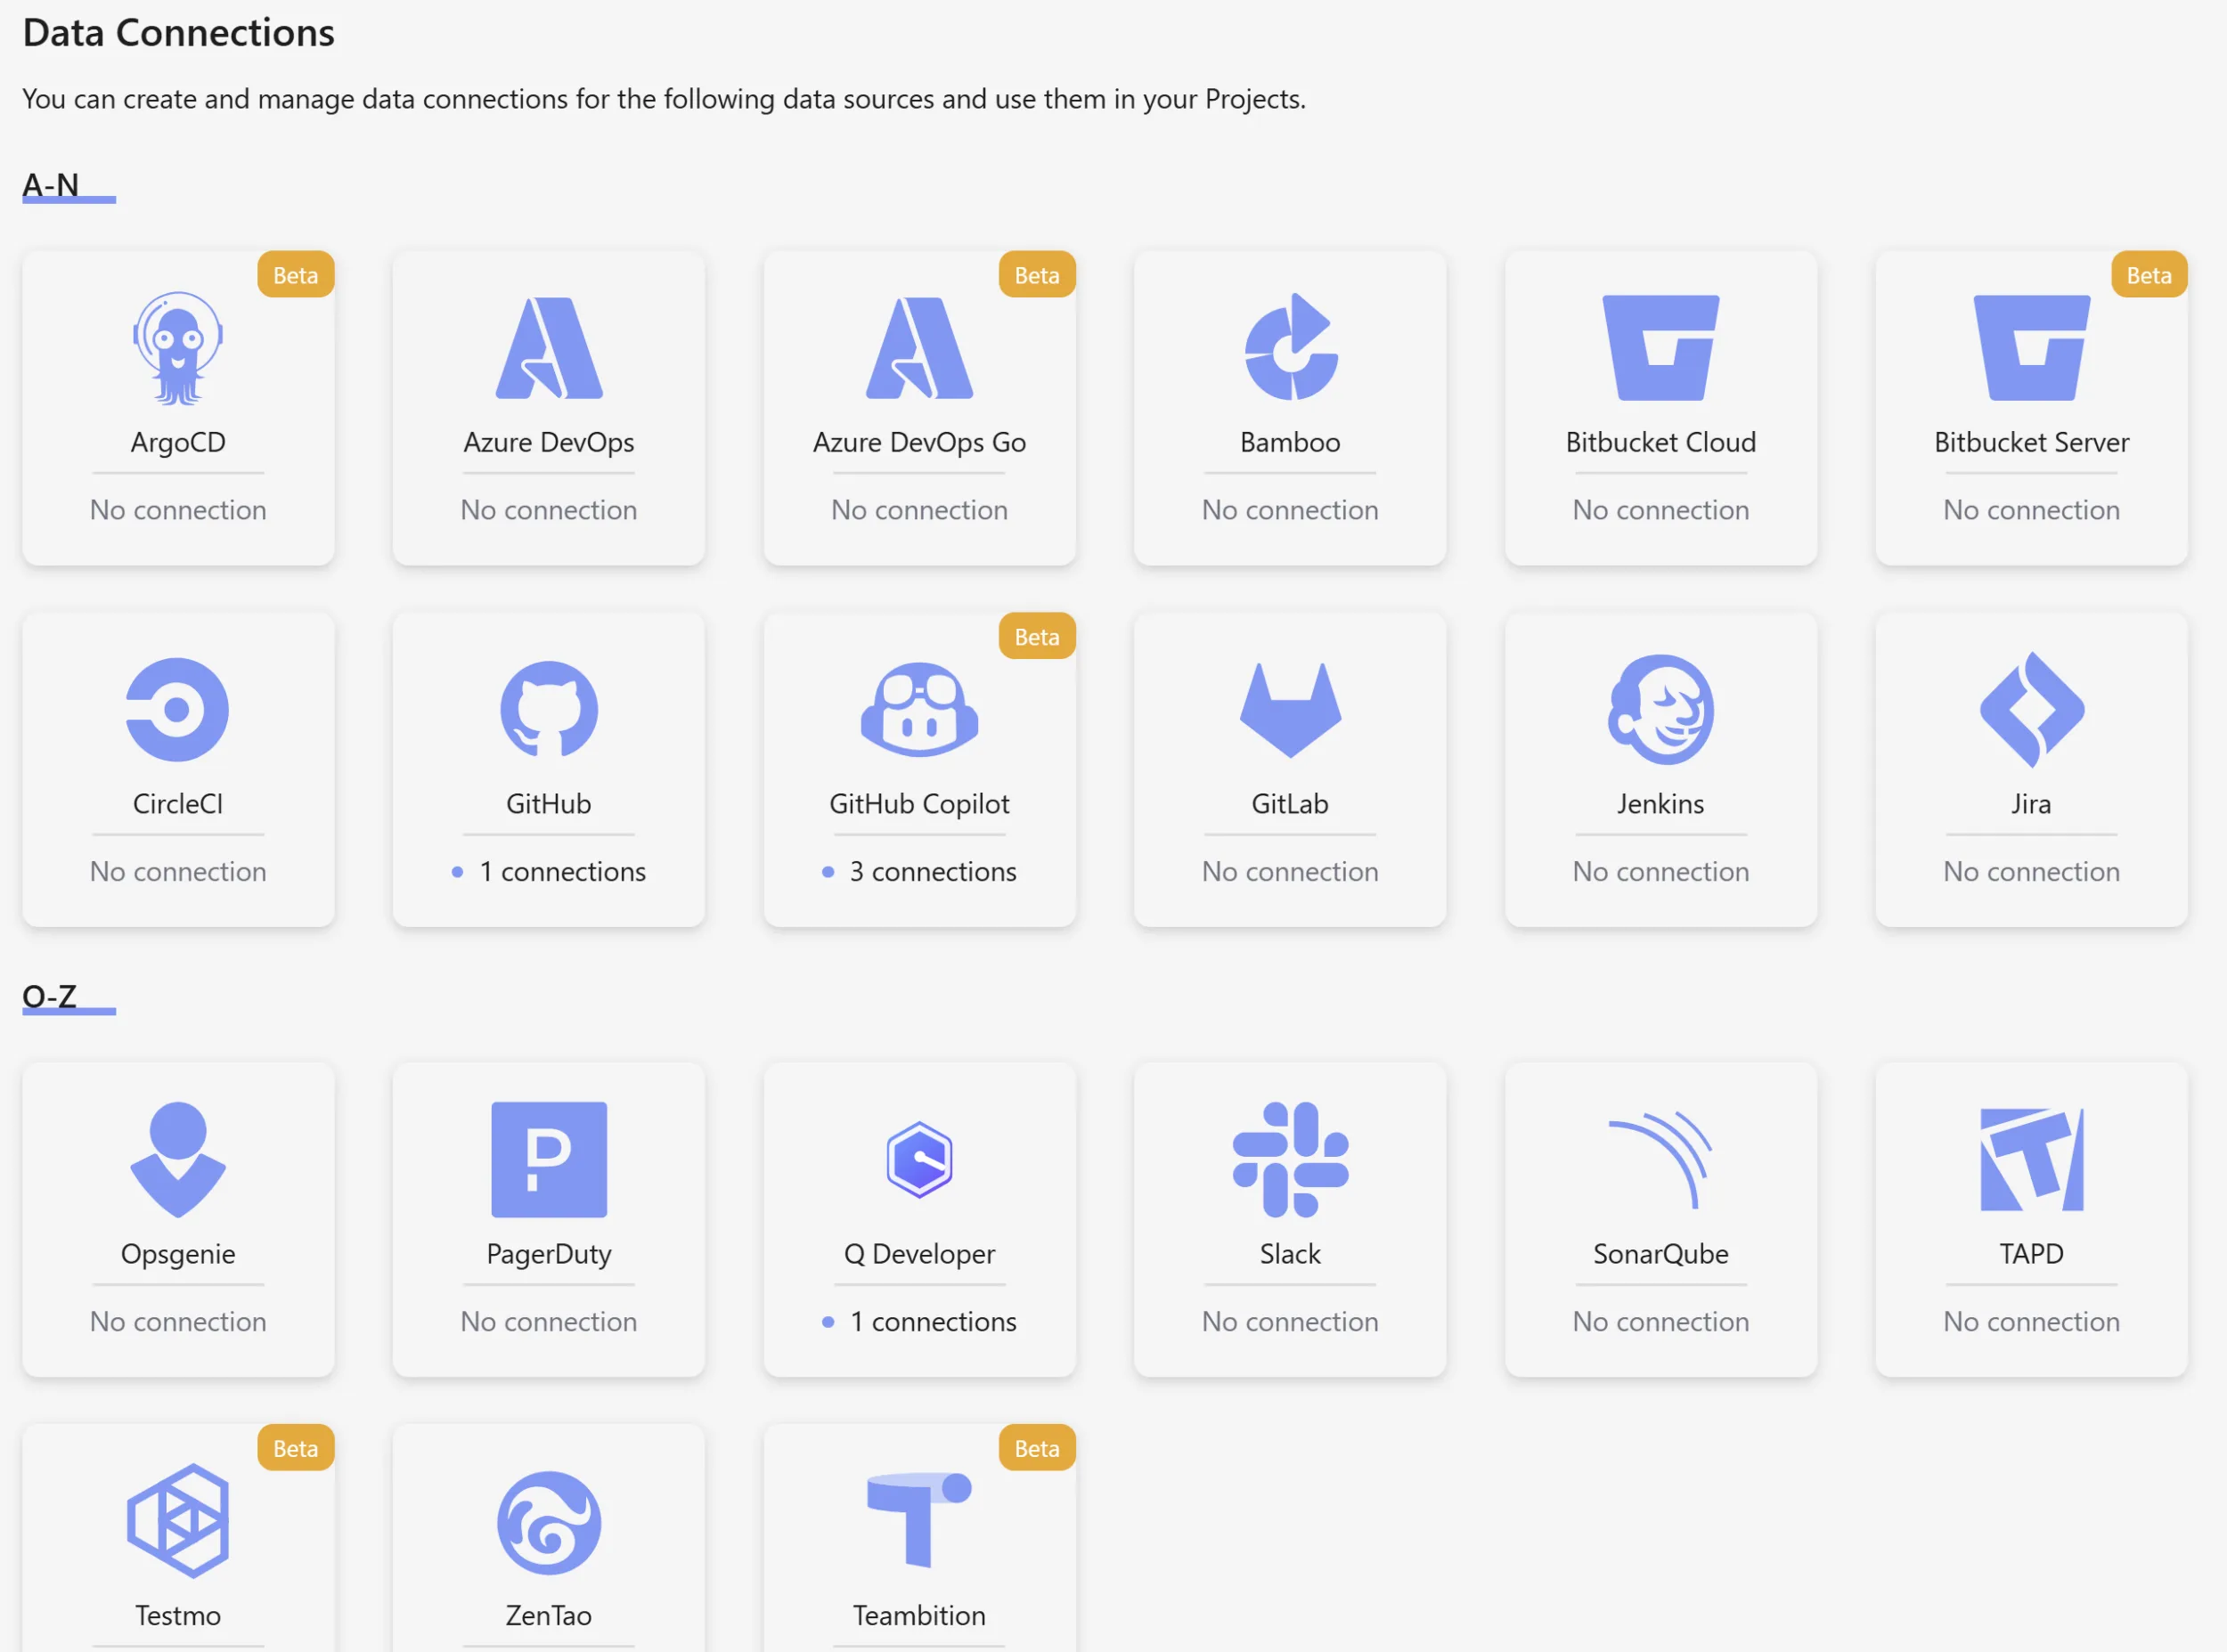
- Connections — authenticated links to each data source (your GitHub org, your Jira instance, your Jenkins server)
- Scopes — which specific repos, boards, or projects to collect from a connection
- Project — groups multiple connections/scopes together and ties the data coherently
- Blueprint — schedules recurring syncs across your connected data sources
Once configured, DevLake handles the ingestion, normalization, and makes everything queryable. The setup is straightforward — the gh-devlake CLI extension handles it in a few commands.
DORA as the Framework
If you’re going to measure software delivery performance, you need a framework that gets you started. There are several: GitHub has it’s own, and Microsoft adheres to the SPACE Framework. DORA — the DevOps Research and Assessment, is what most teams know as a starting point.
A note on frameworks: No single framework is perfect. DORA, SPACE, and others each have blind spots. For your DevEx program, you’ll want to treat them as starting points.. DORA gets you started with a solid foundation; the real work is evolving it to match your organization’s actual delivery context by identifying insights that matter.
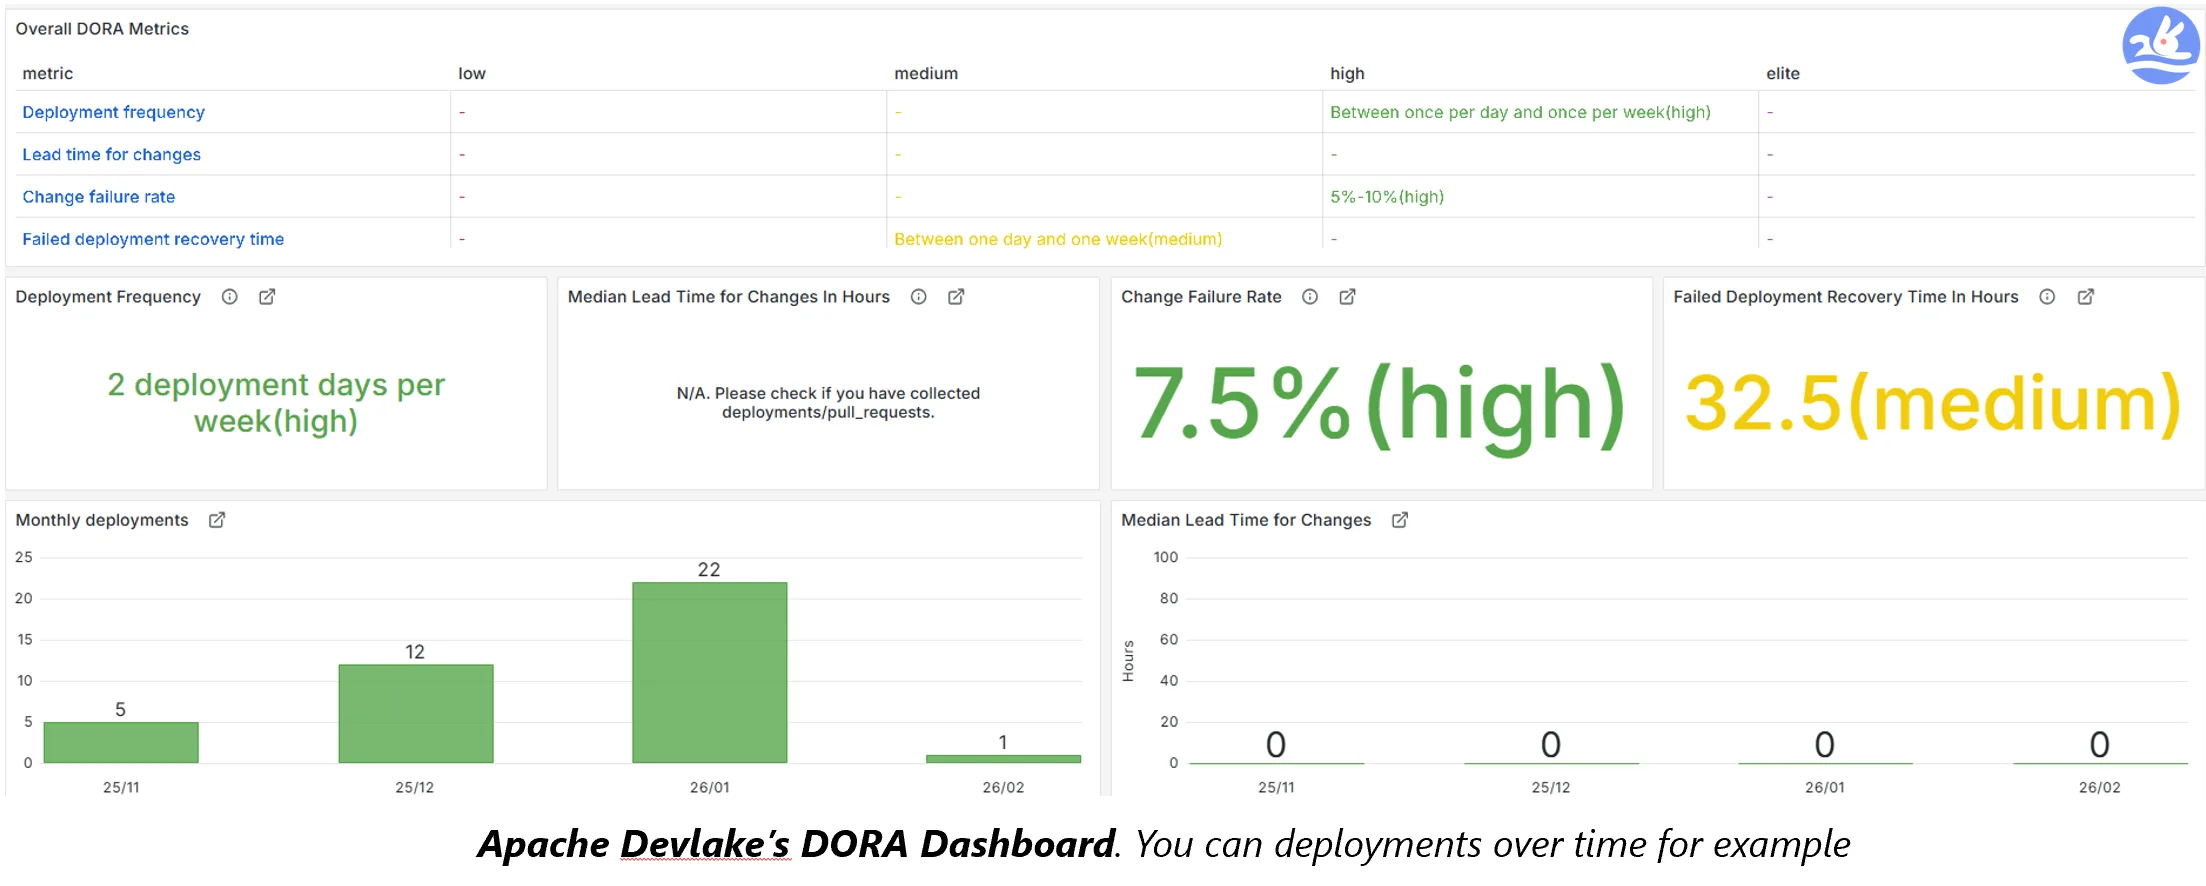
DevLake implements DORA with built-in Elite/High/Medium/Low benchmarking. You don’t need to calculate the metrics yourself or figure out how to map your CI/CD data to the framework. Configure your deployment patterns and incident labels, and DevLake does the rest.
Adding AI to the Equation: The Copilot Impact Dashboard
Our team at Microsoft has added a working gh-copilot plugin that collects Copilot metrics: daily active users, acceptance rates, language and editor breakdowns, PR summary usage, seat utilization — all the data you’d get from the Copilot Metrics API, normalized into DevLake’s domain model.
On top of this, there are two Grafana dashboards:
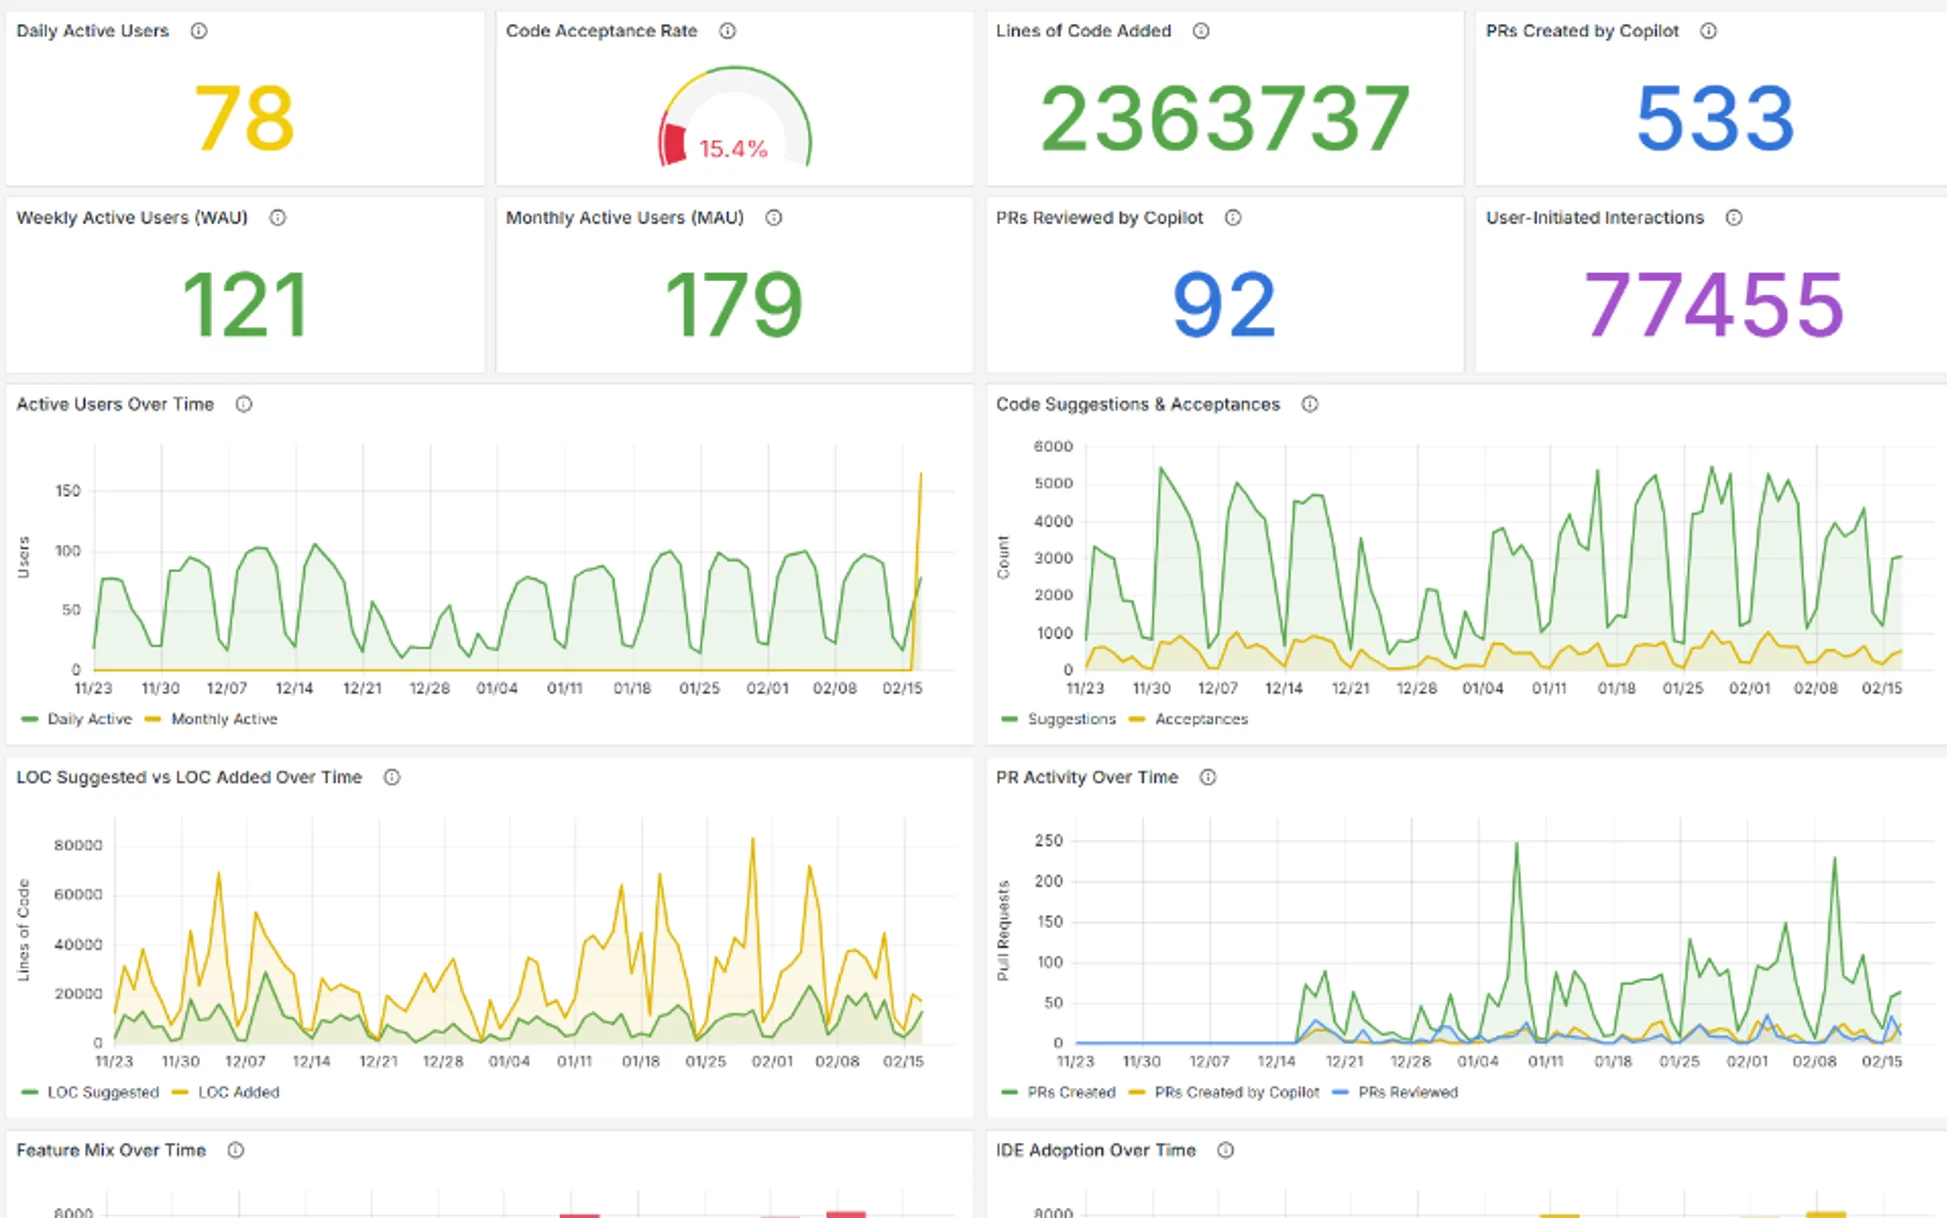
The Adoption Dashboard
This is your Copilot rollout health check. 30 panels tracking:
- DAU / WAU / MAU — Active user trends over time
- Acceptance rates — By language, by model, by editor
- Feature mix — Completions vs. chat vs. PR summaries
- Seat effectiveness — Are the seats you’re paying for actually being used?
- And more…
Think of this as the equivalent of GitHub’s built-in metrics, but living inside the same platform where all your other data sits.
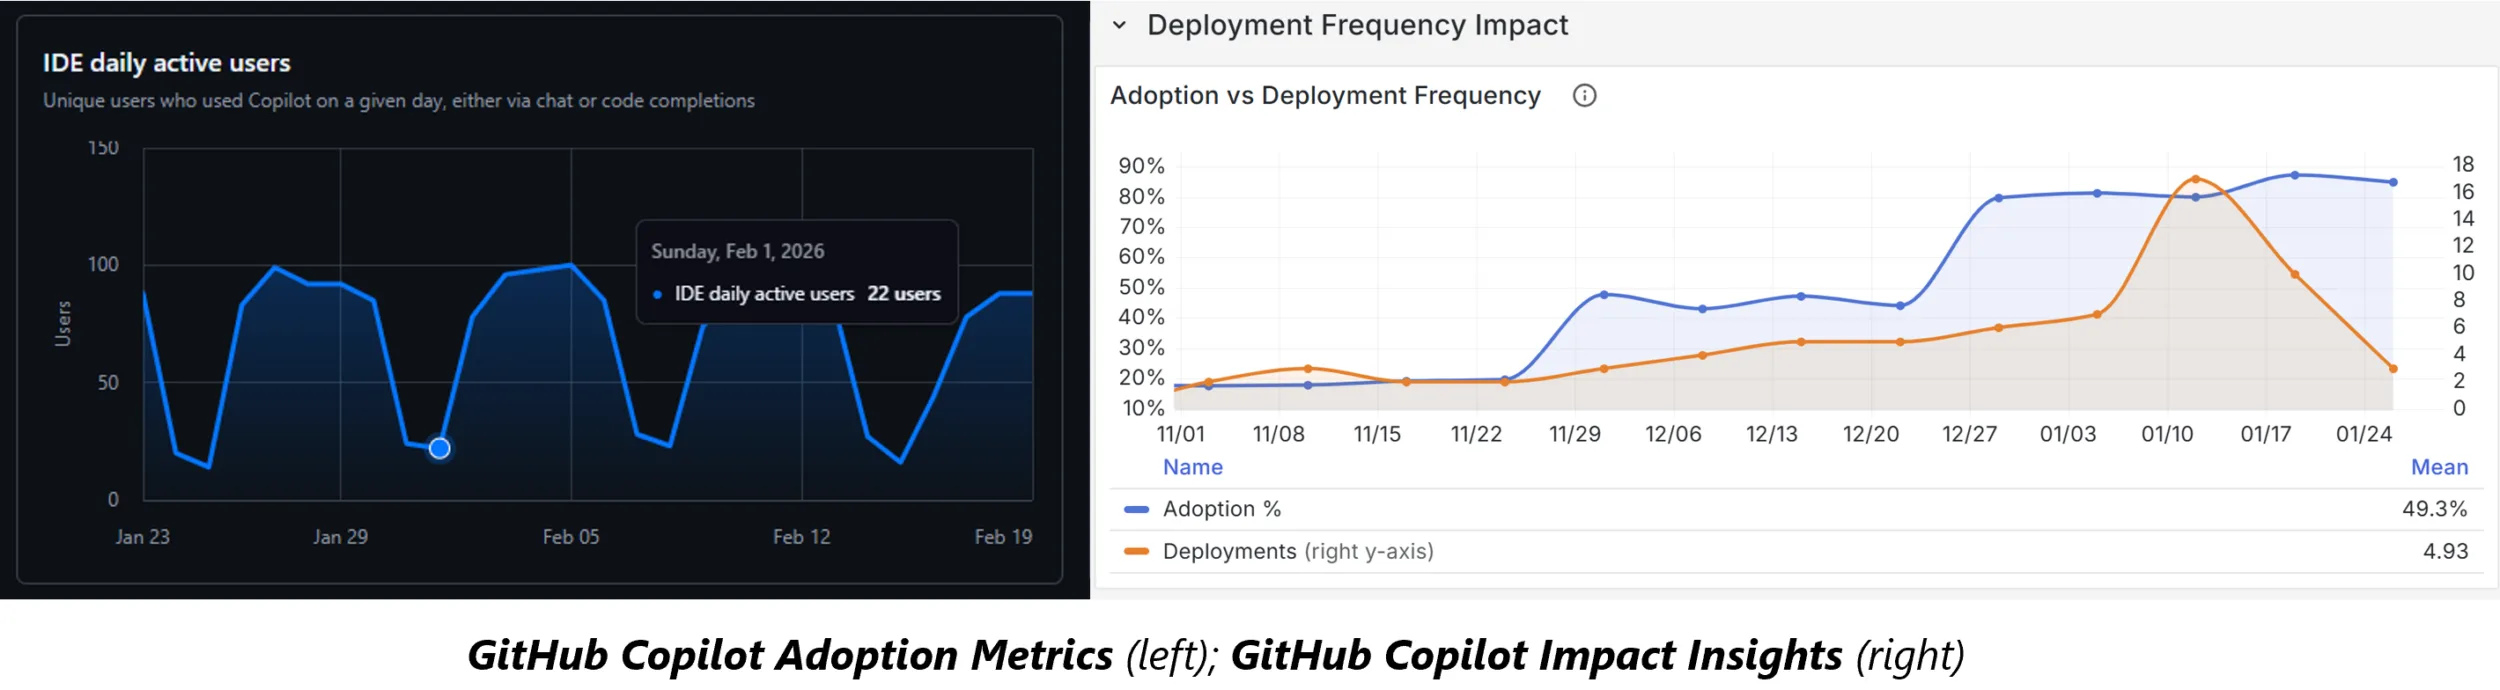
The Impact Dashboard
This is the one that answers the question leadership is asking. It correlates Copilot adoption intensity with DORA metrics.
Here’s how it works:
| Section | What It Measures |
|---|---|
| Adoption Intensity | Overall adoption trend, tier distribution, aggregate correlation |
| PR Velocity Impact | Cycle time, coding time, pickup time, review time, PR throughput |
| Deployment Frequency | Deploys per week correlated with adoption |
| Change Failure Rate | CFR % correlated with adoption (negative r = improvement) |
| Recovery Time (MTTR) | Mean time to recovery by adoption tier |
| Code Review Time | Review duration trends across adoption levels |
| Code Quality | Optional — requires SonarQube: complexity, coverage, duplicates |
And it correlates your adoption of GitHub Copilot (under 25%, 25–50%, 50–75%, above 75%) with the above
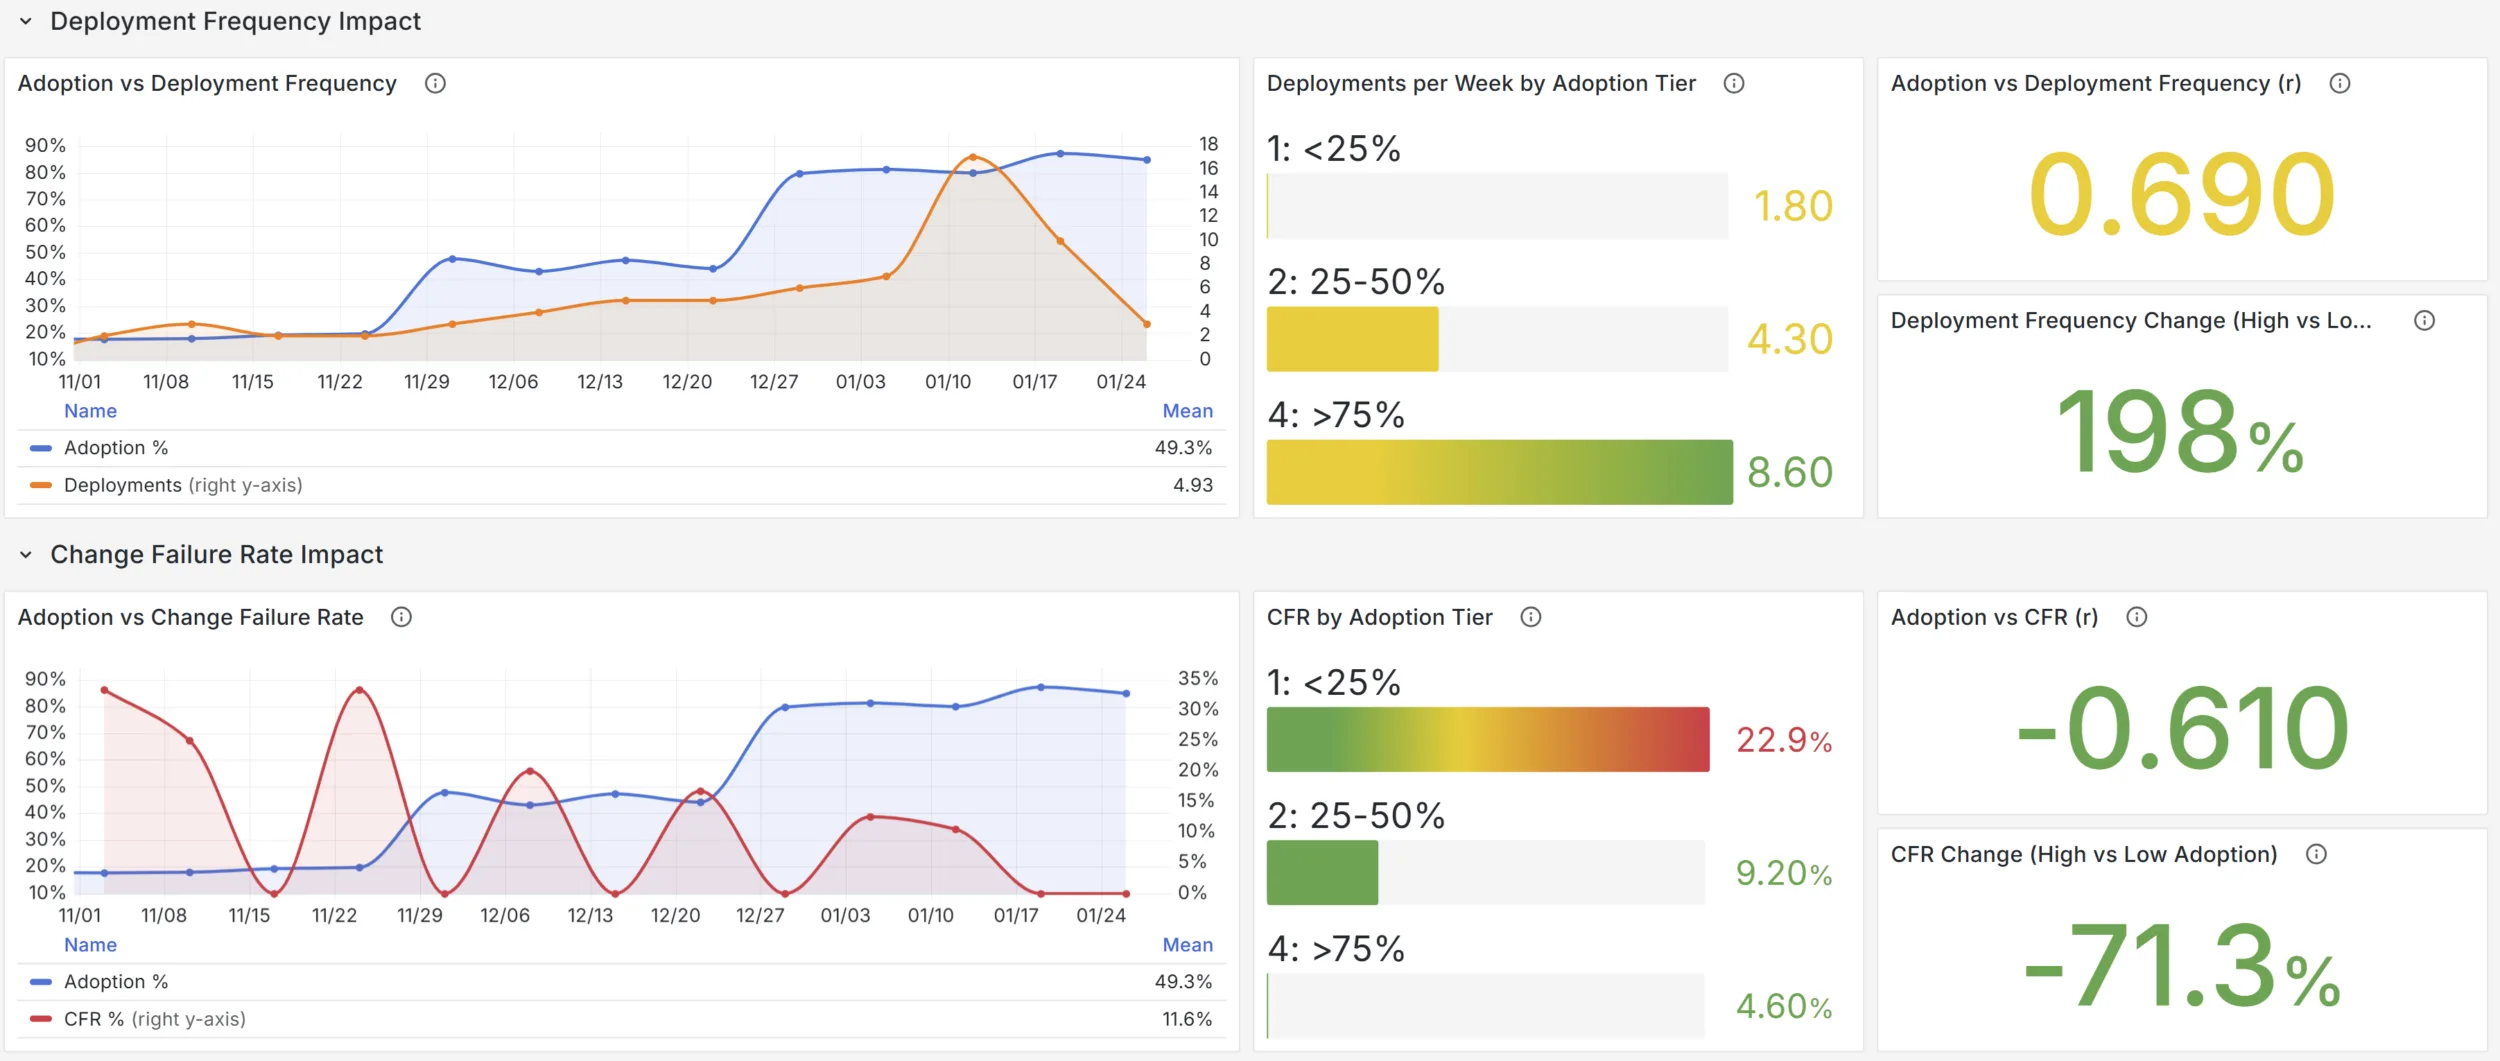
An example insight you might see: “Weeks with above 75% Copilot adoption showed 33% faster PR cycle times and 2x deployment frequency compared to weeks below 25%.” That’s the kind of data point that starts answering the right questions.
Building a Data Culture, Not Buying a Dashboard
What I find compelling about this approach is that every single panel in these dashboards is backed by a SQL query you can inspect. Click on any panel in Grafana, hit “Edit,” and you see the exact query. Don’t like how PR cycle time is calculated? Change it. Want to add a filter for a specific team? Add a WHERE clause. Want to build an entirely new panel that correlates Copilot usage with your custom deployment categories? Write the SQL.
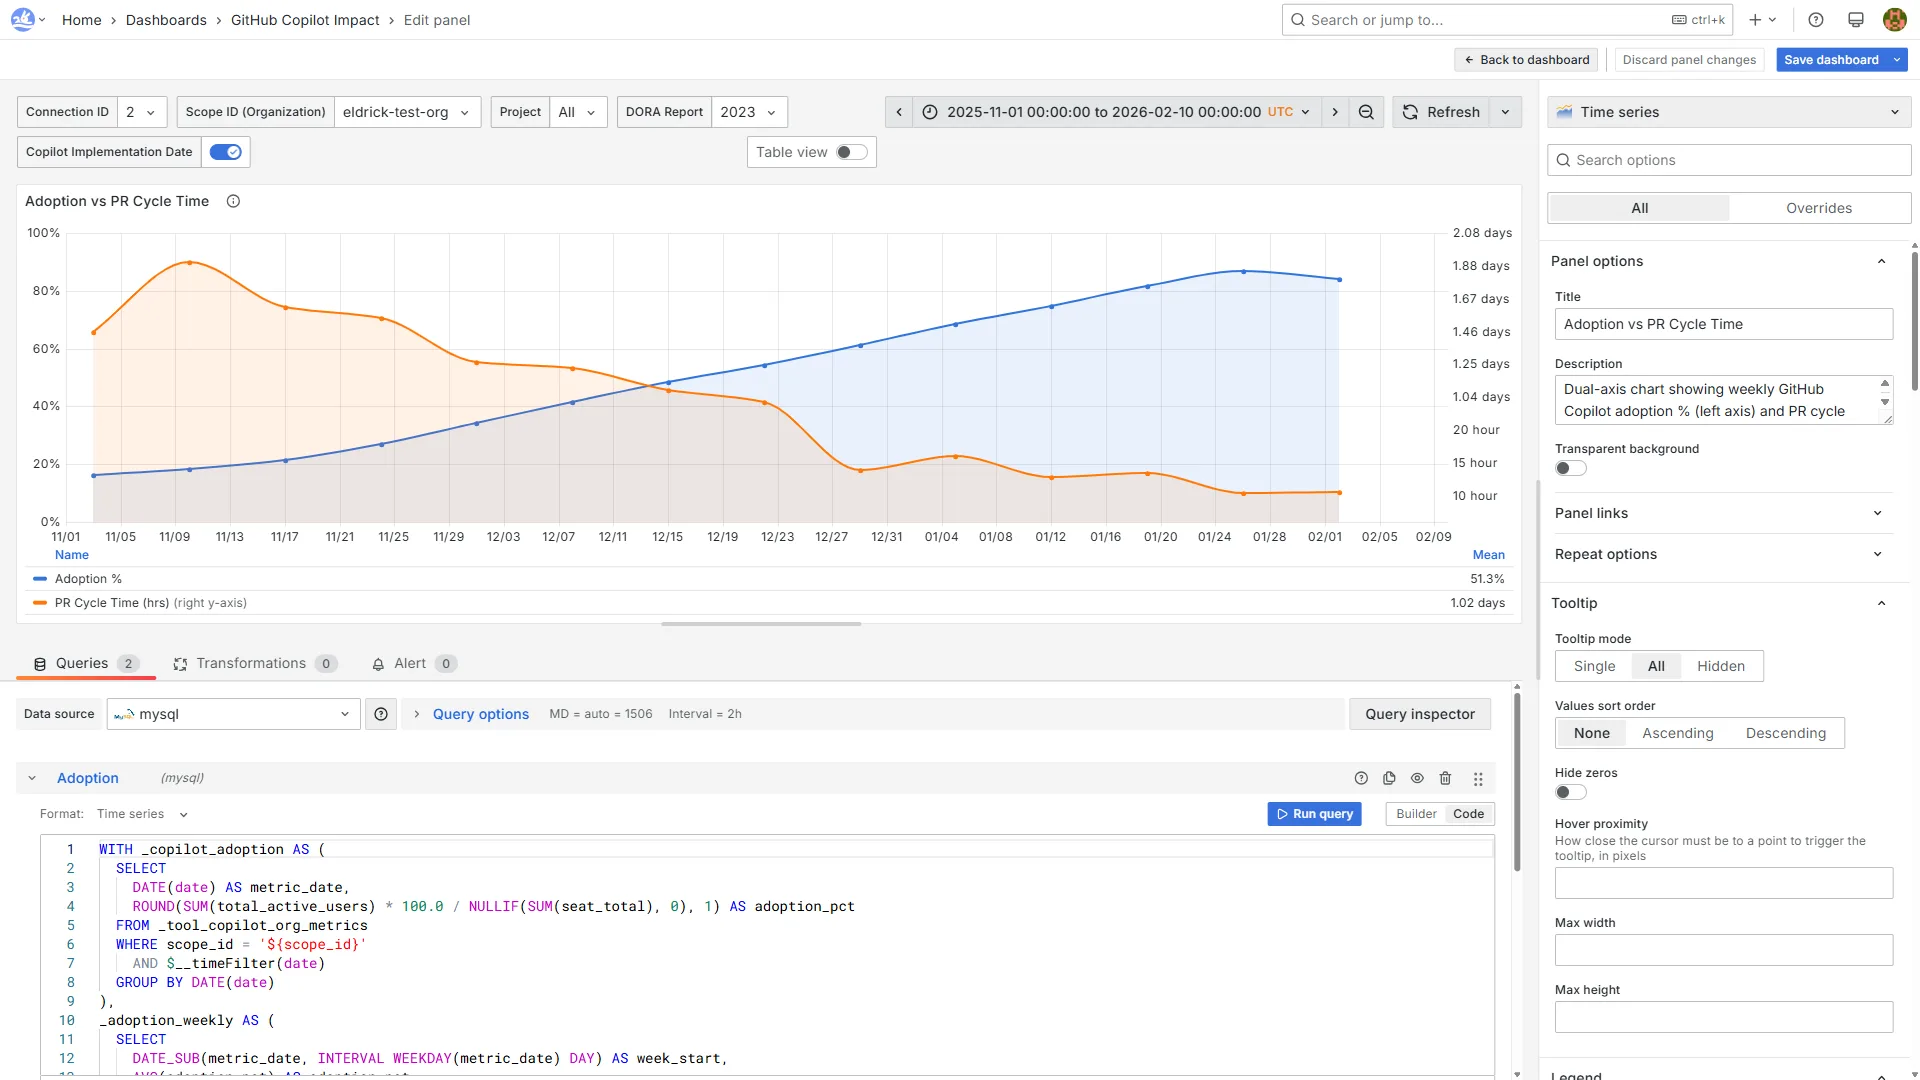
You own the data and queries, and you can extend it. DevLake has webhook support for tools it doesn’t have plugins for, and the plugin system itself is extensible, which is how we added the GitHub Copilot one!
The overall goal here is to go from “how many Copilot seats did we buy and who is using it?” to “what changed when our teams started using AI tools?” — and then do something with that answer.
Getting Started
If this resonates, the next step is getting DevLake running. I built gh-devlake — a GitHub CLI extension that takes you from zero to configured DORA + Copilot dashboards in a few commands. The README has a quick-start and full walkthrough.
Useful links:
Have questions or feedback? Open an issue on the gh-devlake repo.
0 comments
Be the first to start the discussion.