
What’s a Vector Anyway?
It’s a bit of an understatement to say that Artificial Intelligence (AI), and specifically Generative AI, is at the top of every announcement, news feed, article and discussion lately. Not just in technology, but everywhere. There are a lot of things you to learn to understand not just how to use AI, but how it works. One of those things is understanding Vectors.
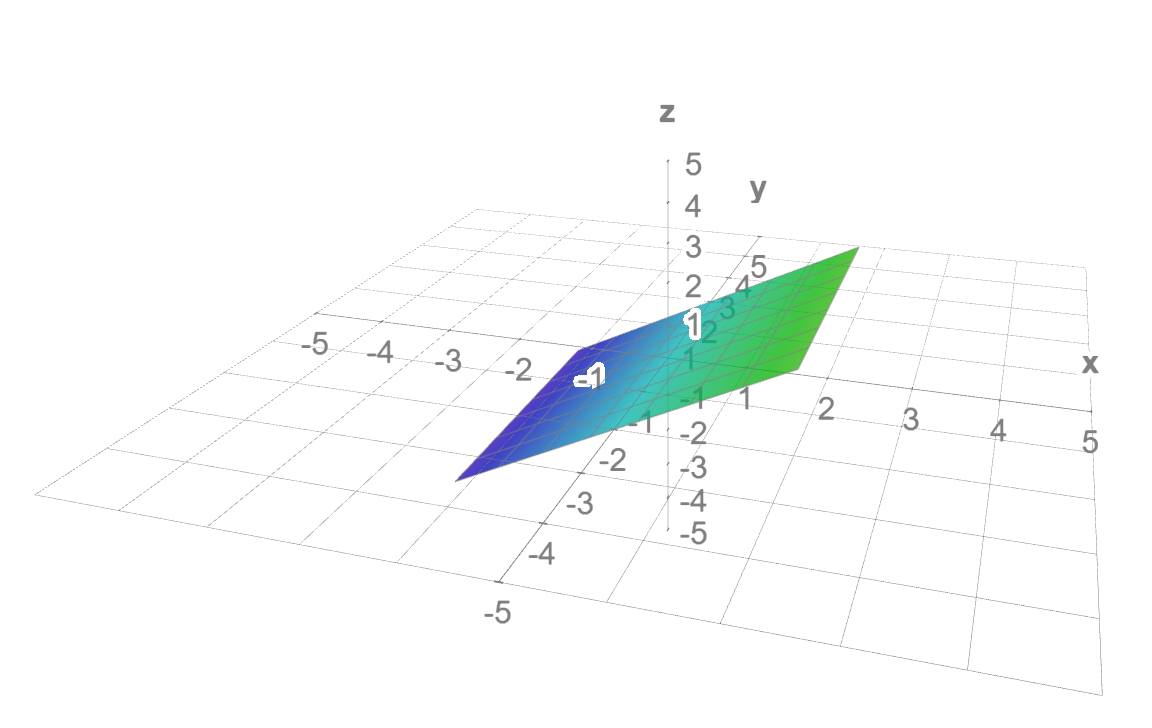
So just what is a vector? In simple terms, a vector is a mathematical object that has a magnitude (length) and a direction. You’ll probably remember from math class as an arrow pointing from one point to another on a x, y, and possibly even a z graph showing three dimensions. It really just represents a point (some data) in space (or dimension).
In the context of data science and machine learning, vectors are also used to represent data points in a multi-dimensional space. It’s a set of numbers representing something (a word, a pixel, or any object) in what is called a Vector Space. That means the math used to create those numbers (called embedding) was done in the same way across all those objects. As an example, you take a body of text (called a corpus) and run it through an algorithm that creates the numbers, which can then be related to each other with more math. From that you can show just how strongly those things are related.
Let’s say you have a story of a King and a Queen on a picnic. Within that story, the words might show how closely related the words King and Queen are, or Car and Picnic, or Sandwich and Picnic, and so on. This becomes really important as you think about Natural Language Processing and Generative AI being able to “understand” text – they don’t, really. They just calculate the relationship within those vectors.
Note: Like everything in this article, that’s a bit of an over-simplification. Embedding deals with making semantic meaning by creating representations in lower-dimensional space. If you’re into the math, you can read more about that here. However, these statements are enough for you to work through vectors on your own.
OK, let’s look at a real example. Suppose we have a pizza shop, and we want to analyze the popularity of different toppings. We could represent each topping as a vector, where the magnitude corresponds to the popularity of the topping. For instance, let’s say we have four toppings: Cheese, Mushrooms, Olives, and Pineapple. We take a survey, and represent these as vectors in just two dimensions:
– Cheese: [0.9, .9]
– Mushrooms: [0.8, 0.7]
– Olives: [0.6, 0.5]
– Pineapple: [0.9, 0.1]
The first part of the array of numbers in that list represents percentage of customers who answered the survey, and the second the percentage of how popular the topping is overall. To find the similarity between Cheese (the most popular) and the other toppings, we could use the cosine similarity formula, which again, is just one measurement of that distance:

…where A ⋅ B is the dot product of A and B, and ||A|| and ||B|| are the magnitudes of A and B. The right-side of the equals sign shows a longer breakout of the same information. (Yes, that’s a bit of math, but it is unavoidable in dealing with vectors).
So now let’s see it work – Using Python. We can use this code to calculate the cosine similarity between Cheese (which everyone seemed to like) and the other toppings:
# Grab the math library we need and use it to define some variables
import torch
import torch.nn.functional as F
import math
# Create 4 Vectors From our Survey
A = torch.tensor([.9, .9])
B = torch.tensor([.8, .7])
C = torch.tensor([.6, .5])
D = torch.tensor([.9, .1])
# Calculate cosine similarity cos(𝜃) between each item:
print("Cosine Similarity for Cheese and Mushrooms:", F.cosine_similarity(A, B, dim=0))
print("Cosine Similarity for Cheese and Olives:", F.cosine_similarity(A, C, dim=0))
print("Cosine Similarity for Cheese and Pineapple:", F.cosine_similarity(A, D, dim=0))
Cosine Similarity for Cheese and Mushrooms: tensor(0.9978)
Cosine Similarity for Cheese and Olives: tensor(0.9959)
Cosine Similarity for Cheese and Pineapple: tensor(0.7809)
This gives us the cosine similarity between Cheese and the other toppings. As you can see, the cosine similarity between Cheese and Pineapple is the lowest, which shows that they are the least similar (further away) in terms of popularity. “Thus it is proven” that Pineapple does NOT belong on a Pizza!
To visualize this, we can use a scatter plot to visualize these vectors in a 2D space. Here’s an example, once again using Python, following the previous code:
# Plot the vectors
plt.figure()
plt.quiver(0, 0, A[0], A[1], angles='xy', scale_units='xy', scale=1, color='red', label='A (Cheese)')
plt.quiver(0, 0, B[0], B[1], angles='xy', scale_units='xy', scale=1, color='green', label='B (Mushrooms)')
plt.quiver(0, 0, C[0], C[1], angles='xy', scale_units='xy', scale=1, color='blue', label='C (Olives)')
plt.quiver(0, 0, D[0], D[1], angles='xy', scale_units='xy', scale=1, color='orange', label='D (Pineapple)')
# Set the plot limits
plt.xlim(0, 1)
plt.ylim(0, 1)
# Add labels and a legend
plt.xlabel('Responses %')
plt.ylabel('Popularity %')
plt.title('Topping Popularity')
plt.legend(loc="upper left")
# Show the plot
plt.grid(True)
plt.show()
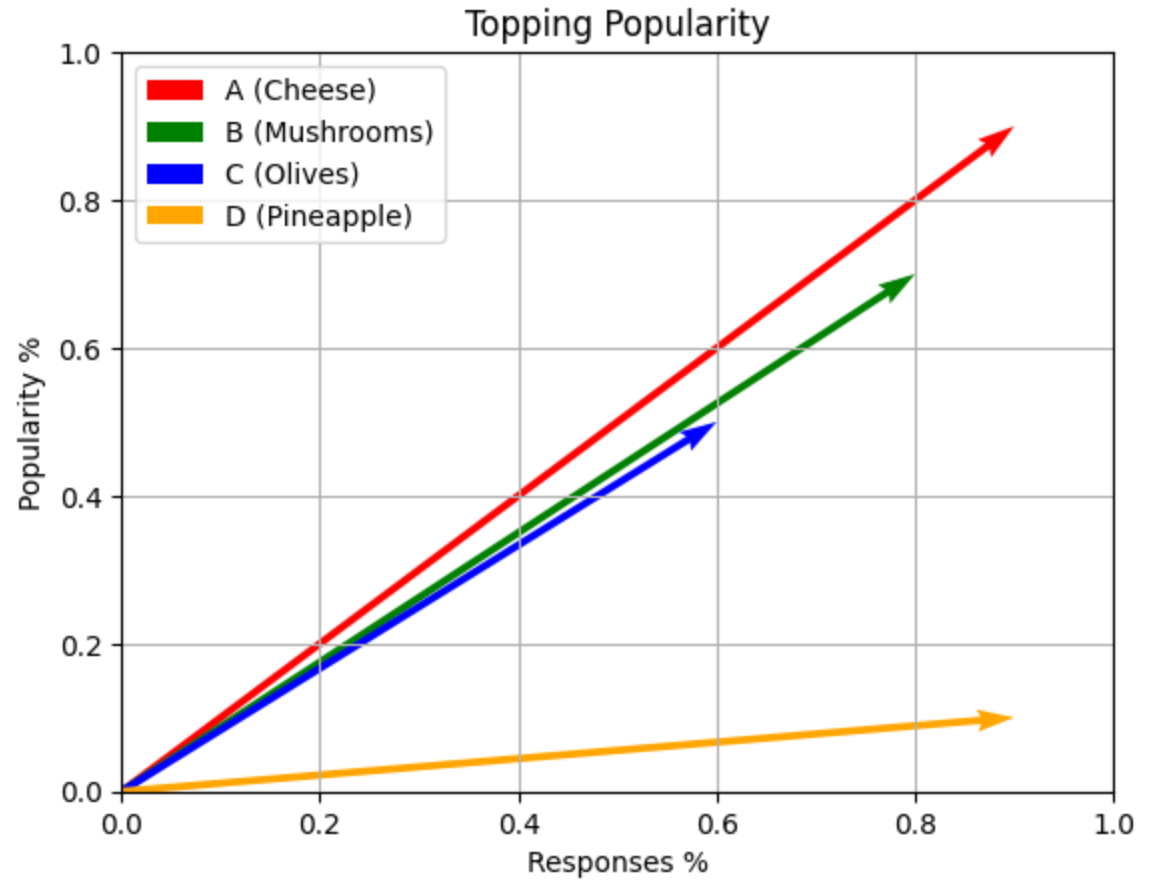
In this plot, each arrow represents a vector (a pizza topping), with the tail at the origin (0,0) and the head at the point representing the popularity of the topping. The red arrow represents Cheese, the blue arrow represents Mushrooms, the green arrow represents Olives, and the yellow arrow represents Pineapple. As you can see, the Pineapple vector is the shortest, indicating low popularity – among everyone.
This simple example has direct numbers – the survey and the choice. But to turn abstract things like words or graphics into Vector numbers, you can use a library in a programming language like Python to create those numbers. This group of numbers, created in the same way, is the Vector Space.
Those numbers need to be stored somewhere. AI can use, and you can use, a Vector Database for that. A Vector Database is a type of database that uses vector math to store and search data. It is particularly useful when dealing with high-dimensional data – such as images, text, and audio. The advantages of vector databases lies in their ability to perform efficient similarity searches – finding items that are close to each other to a given item in the vector space. You can read our announcement about Vector Support in Azure SQL Database here.
Let’s look a little closer at vectors in Generative AI. Some models, like GANs (Generative Adversarial Networks), use vectors to generate new, synthetic data that resembles the original input data (that corpus we used earlier). These models work in a high-dimensional vector space where each point corresponds to a possible output. By moving and manipulating these points (vectors), the model can generate a wide variety of outputs – new data. Send in the story, it can make a new one. Show it some pictures, it can make a new one, because it uses vectors to figure out how strong the relationships are, which then helps with semantics – or what can even be called meaning. Grouping things that are often found together tends to make for sentences that make, well, sense.
Searching vectors in a database involves finding the vectors that are most similar to another query vector. You do this using a measure of distance or similarity – such as Euclidean distance or like we did in the Pizza example, Cosine Similarity. By the way, there are other measures of this similarity, which you can read about here.
Vectors are not only important in the original data generation process. They can also be used to help out the response a Large Language Model gives back. Since the models are trained on a vast body of text, they can generate a lot of things. But they don’t know what they haven’t seen. We can help them a bit by telling them more information about what we want them to know as part of our question. We can take our own data – stored as vectors – and add it to the process the model uses to respond. This process is part of what is called Retrieval Augmented Generation – the model gets more data to make the response better. It’s similar to someone telling you “I would love to know more about how to make soup. I do know a lot about vegetables though.” That little bit at the end is quite helpful, especially if you had planned to explain vegetables as part of your response.
Vectors are a fundamental concept in data science and machine learning. They allow us to represent complex, high-dimensional data in a way that machines can understand and manipulate. Whether its deciding which pizza topping to stock up on or generating a new piece of art with a GAN, vectors are at the heart of the action.
 Light
Light Dark
Dark
2 comments
Thanks for the explanation.
In one of the paragraphs, it said “The red arrow represents _Pepperoni_”. This should be changed to _Cheese_
Ah – you are correct! I will fix that now….