
Say Hello to the Xamarin Profiler
As developers, we have many tools at our disposal to help catch problems in our code (and protect our sanity); for example, IDE features such as IntelliSense find errors as we type, a debugger gives us a window into the app when it’s running, and a profiler, in turn, shows us how our app is using resources and where it could be more effective. The Xamarin Profiler is currently the only way to profile managed (C#) code and find memory and performance issues in Xamarin applications. It can also be paired with native profilers, like Xcode Instruments and Android Monitor, to ensure better app behavior and performance.
Last week at Microsoft Connect(); we announced the first stable release of the Xamarin Profiler, available today from the Xamarin download page as part of the full Xamarin installation for MSDN Enterprise subscribers or download the standalone installer here. We have designed beautiful, native Profiler apps for both Mac and Windows to help collect and interpret profiling data.
Launching the Profiler
To start a profiling session, launch an application on device or simulator with the Xamarin Profiler attached. In Visual Studio, open your Xamarin project and choose Analyze > Xamarin Profiler to begin the session. In Xamarin Studio and Visual Studio for Mac, choose Run > Start Profiling.
Xamarin Profiler sessions can also be saved in the mlpd format (Mono Log Profiler Data). Double-clicking on an mlpd file will open it in the Xamarin Profiler. These files can be moved between Windows and Mac.
Instruments
When Xamarin Profiler launches, it will ask you to select an instrument or group of instruments to gather data about your app. Each instrument gathers certain information about an application to help diagnose different types of problems. The Xamarin Profiler comes with three instruments: Allocations, Time Profiler, and Cycles. Let’s dive into each one to learn how it can help us build better apps.
Allocations
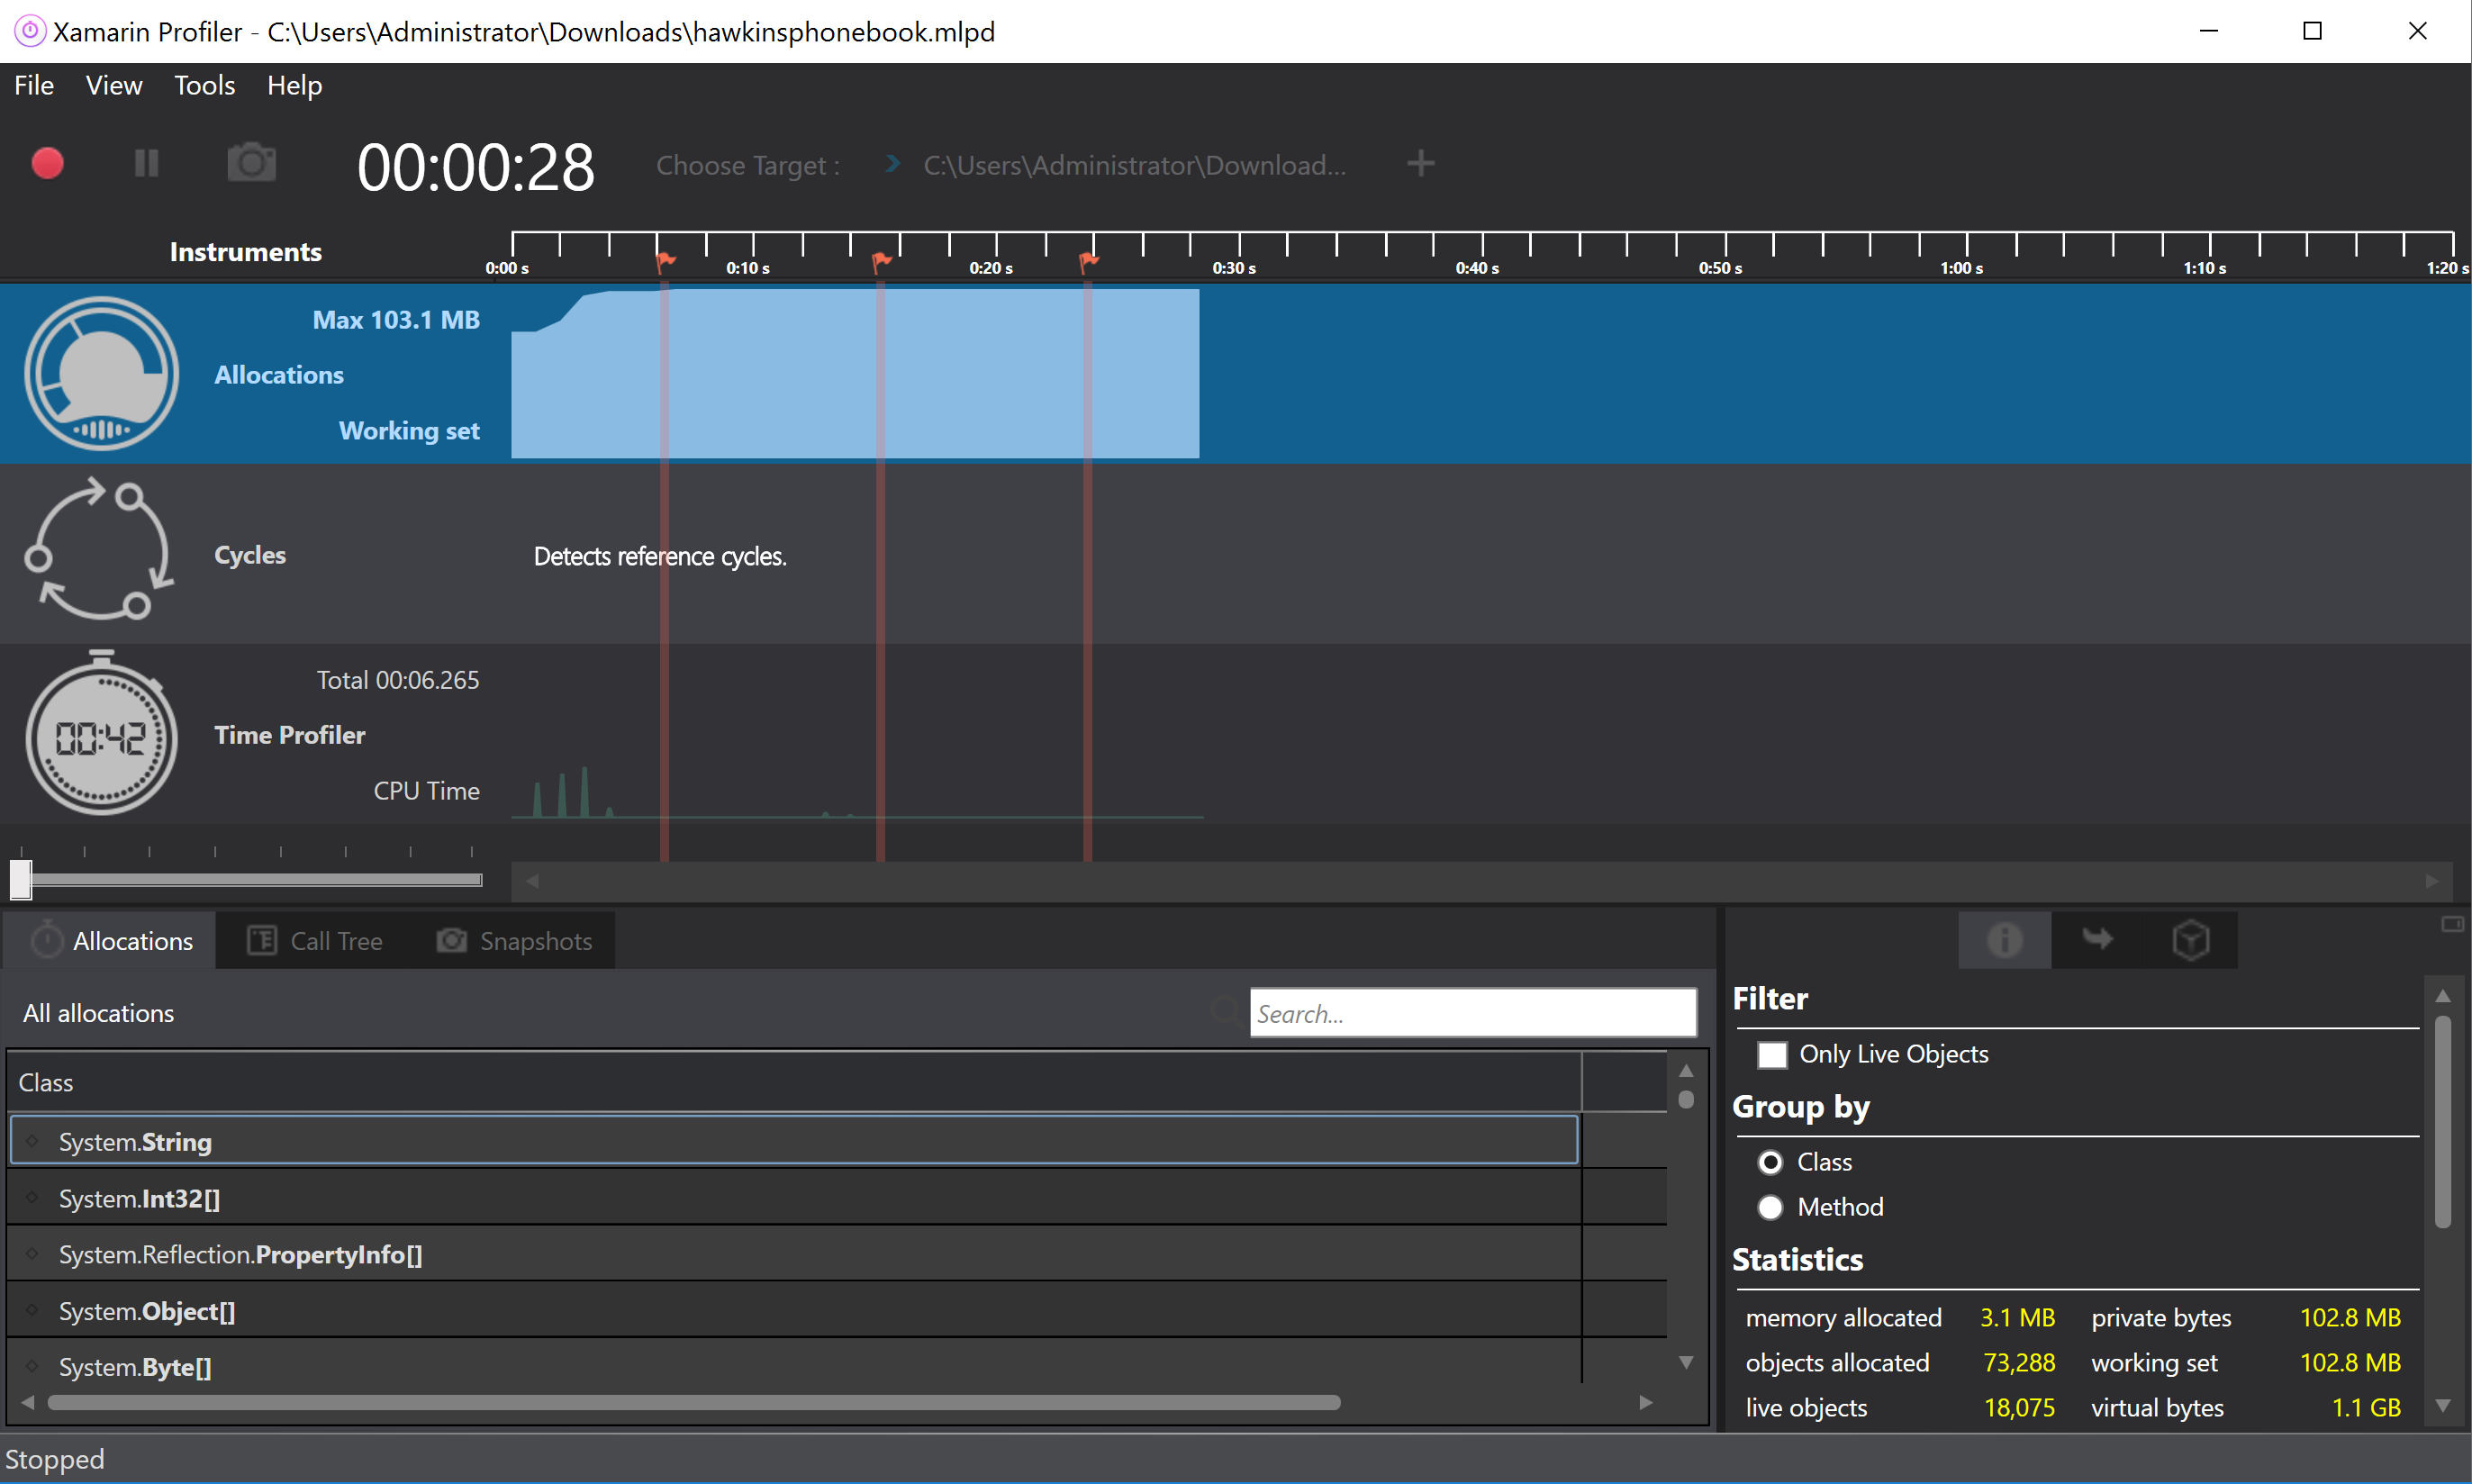
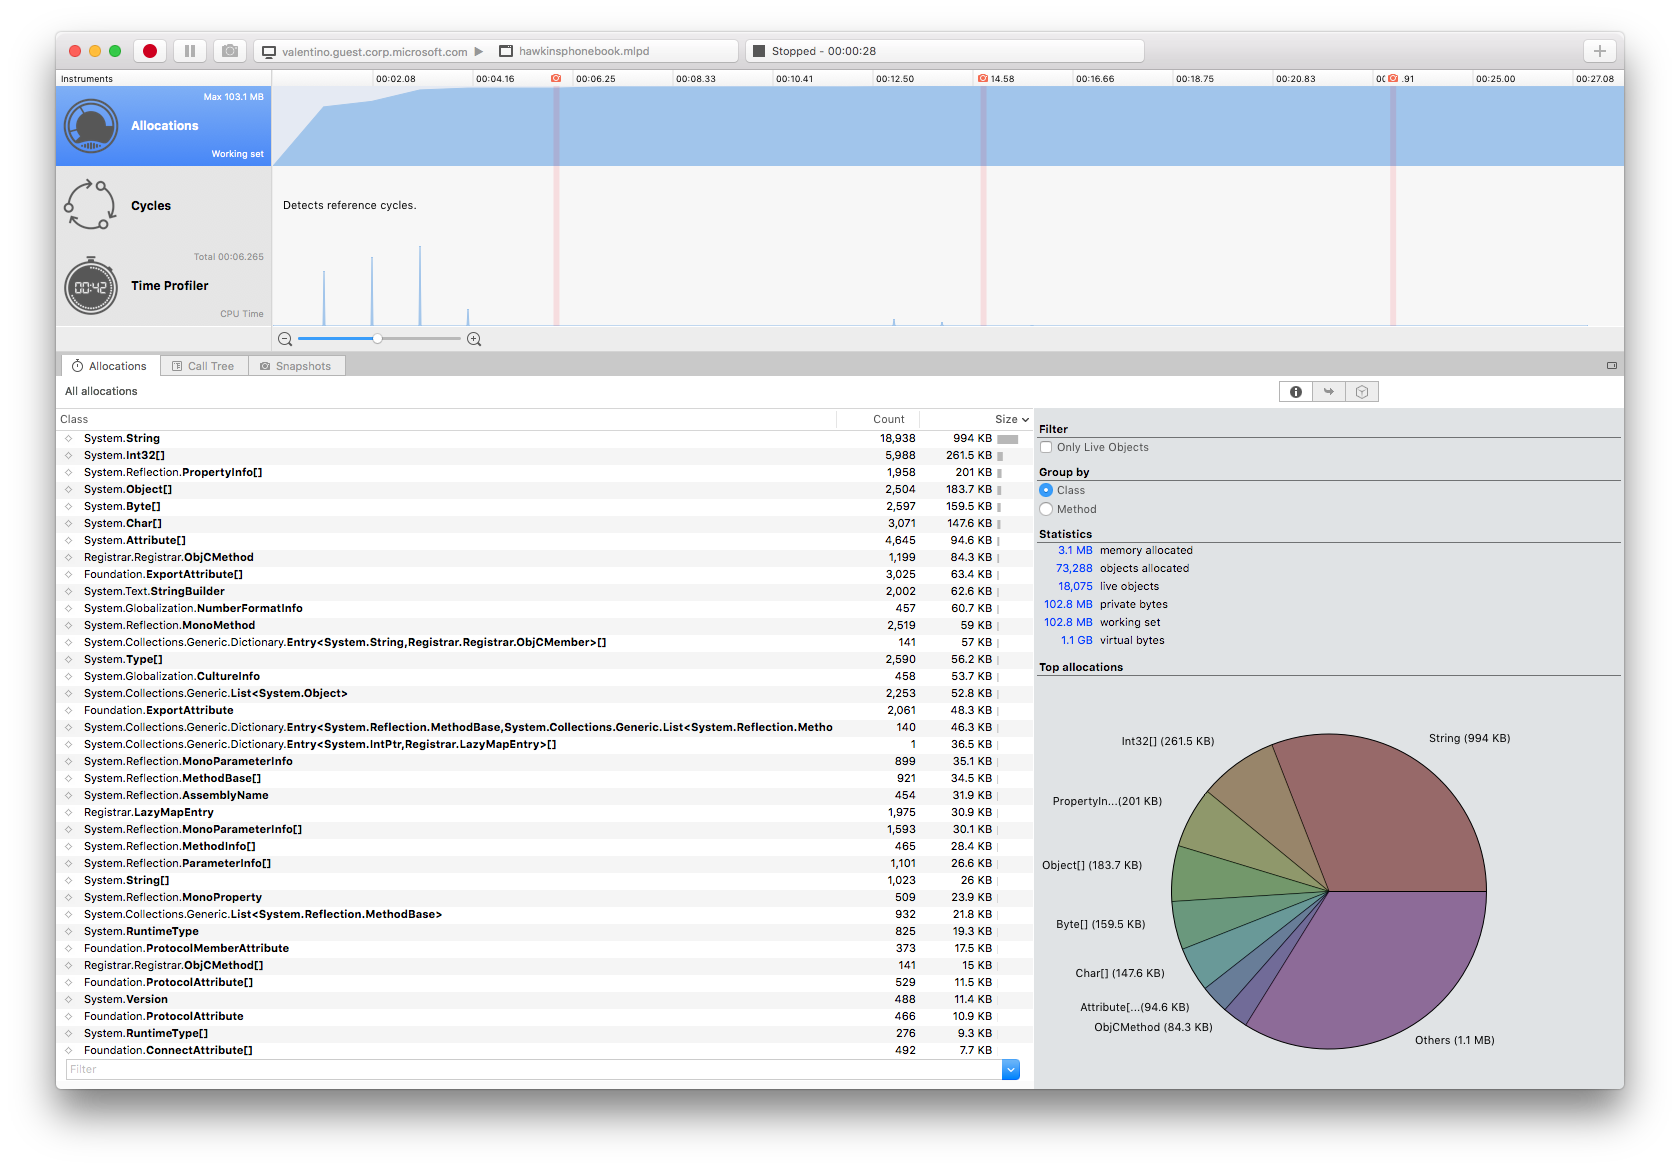
The Allocations instrument shows us how much memory our app is using and what it’s using it for. The allocations tab has a list of all of the objects created during the lifetime of the app, with the details panel on the right providing additional filters, statistics, and a chart on the overall breakdown of memory usage:
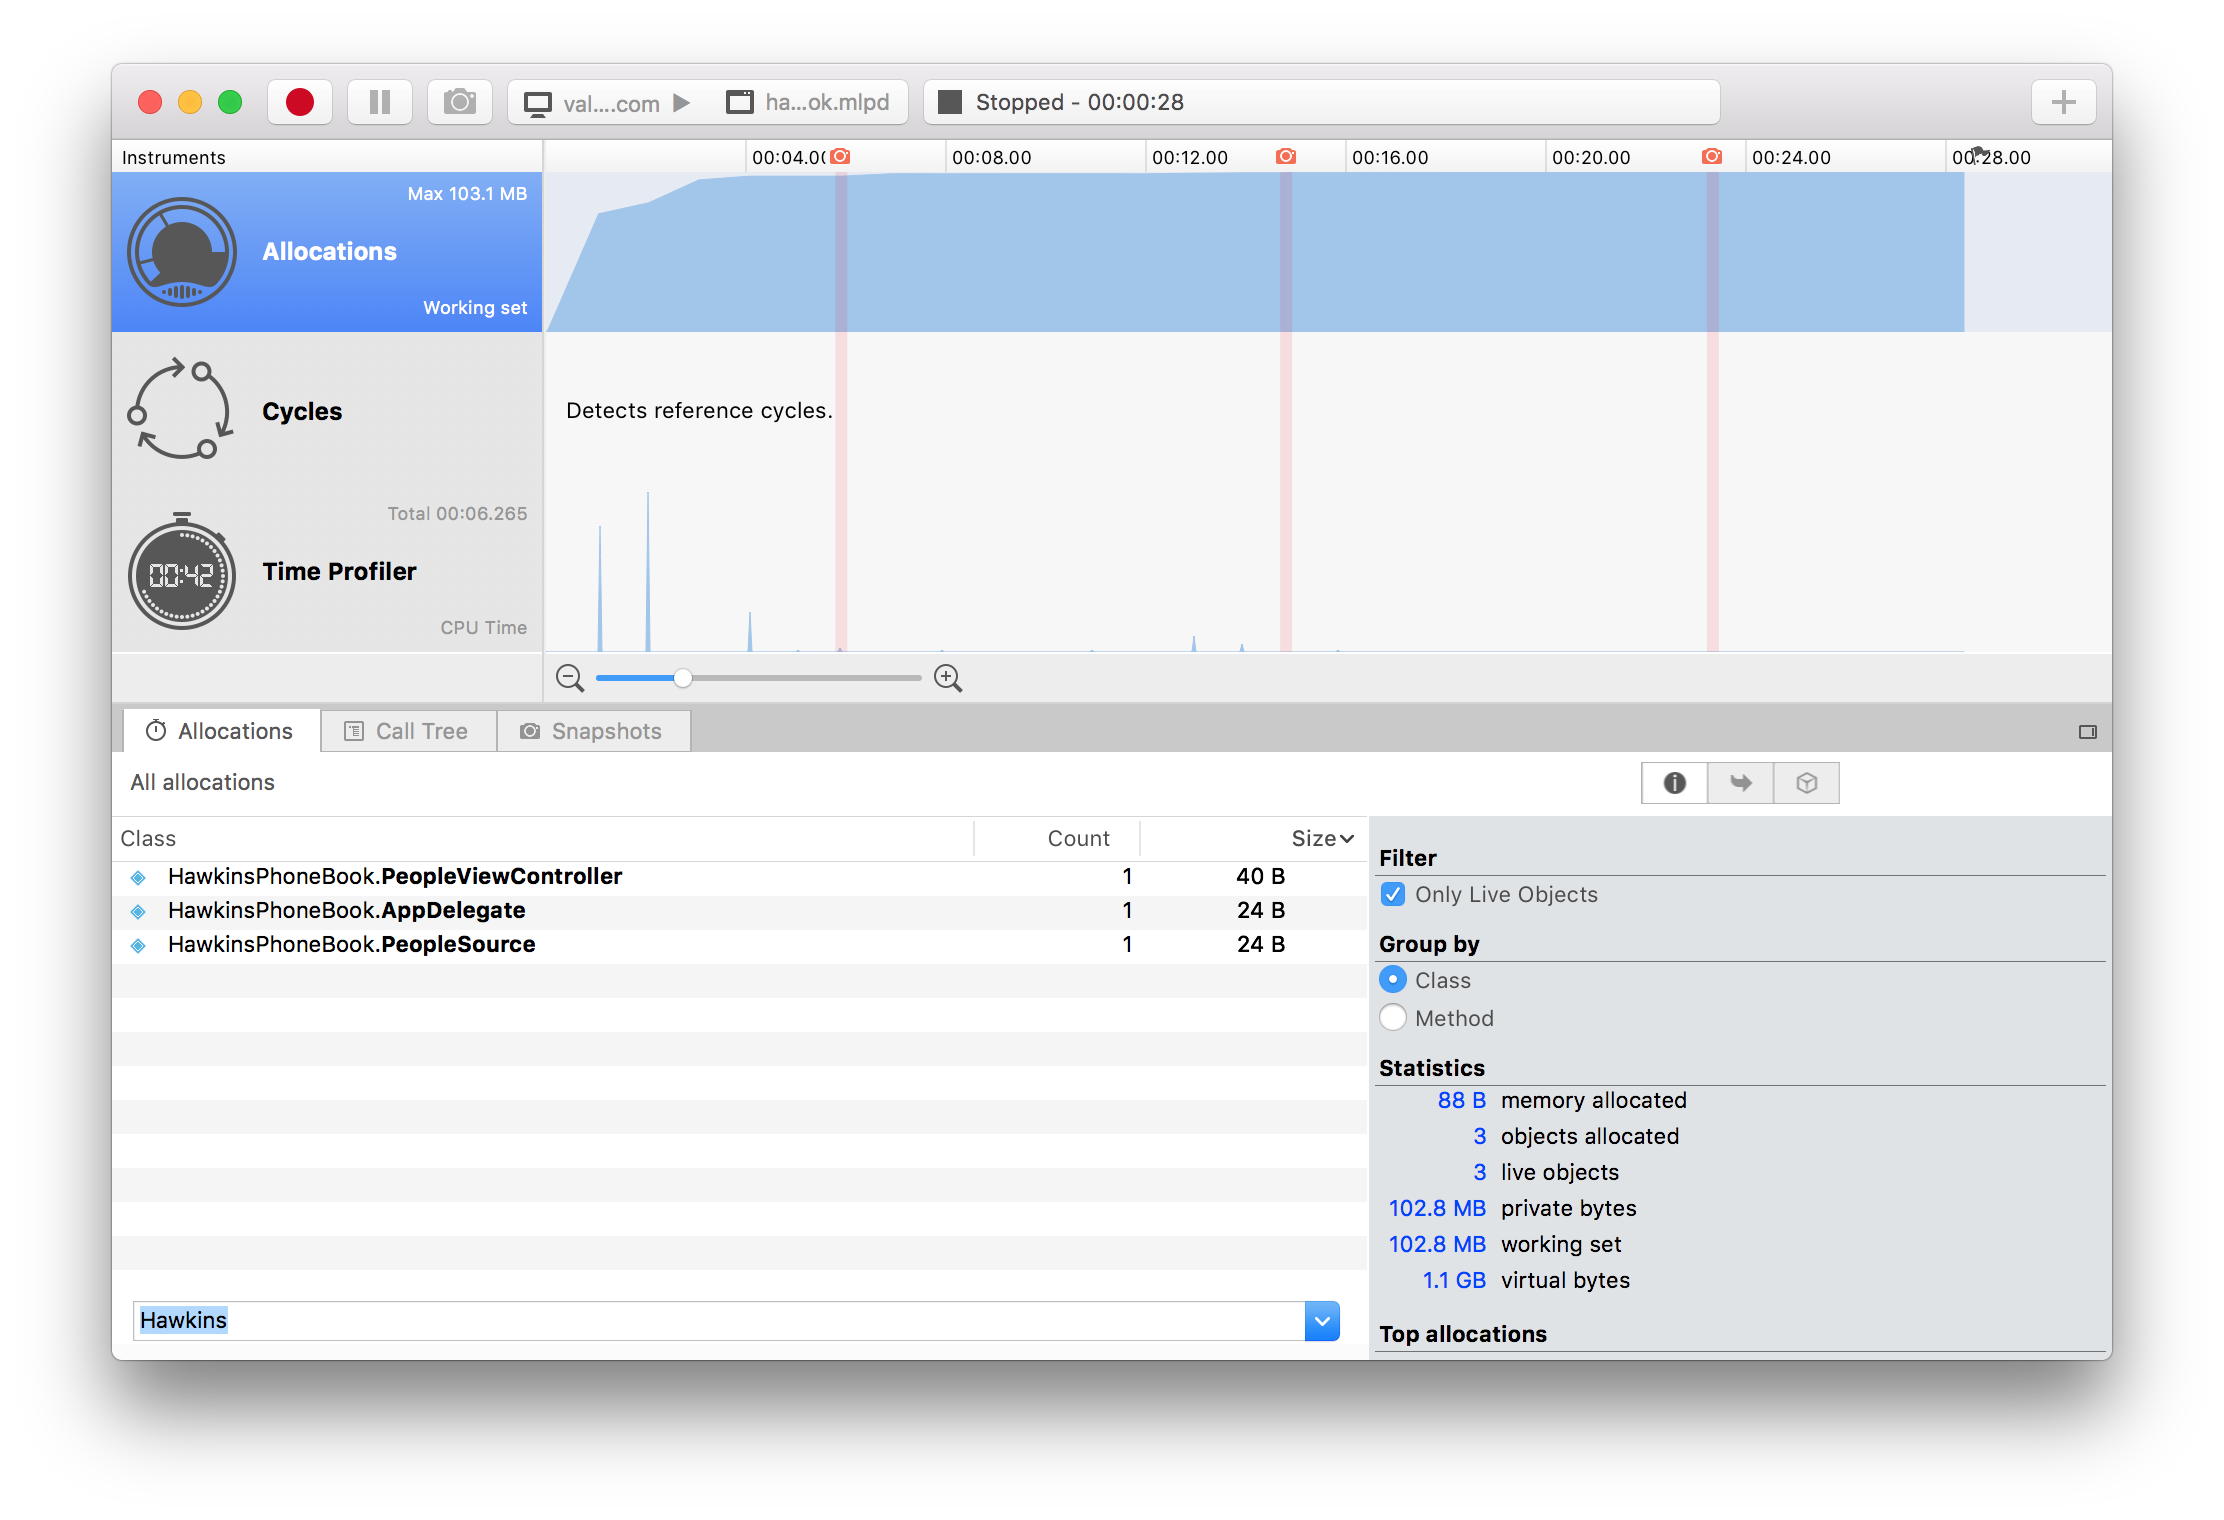
We can further filter the list of Allocations to find objects useful to us. For example, we can search for objects from our code by searching for our namespace. The Xamarin Profiler marks our objects in blue:
Another way to filter Allocation data is to limit the information to a particular segment with the selection tool. The selection tool lets us highlight a section of data to focus on. This will limit the Allocations list to the objects allocated during the selected time interval:

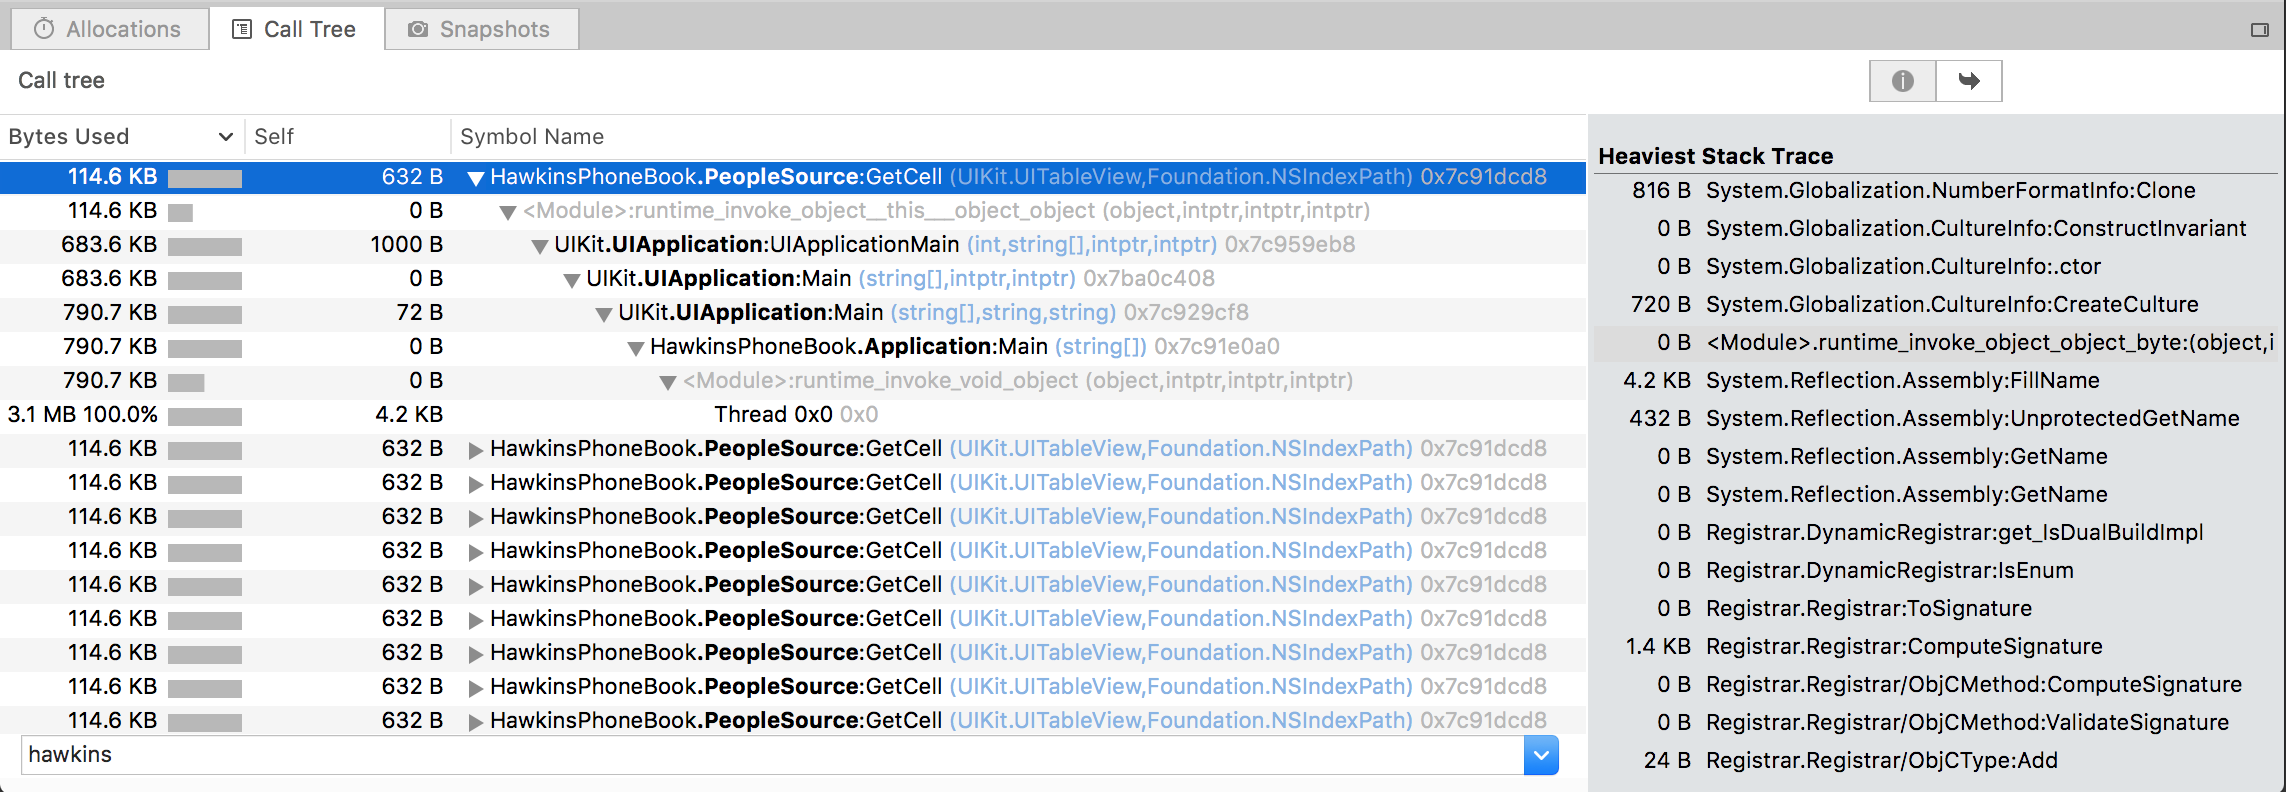
The Allocations instrument also features a call tree, which displays memory usage grouped by method call. We have the option to view the call tree separated by thread as well as inverted, which shows memory usage at the most granular level first and works its way up the call stack:
Snapshots
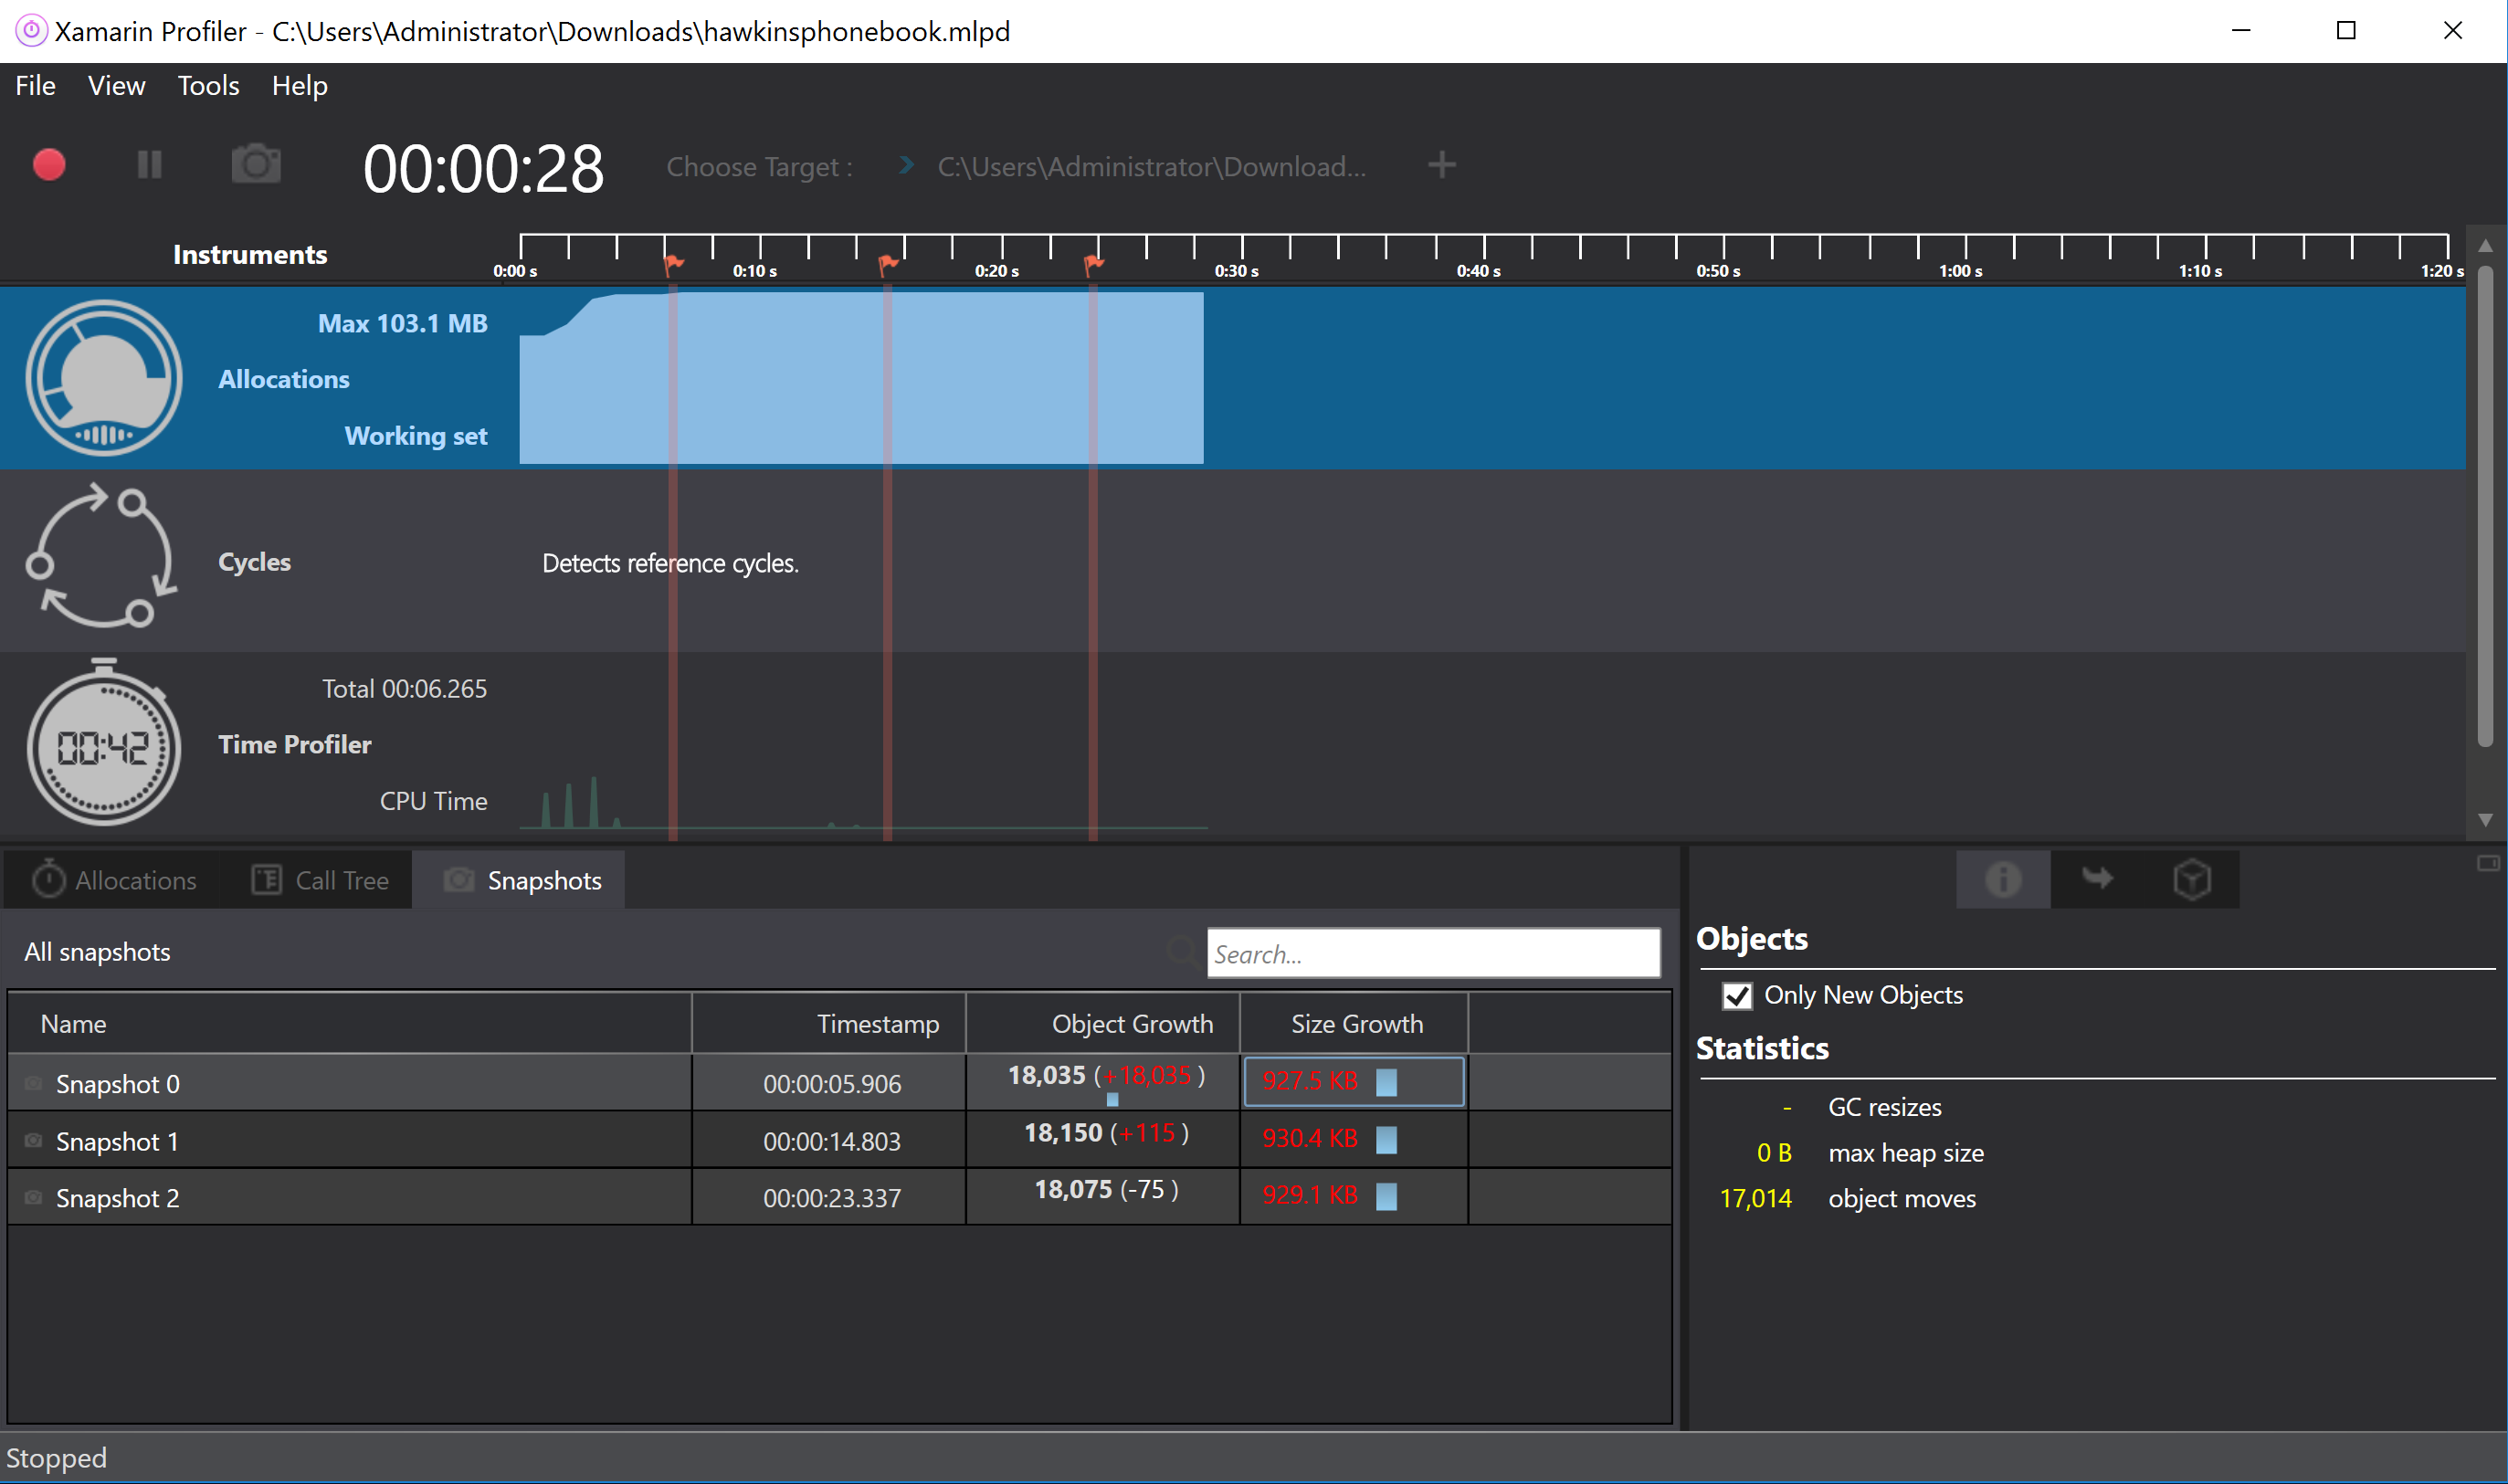
A nice feature of the Allocations instruments is snapshots, the ability to list all of the objects in our app at a point in time. We can take a snapshot at any point during the profiling session by clicking on the camera icon in the Profiler controls on the top left. The red lines in the console mark the snapshots in the profiling session:
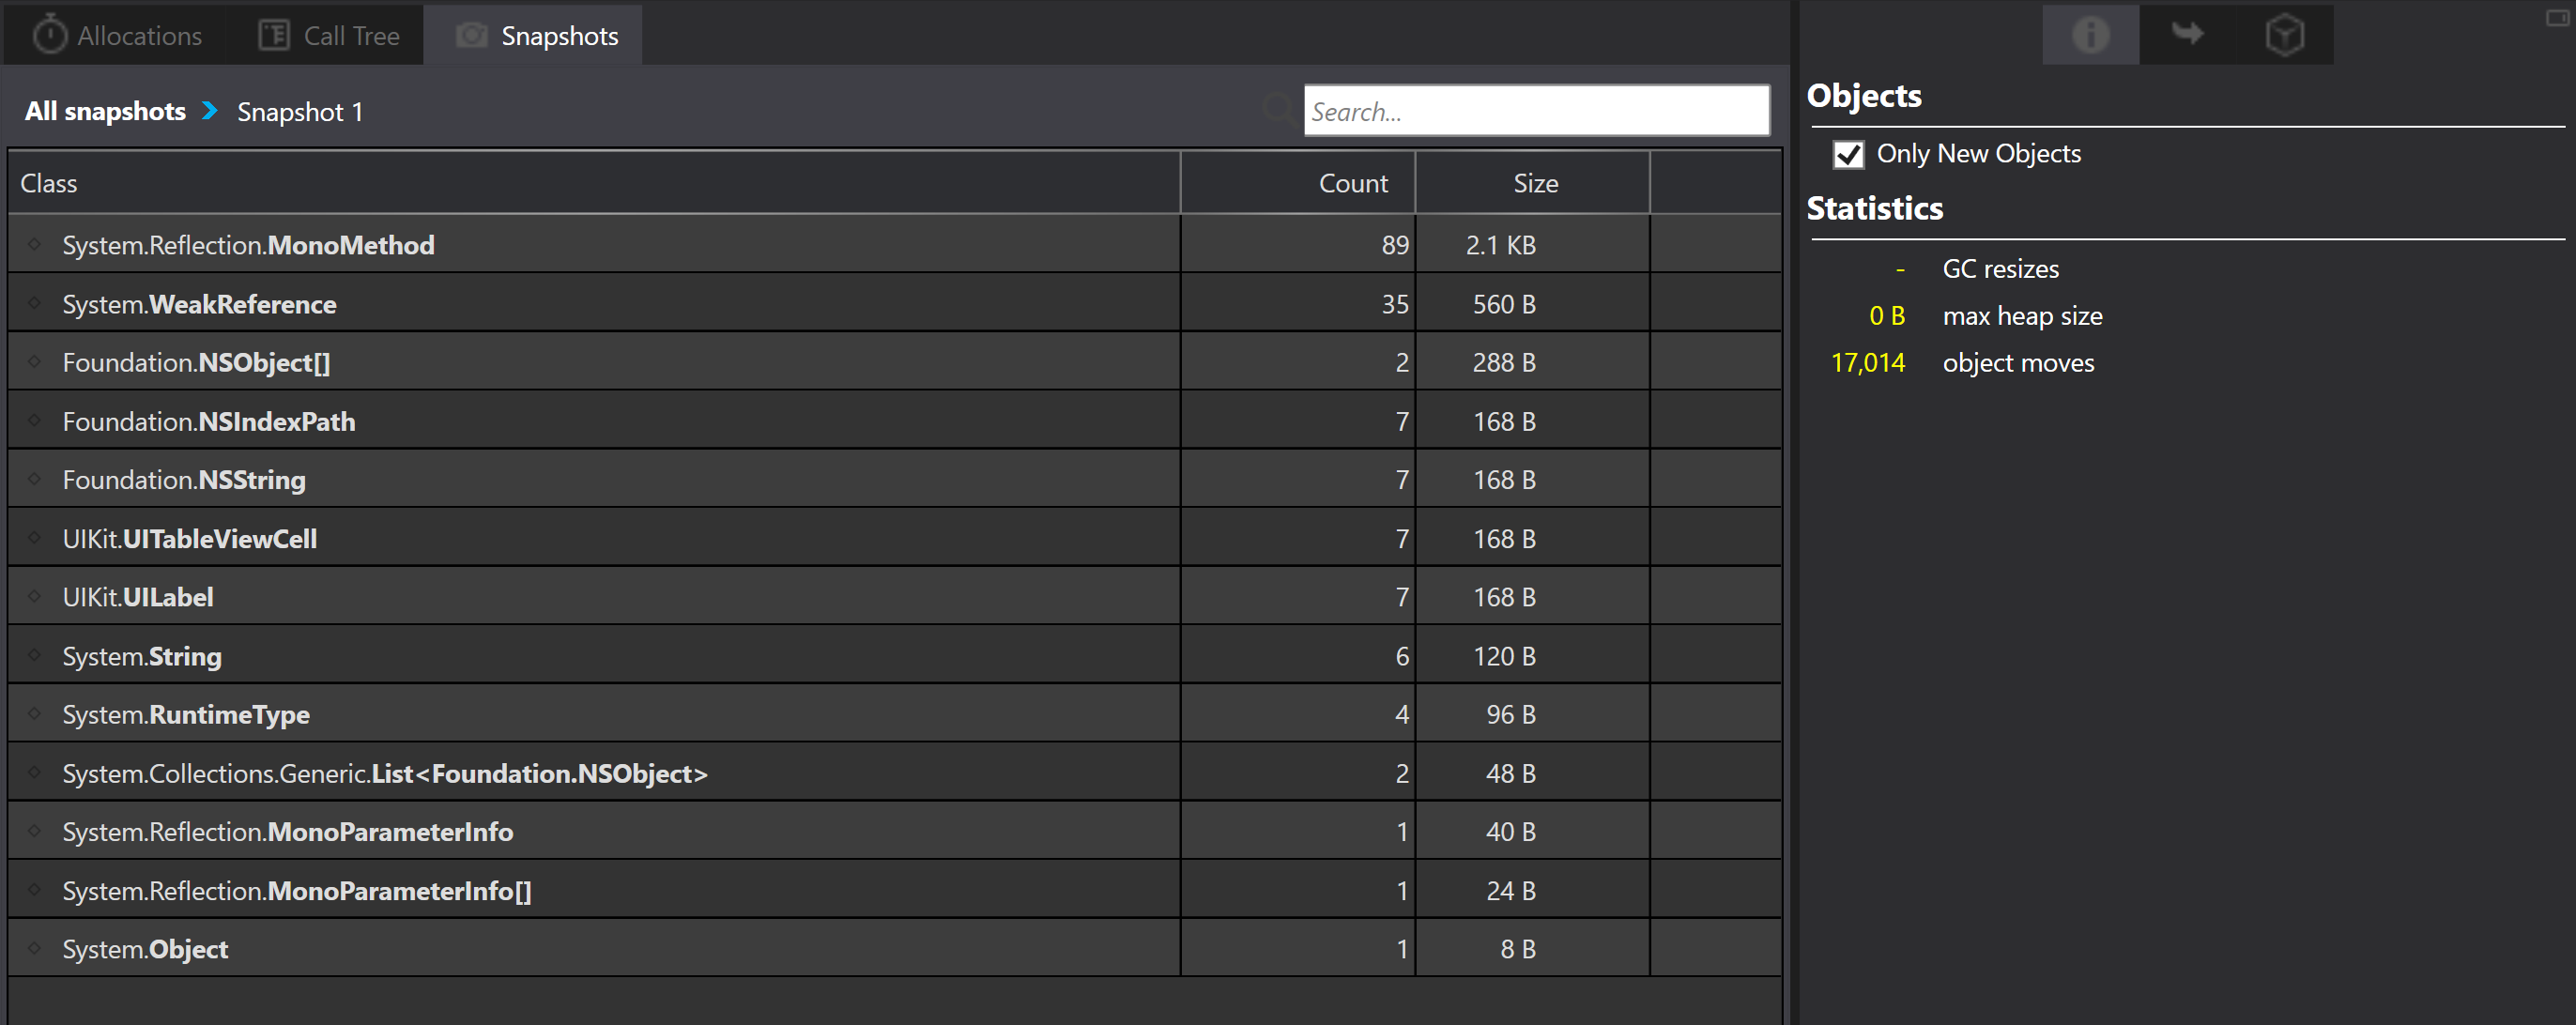
Double-clicking on a snapshot reveals the objects that are in memory at the time. Choosing Only New Objects in the display options limits the objects displayed to the delta between the previous snapshot and this one. This gives us a sense of what was created between two points in time:
Time Profiler
The Time Profiler uses sampling to determine where our app is spending the most time. Sampling is a lightweight performance profiling method that polls the application at regular intervals to determine what code is being executed and then forms a hypothesis for how long different parts of our program take to execute.
Inside the Xamarin Profiler, the call tree in the first tab is the same call tree as the Allocations tab, but instead of breaking down memory usage by method, it shows how much time was spent in each method.
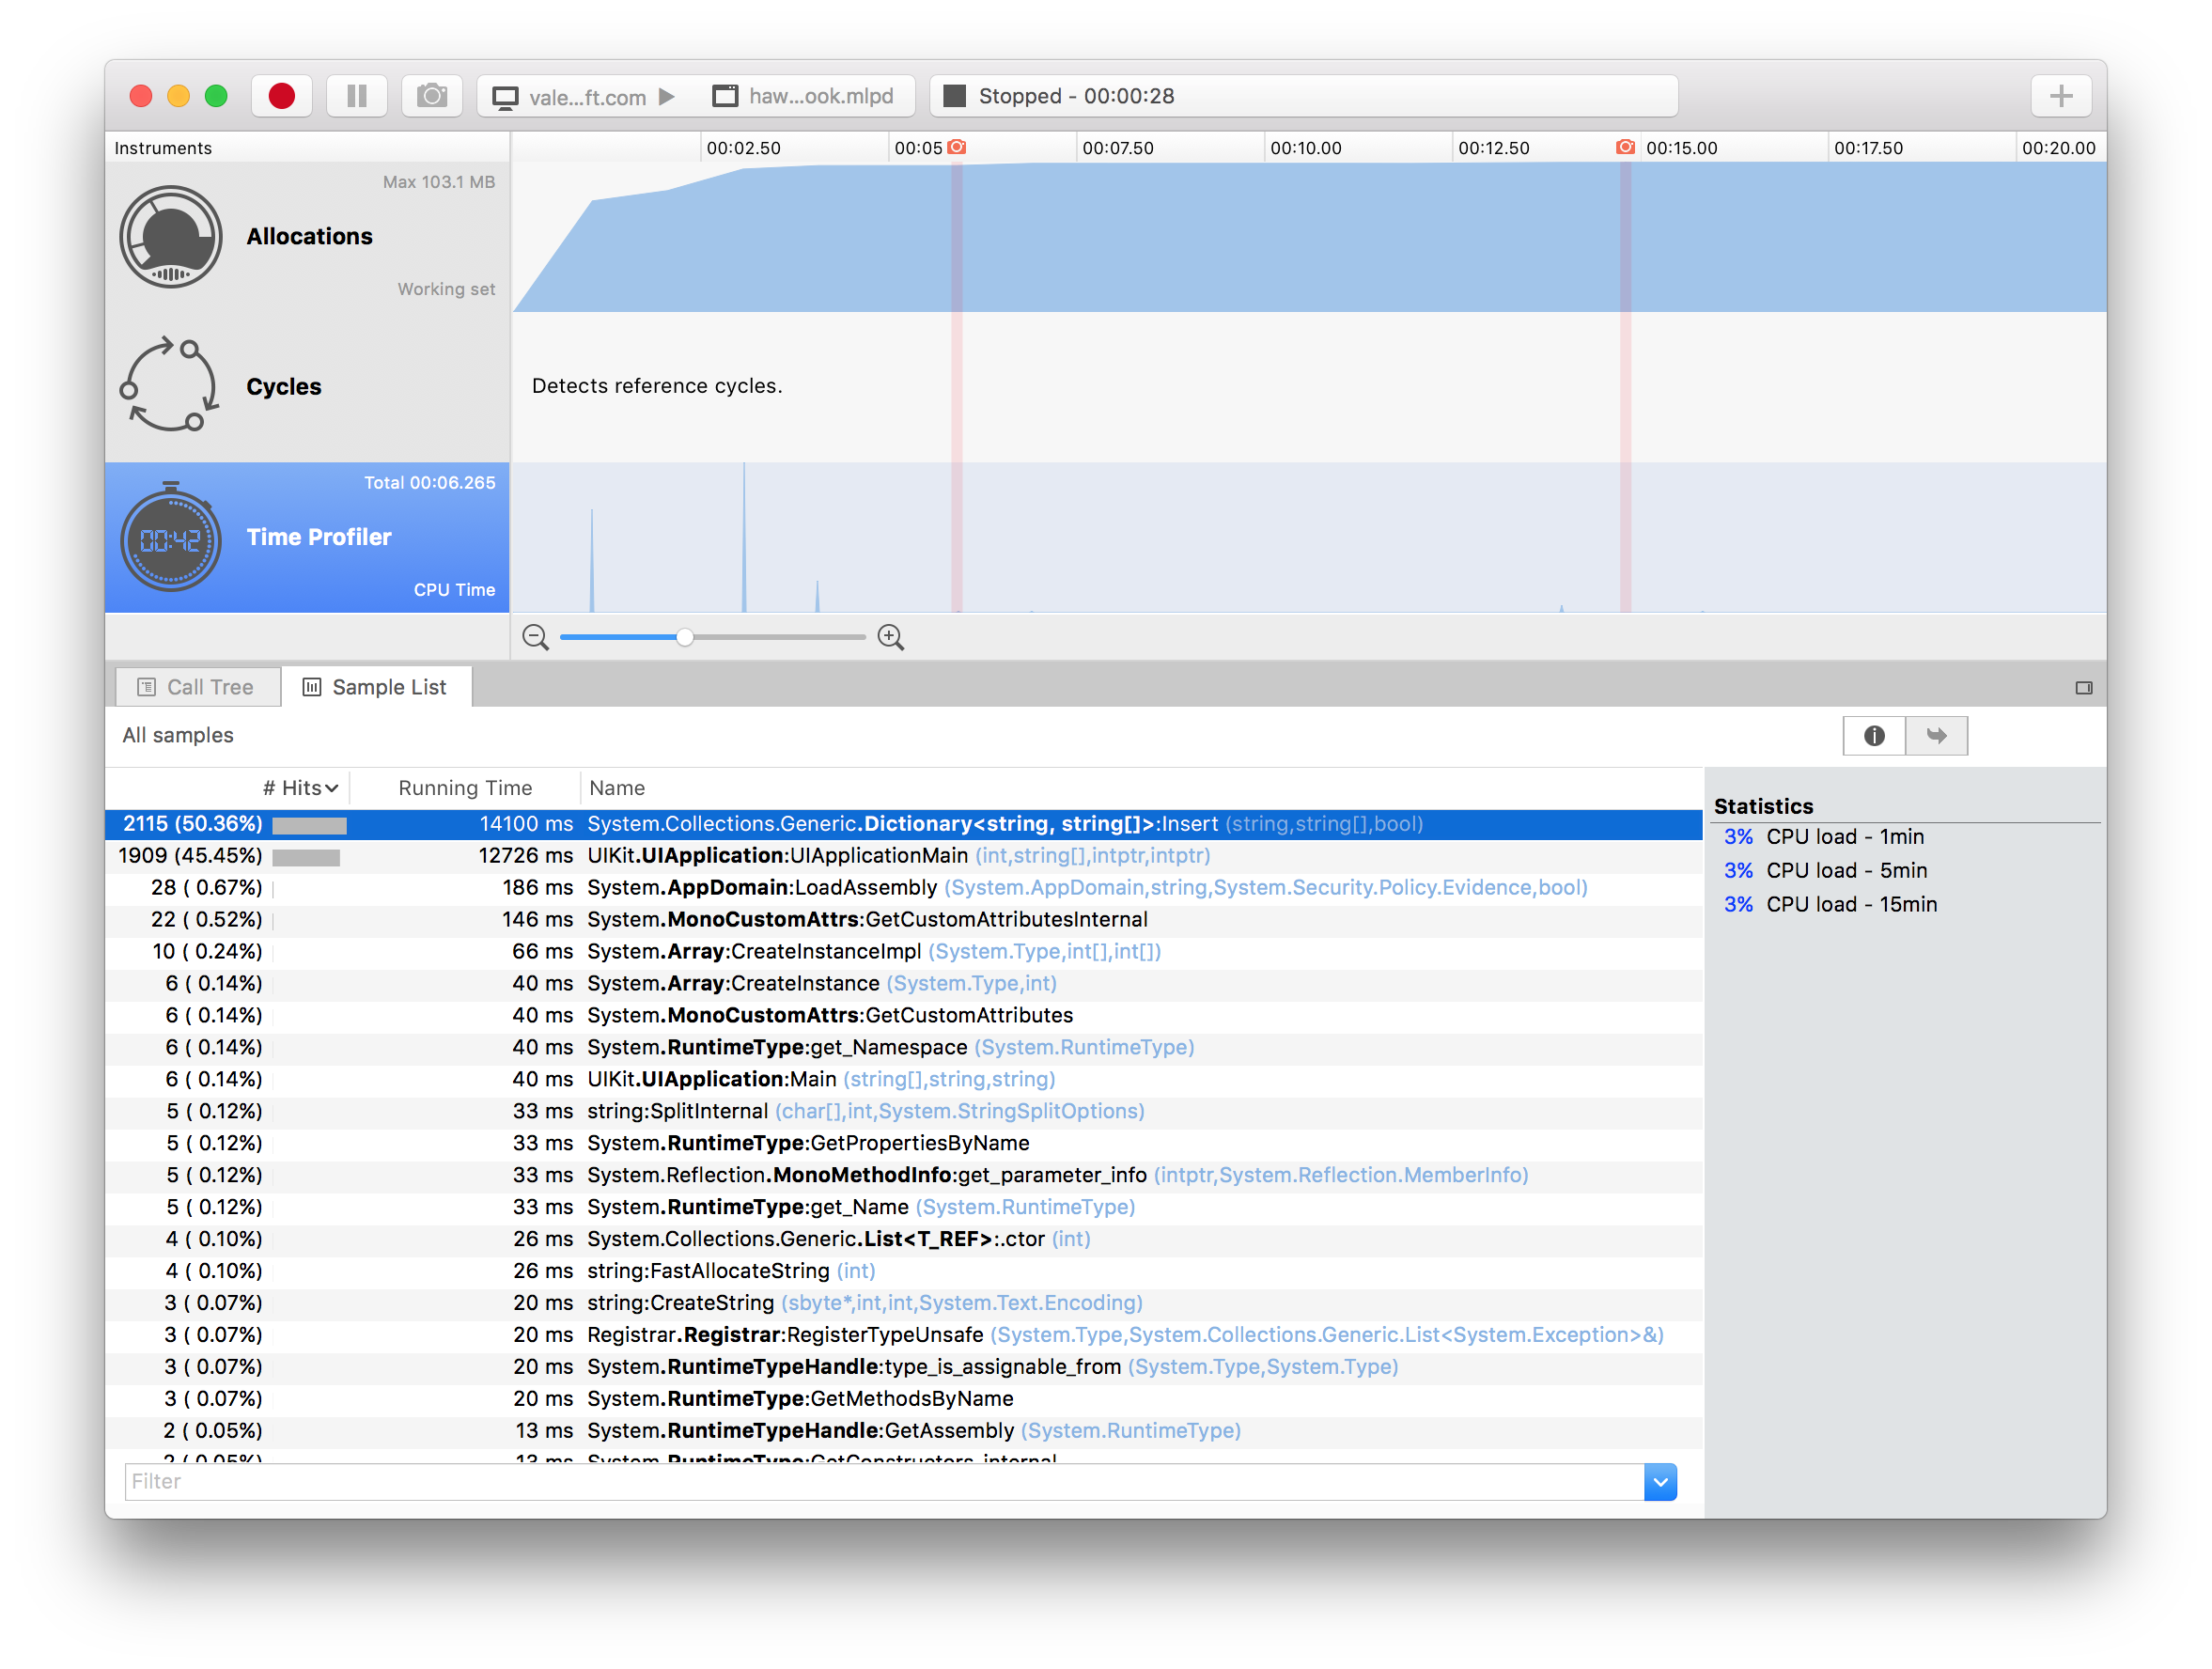
In the second tab, the sample list gives us a breakdown of the sampling results:
Cycles
The Cycles instrument gives a written and visual representation of circular references between objects, making it particularly useful for detecting native reference cycles, or circular references between objects that cross the boundary between the native and managed world. These types of cycles are important, because they prevent the objects involved from being picked up by the garbage collector.
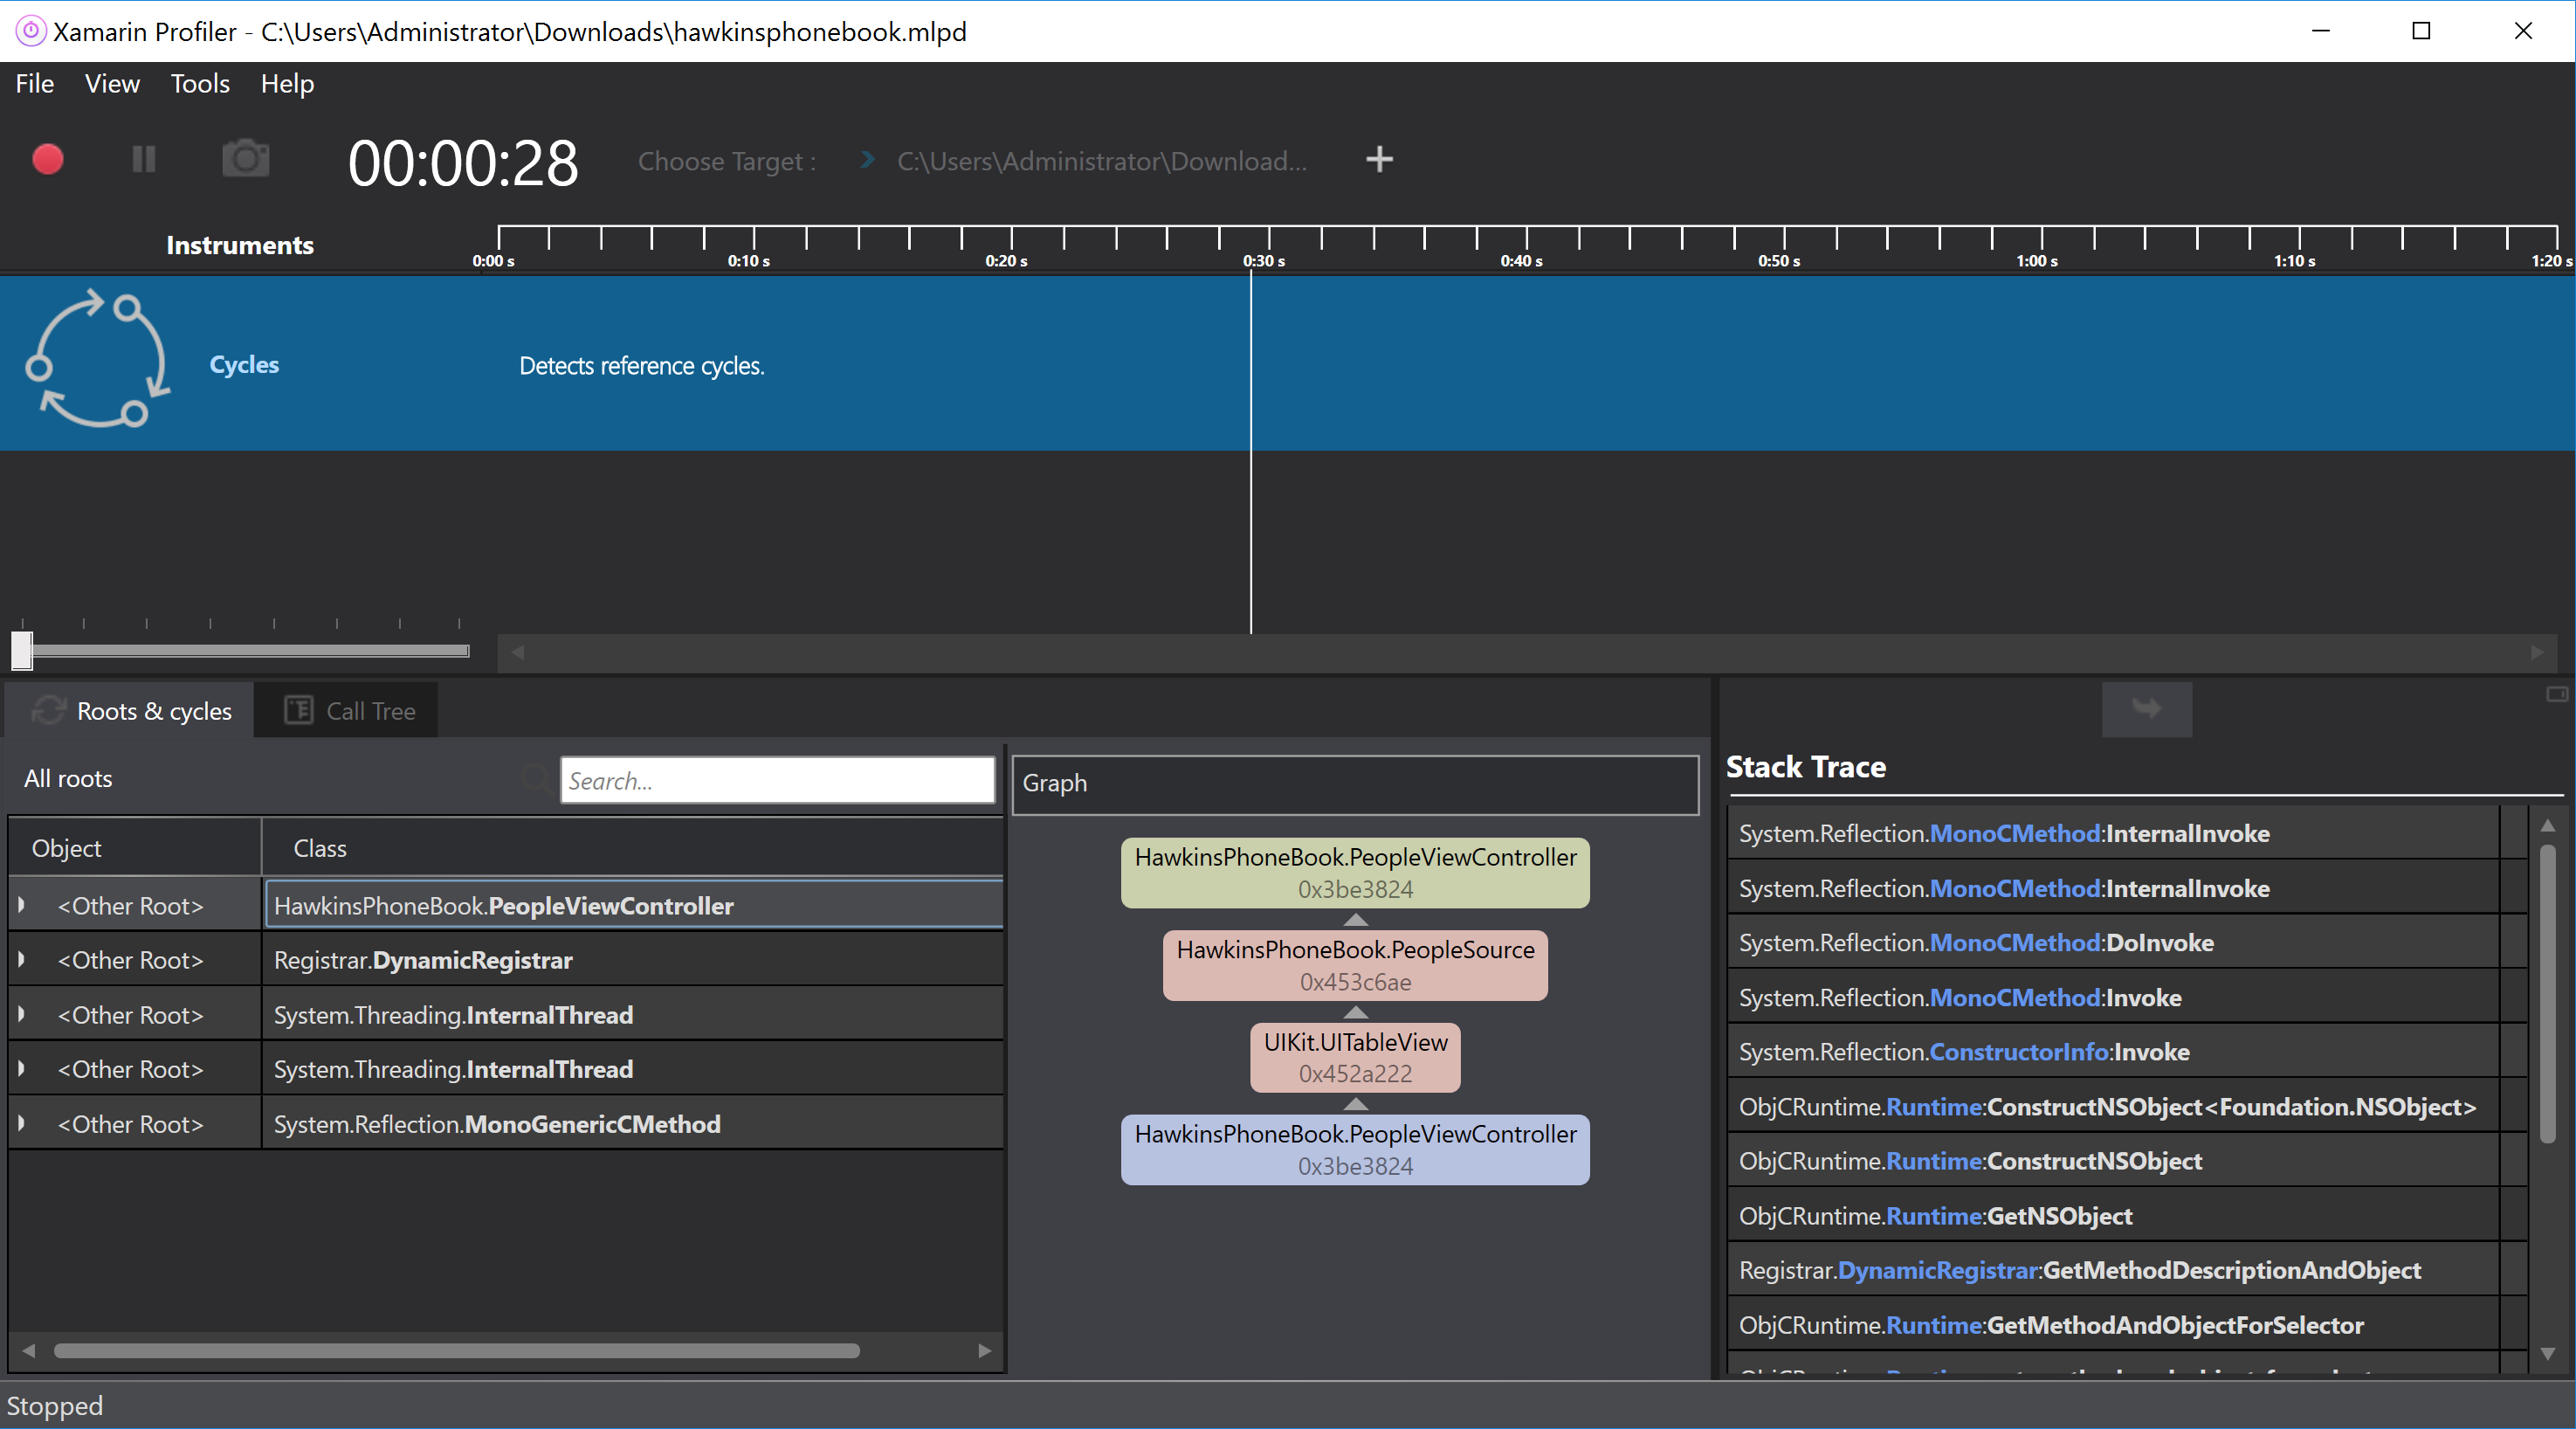
The Xamarin Profiler provides a list of cycles under the Roots & Cycles tab. We are primarily concerned with cycles involving objects in our own code. If a cycle is detected, Xamarin Profiler will list the root object in the list on the left and draw a graph on the right of all the objects involved in the cycle. The root of the cycle is pictured in purple, with the dependencies between objects represented by arrows:
For more information on Cycles, refer to our simple example app for native reference cycles, and James Clancey’s Guide to Cross-Platform Performance with Xamarin, which provides details on how cycles form and how to fix them.
Resources
- Introduction to the Xamarin Profiler: documentation from our developer portal.
- iOS architecture: under the hood guide for how Xamarin.iOS works.
- Android architecture: under the hood guide to how Xamarin.Android works.
- Xcode Instruments user guide: introduction to native iOS profiling with Instruments.
- Android Monitor overview: introduction to native Android profiling with Android Monitor.
- Xamarin.iOS, the garbage collector, and me: blog post with excellent explanation of iOS native reference cycles.
- Xamarin Bug Tracker: a direct link to report issues with the Profiler.
 Light
Light Dark
Dark
0 comments