Step-back while debugging with IntelliTrace
Have you ever stepped while debugging, realized that you’ve taken one step too far, and wished you could step back? Or, while stepping, saw a variable change in an unexpected way, and wish you could go back a step and see what its value was before? Now you can, all without having to restart debugging to recreate the state again!
In Visual Studio Enterprise 2017 version 15.5 Preview, we are introducing IntelliTrace’s new “step-back” feature. IntelliTrace now automatically takes a snapshot of your application on each breakpoint and debugger step you take. This enables you to go back to previous breakpoints or steps and view the state of the application as it was in the past.
Let’s see it in action.
Debugging with step-back
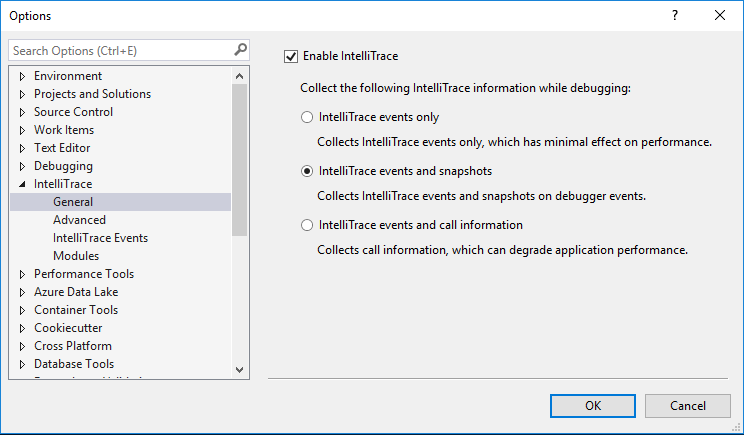
First, to enable the feature, go to Tools, Options, IntelliTrace settings, and select the option “IntelliTrace events and snapshots.”
IntelliTrace step-back is designed to integrate into your everyday debugging experience.
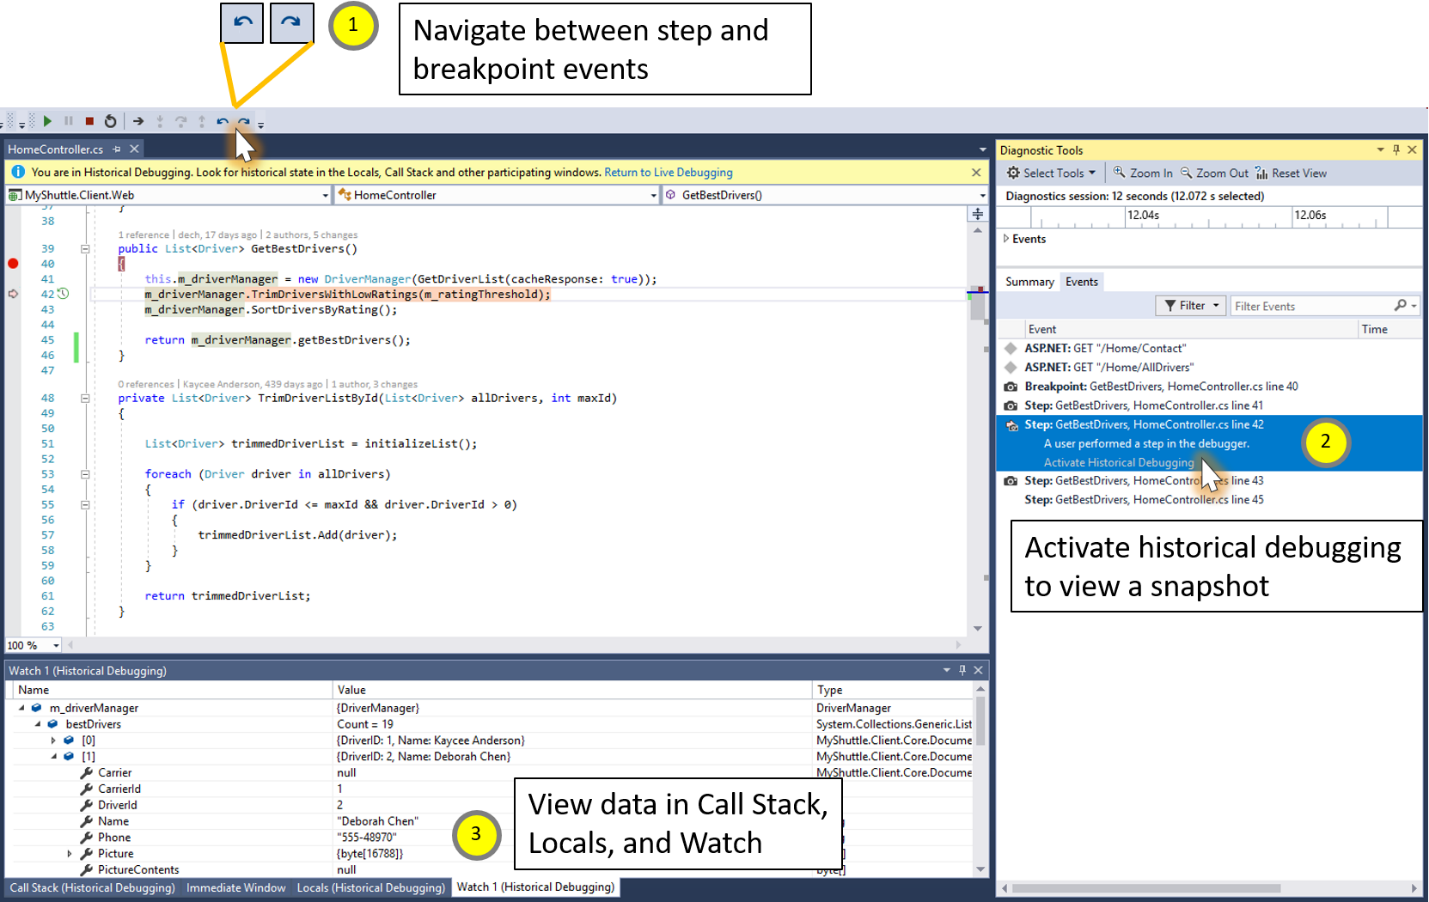
As you’re debugging, IntelliTrace records your steps and breakpoint events in the Events tab in the Diagnostic Tools window. When the step-back feature is enabled, it will also take a snapshot of your application on each debugger step and breakpoint that is hit. A camera icon will appear next to the events for which a snapshot is available.
Note: For performance reasons, snapshots are not taken when you step very quickly. If no camera icon appears next to the step, try varying your stepping speed.
Using the new Step Backward and Forward buttons
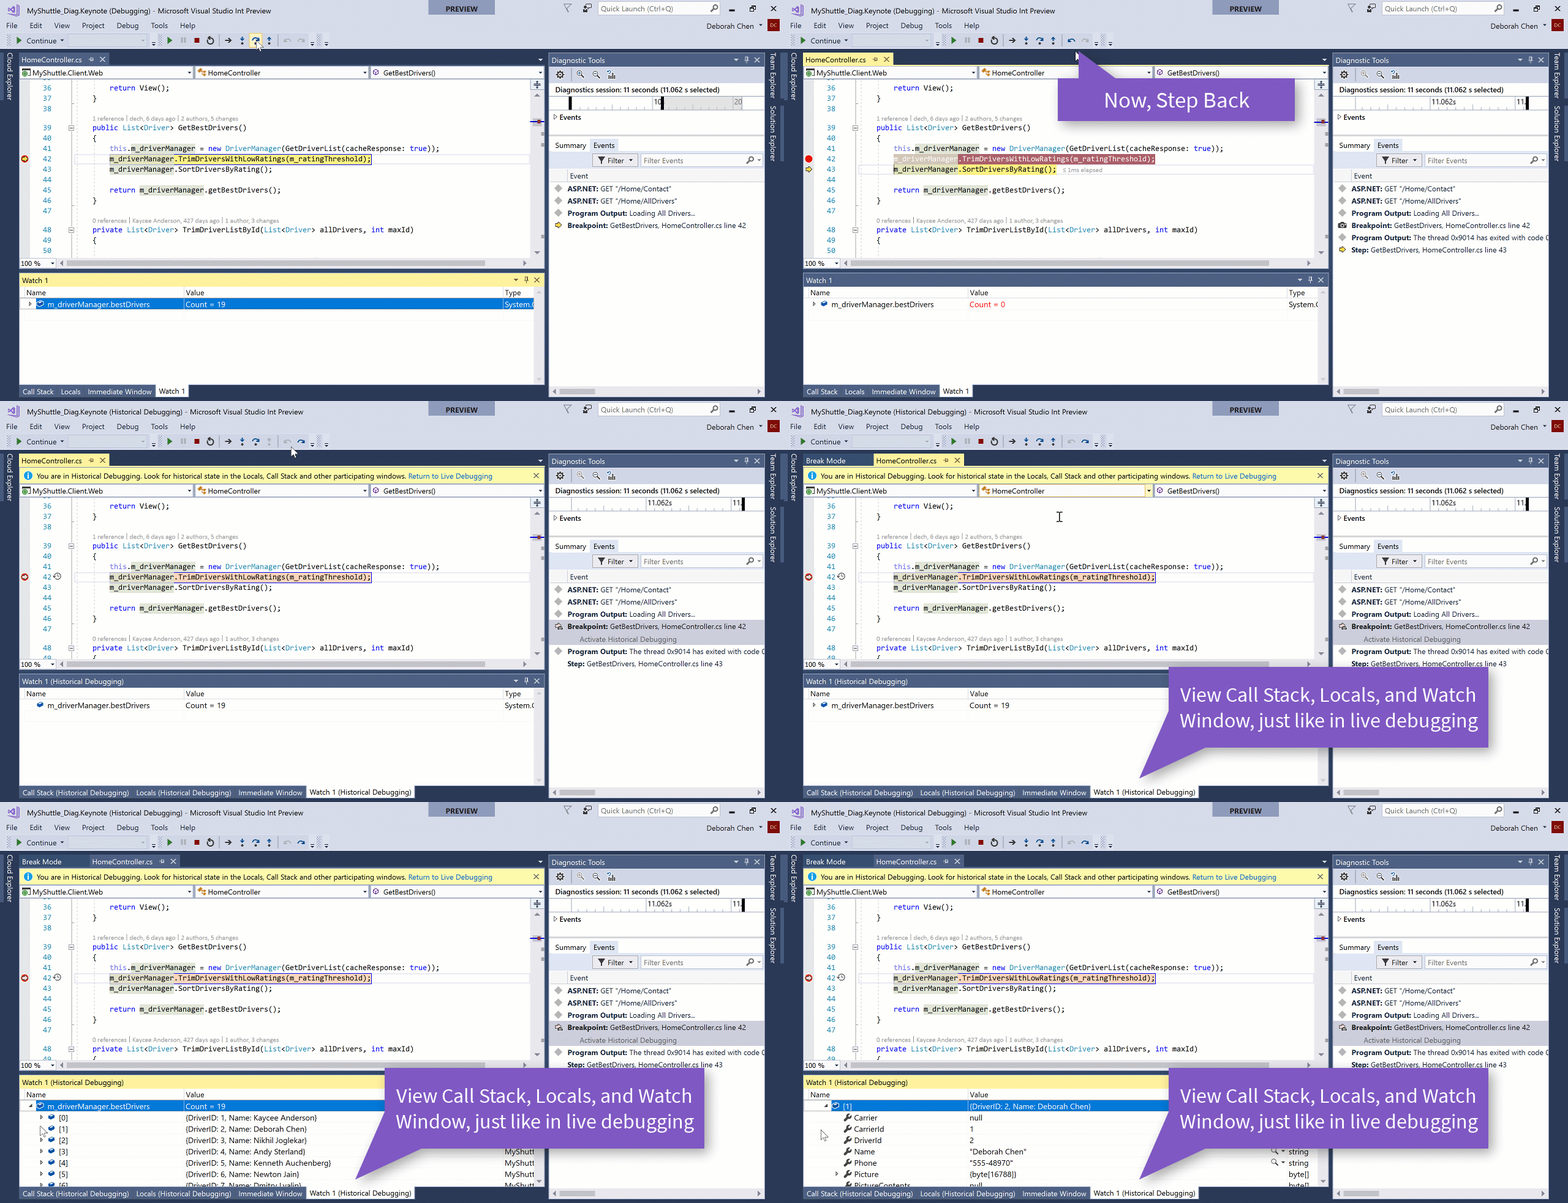
You can use step-back via the new Step Backward and Step Forward icons in the Debug toolbar. These icons navigate the events in the Events Tab. So, if you’ve just taken a step in live debugging (F10 or F11), you can use the Step Backward button to quickly navigate to the previous step. This will automatically put Visual Studio in Historical debugging mode, at the line of code you’ve stepped back to. Historical debugging is what we call the view of the application in the past.
In this mode, you’ll be able to see the values of your Call Stack, Locals, and Watches, just as you would in regular, live debugging. You can also evaluate expressions in the Watch Window and hover over variables to see data tips. All these values are populated using the data from the snapshot.
The data IntelliTrace previously recorded for debugger events only captured the variables you’d already expanded in the Locals window at that point in time. However, the data associated with a snapshot contains a view of the entire heap, including any complex objects.
Note: Unlike using Set Next Statement and re-running your code, viewing a snapshot doesn’t re-run your code; it gives you a static view of the state of the application at a point in time that has occurred in the past.
You can then use the Step Forward and Step Backward buttons to navigate between these events in the past. To return to live debugging, you can hit Continue (F5) or the Return to Live Debugging link in the gold bar.
Viewing snapshots via the Diagnostic Tools window
Snapshots can also be viewed from the Events tab in the Diagnostic Tools window. To view a snapshot, first select the event you’re interested in. Then, either click directly on the camera icon, or click the “Activating historical debugging” link on the event. Once you’ve done either of these actions, Visual Studio will be put in Historical Debugging mode at the line of code related to the event you’ve selected.
From here, you’ll be able to see the values of your Call Stack, Locals, and Watches, just as you would in regular, live debugging. You can also evaluate expressions in the Watch Window and hover over variables to see data tips.
With the new IntelliTrace step-back feature, you’ll be able to quickly step-back to previous debugger steps and breakpoints and view the state of your application in the past – all without having to restart debugging to reproduce the application state.
Try it out
The IntelliTrace step-back feature is available in Visual Studio Enterprise 2017 version 15.5 Preview, and requires Windows 10 Anniversary Update or above. The feature is currently supported for WinForms, WPF, Managed Console apps, and Managed Class Libraries. Support for debugging ASP.NET applications with IIS Express will be available in an upcoming release of Visual Studio.
We’d love to hear your feedback. To report issues, use the Report a Problem tool in Visual Studio. You’ll be able to track your issues in the Visual Studio Developer Community where you can ask questions and find answers. You can also make a product suggestion through UserVoice, or email the team directly at stepback@microsoft.com.
 |
Deborah Chen, Program Manager, Visual Studio Diagnostics
@ChenDeborah
Deborah is a program manager on the Visual Studio Diagnostics team, working on IntelliTrace. |


 Light
Light Dark
Dark
0 comments