
How Do I Debug Async Code in Visual Studio?
In a recent post, we explored the basics of asynchronous code, why it’s important, and how to write it in C#. However, while it can improve your program’s overall throughput, async code is still not exempt from bugs! Writing async code makes debugging more difficult when potential deadlocks, vague error messages, and finding which task(s) are causing a bug are thrown into the mix. Luckily, Visual Studio has several new and old features compatible with managed, native, and JavaScript to help ease your frustrations with debugging async code. Let’s take a tour!
Where can I see all my program’s tasks?
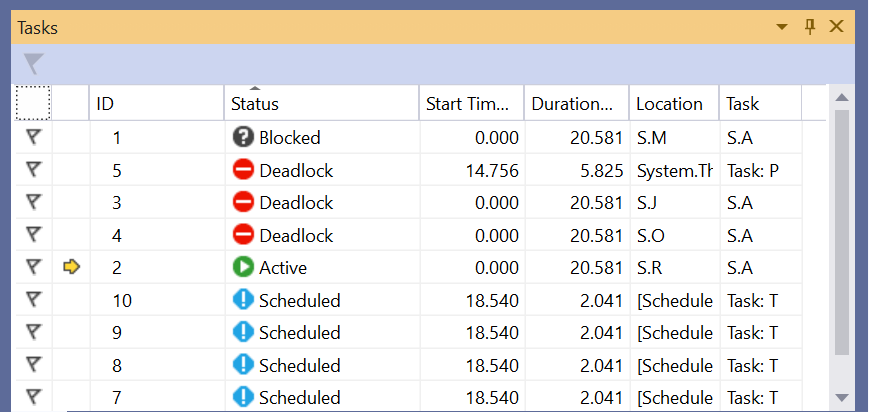
When you encounter a bug in your async code, you probably want to identify all your Tasks and determine which of them are causing the error. If you’ve debugged multithreaded applications, you may be familiar with the Threads window. Good news, there’s also equivalent window for tasks! The Tasks window allows you to view all your tasks, displaying their IDs, current locations, the method originally passed into each of them, and their current statuses (active, scheduled, blocked, or deadlocked) at break time. If your program is multithreaded, this window will also display the threads running each task. This can help to identify specific threads which may also be contributing to an issue.
You can access the Tasks window at Debug > Windows > Task or by using CTRL+SHIFT+D, K.
How can I locate the origin of a thrown exception in my async code?
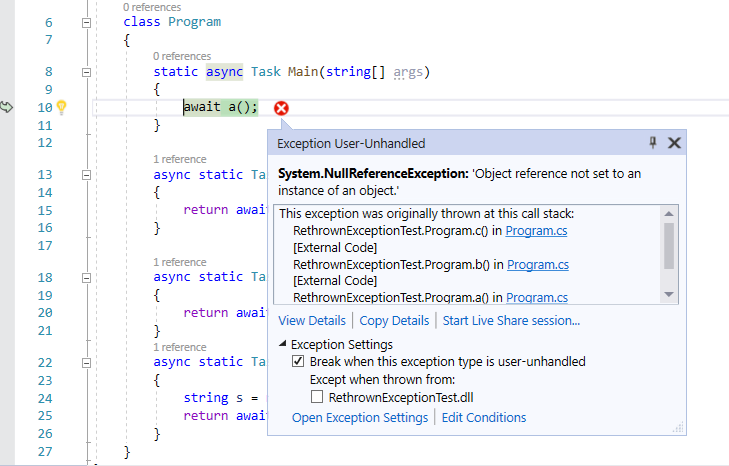
Determining a thrown exception’s original location is frustrating when debugging async code. When an exception is thrown multiple times, Visual Studio typically returns the call stack where the exception was most recently thrown via the Exception Helper. Unfortunately, this isn’t always helpful for async debugging. To fix this, we’ve implemented rethrown exceptions in 16.4. With this update, the Exception Helper displays the original call stack when an exception is rethrown. To learn more about this new feature, check out Andy Sterland’s blog post.
Is there a way to better visualize tasks and async code flow?
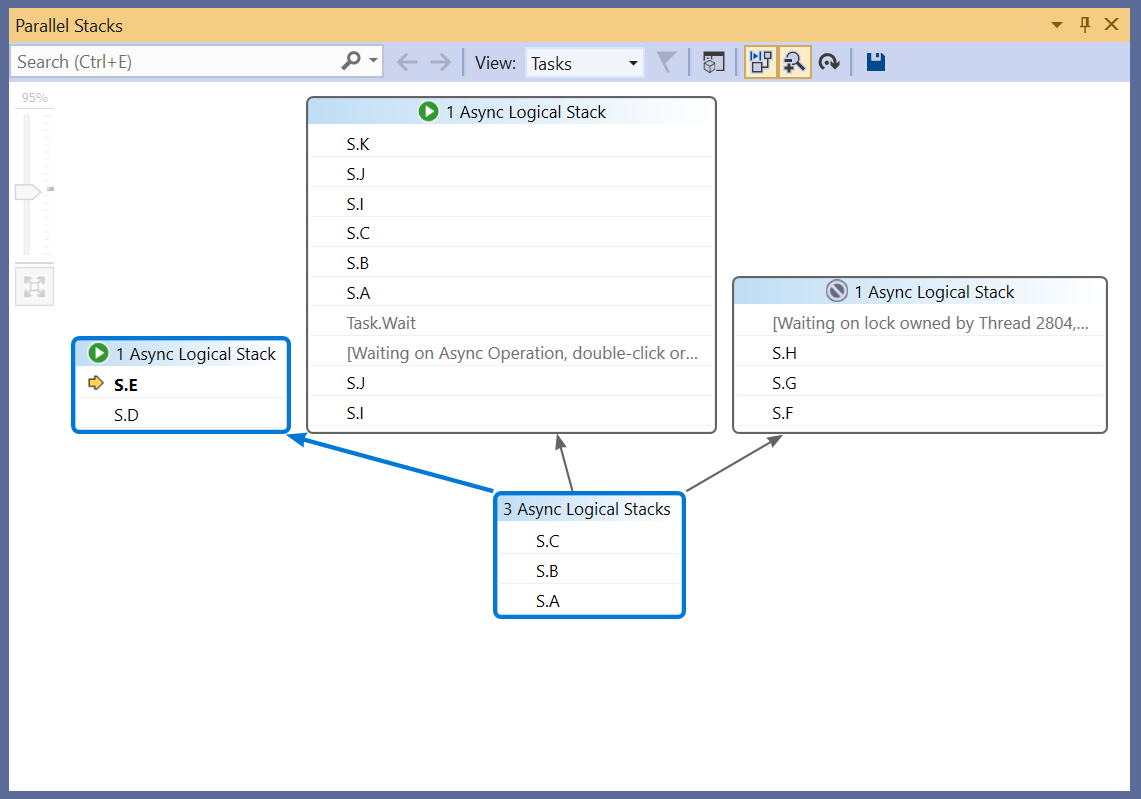
For a graphical depiction of async code’s execution, Visual Studio has the Parallel Stacks window for threads and tasks. Improved for Visual Studio 16.6, the Parallel Stacks window for tasks (or Parallel Tasks window) visually displays active, awaiting, and scheduled tasks and how they relate to each other. Double-clicking an active or awaiting task shows the async call stack in the Call Stack window. To understand which thread is running a specific task, you can swap between the Parallel Threads and Parallel Tasks windows. You can do this by right-clicking and selecting Go To Thread in the context menu. To learn more about the new updates made to Parallel Tasks in 16.6, stay tuned for an upcoming blog post…
Ready to use these tools to debug your async code?
Now that you have more tools in your belt to help you debug your code, share your feedback with us! Reaching out with your thoughts and feature suggestions will help us create the best async debugging experience.
You can also check out this new video on async debugging tools in Visual Studio for more demos.
 Light
Light Dark
Dark
5 comments
Image 2 and 3 produce 404 error, and hence won’t load.
Thanks for the heads up! The images should be fixed now.
This is useful but honestly the biggest issue isn’t with figuring out tasks or tracking down exceptions, it’s stepping into tasks. Yes, the fundamental thing that every dev has been doing for years simply doesn’t work well with async. It is to the point that the only real way to “step into” async code is to set a breakpoint inside the function itself.
It really parallels the problems we had when properties were first introduced. You want to step through code so you’re stepping along and suddenly you’re inside a property getter. In rare cases are you going to be debugging a getter so the debugger was updated to have an option that is, by default turned off, to step into properties. Now we can step through code without worrying about jumping into property getters. We need this same thing with async code.
Let’s list the problems of stepping with async code today. Imagine this line
“`csharp
var result = await client.GetSomeDataAsync(10, cancellationToken).ConfigureAwait(false);
“`
I’m not getting the result back I want so I want to step into `GetSomeDataAsync` but that won’t happen. Instead you step into `Task.cs` or perhaps one of its friends. You can keep stepping and you’ll eventually get to `Awaiter.cs` and `ExecutionContext.cs`. All this is correct but none of this is your code or where you want to be. If that task happens to throw an exception then stepping will work you back out of all that code. Nobody cares (in most cases) about all that task stuff. When I “step” I want to go into `GetSomeDataAsync`. The debugger needs to skip all the “infrastructure” stuff by default.
One could argue that this will work out of the box and you are correct but that isn’t realistic. By default the IDE may have “just my code” enabled but you cannot use SymbolLink to step into code from any library you rely on. So if this async method is provided by a package that has symbols then you will have turned off JMC. Don’t even get started on the .NET source code stepping. That seems to be either completely broken now or just documented wrong. Once the sources for the task stuff are downloaded (by any project) you will forever be stepping into them.
Please provide a step by step guide on how to step into async methods (without all the task stuff in between) when said code may not be in your project (e.g. symbollink). This is how third party libraries are being generated these days. Even newer versions of VS have preliminary support for disassembling code so it’ll have the same problems. At this point the only way to actually step through async code is to put the breakpoint in the method you’re calling and that doesn’t work if you don’t have that source code.
This is awesome, but I often get a stuck VS when trying to use the tasks window.
Could be due to the high number of tasks my apps are using (probably in the 100x-1000x), or due to using the latest VS Preview.
I can’t believe I never knew about the Tasks debug window. Thanks!