
Database Profiling with Visual Studio
Have you ever been tasked with diagnosing a slow performing web application and suspected the database was to blame? Looking into your database tier requires specific tools, now you can quickly and easily investigate using the database profiling tool in Visual Studio’s Performance Explorer!
When it comes to diagnosing the performance of web application, one thing we’ve heard in dozens of conversations with developers, is that the database tier of an application is usually a prime suspect for what is causing sluggishness within an application. However, a quick internet search reveals just how challenging it can be to investigate those issues, most solutions require installing a separate tool, gathering huge SQL traces, or changing your application’s code to get the information you need.
In order to make this process less cumbersome and complicated, we’ve developed the Database tool found within the Performance Profiler in Visual Studio to help you gain deep insight into the database tier of your application. You can see exactly what helpful information about what database activities happen during the execution of your application, such as which queries and transactions are the longest running, which connection string each query is using and perhaps most importantly, where in your code those queries are being made.
Follow the simple example below to see how you can use this tool to pinpoint places in your code that interact with your database and could potentially be improved for meaningful performance gains for your users.
Using the tool
Imagine for example you have an online store such as the excellent ASP.NET Core example eShopOnWeb, this is a great sample application that exercises a lot of the features of .NET Core and uses a SQL database with Entity Framework. After following the directions on the GitHub project page to build and launch the site, take a few moments to click around, filter the catalog and fill your shopping cart with a few items.
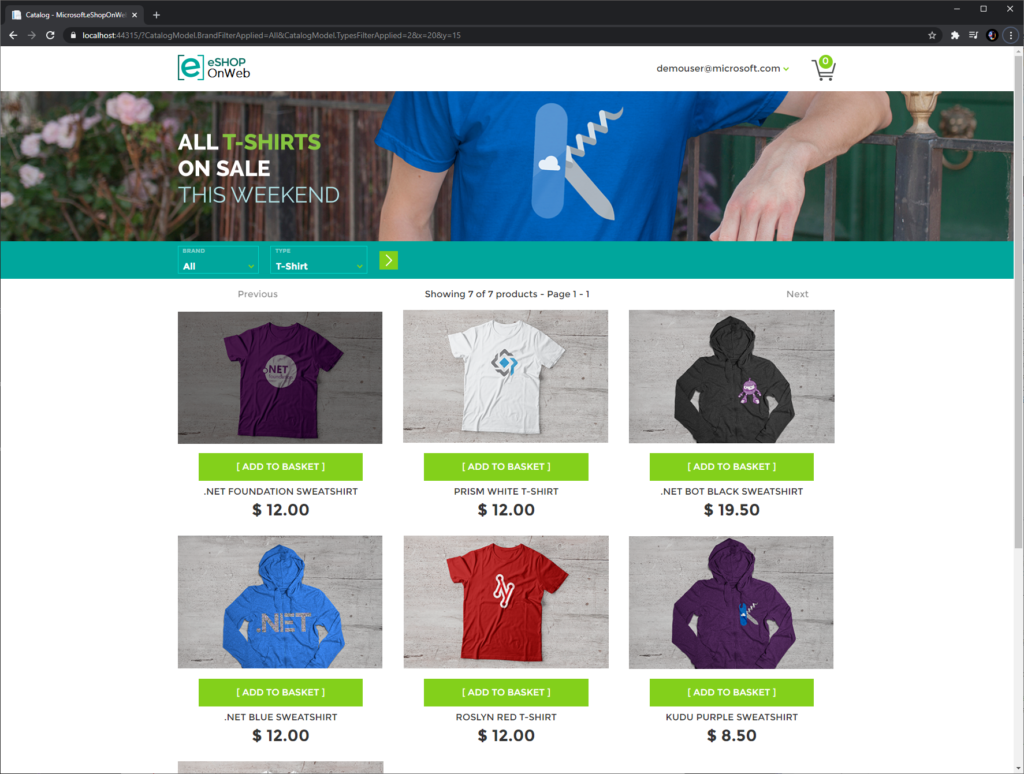
Even using the browser’s developer tools there is no way to identify exactly when a database query is happening or if it might be causing a delay during an action like filtering the catalog as seen in the screenshot above. Using the Database tool we can capture the exact database activity that happens during any user action and investigate further.
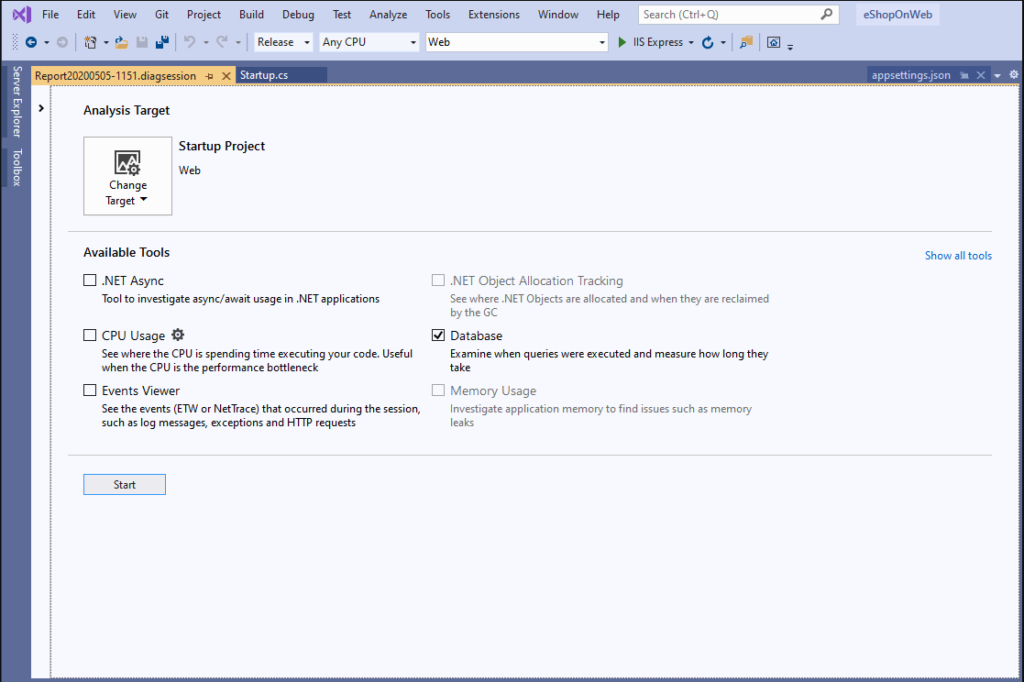
To do so we’ll simply open the Performance Profiler in Visual Studio by clicking Debug > Performance Profiler or using the keyboard shortcut Alt + F2 and selecting the checkbox next to “Database” to enable the tool. For a more accurate profile, run your application in Release configuration instead of Debug. Then click start to launch and begin profiling your application.
Interact with your application in the ways you’re interested in investigating, then when you’re ready to examine the data, click “Stop Collection” in Visual Studio.
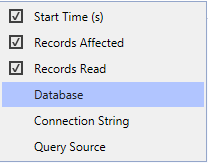
After collection is stopped, Visual Studio will quickly process the data collected and display a table of the queries that happened during your profiling session along with a graph that shows when and how many queries happen over time. Right clicking on any column header reveals the columns available that could help you order, and analyze the activity you recorded. This can make spotting anomalies very quick, such as a long running query that only affects a few records or a query using the wrong connection string.
After identifying a query that warrants further investigation, finding where in the code this query happens is as simple as right clicking on the row, and selecting “Go To Source File”!
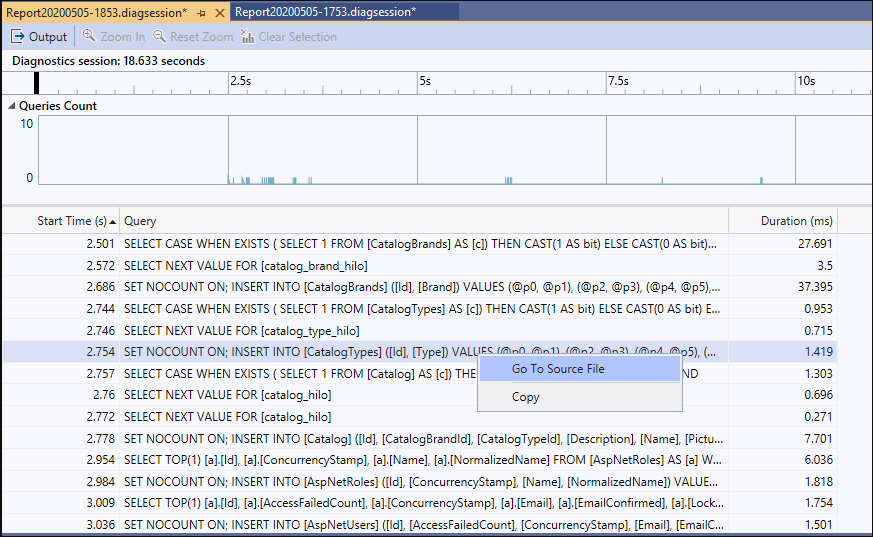
Whenever possible the tool will immediately take you the line or block of code that executed the query in question, saving you the often tedious task of digging through a complex code base.
Try it!
This feature can be found in Visual Studio 2019 version 16.3 or later and works with .NET Core projects using either ADO.NET or Entity Framework Core. This tool also works on traces collected using dotnet trace which means we can collect data anywhere that .NET Core runs (including Linux!) and analyze that data in Visual Studio. To see how to use dotnet trace check out the documentation found here and use the response file available for download here to enable the correct event providers.
We would love to hear how you are using this tool and any feedback that can help us make diagnosing issues and writing performant code an even better experience! If you have any Please take a few minutes to share your feedback.
 Light
Light Dark
Dark
0 comments