
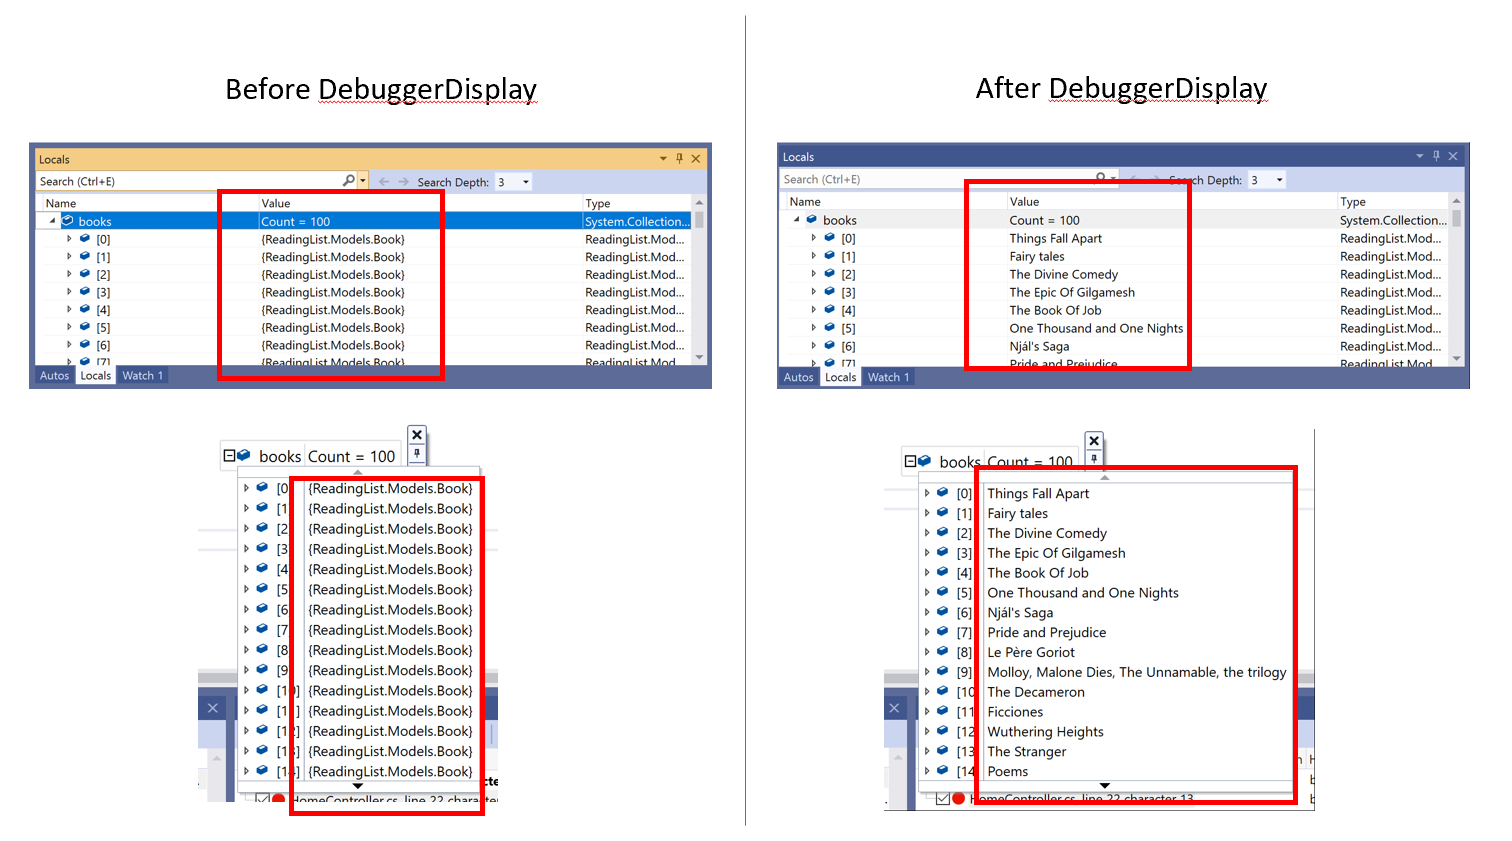
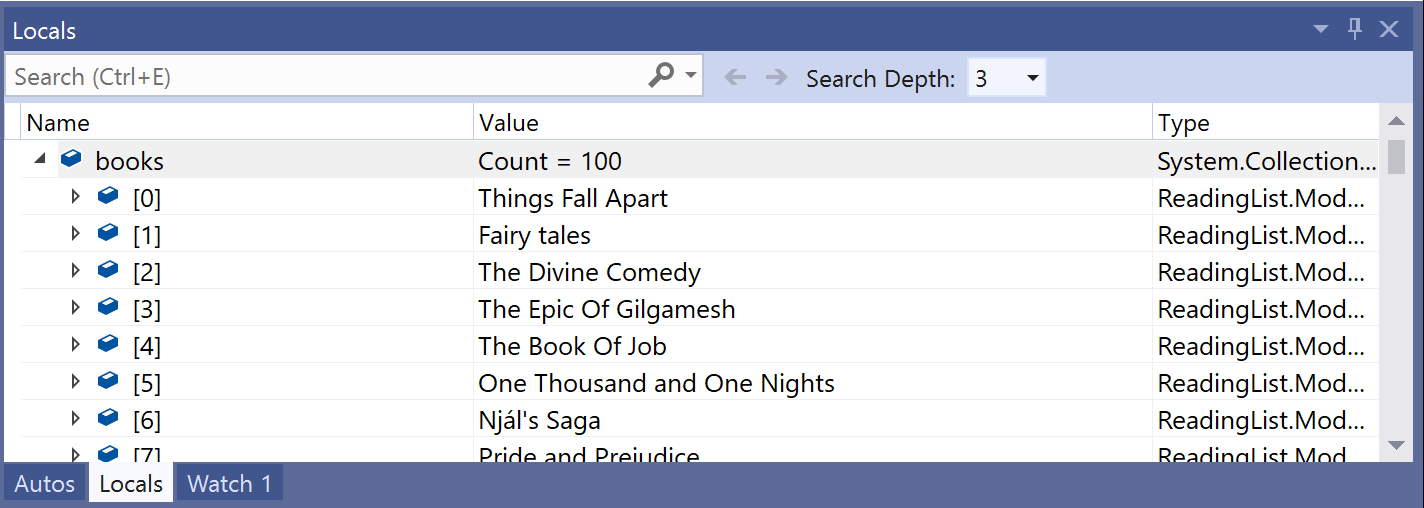
Customize object displays in the Visual Studio debugger YOUR way
Have you ever stared at objects in a debugger window and wished that you could view those objects by something other than their type? I certainly have! Expanding items to determine each one’s identity can become tiresome very fast. Ideally, it would be great to quickly locate them by a particular property value. Luckily for us, Visual Studio has two not-so-well-known attributes known as DebuggerDisplay for managed users, and Natvis for native C++ users. These attributes let you customize how you view objects in debugger windows such as the Watch, Autos, Locals, and datatips!
What is the DebuggerDisplay attribute?
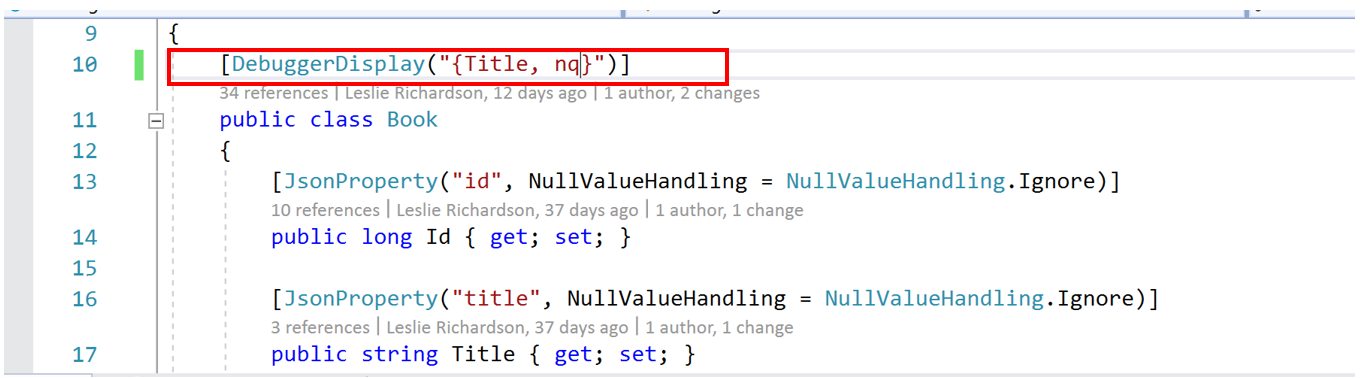
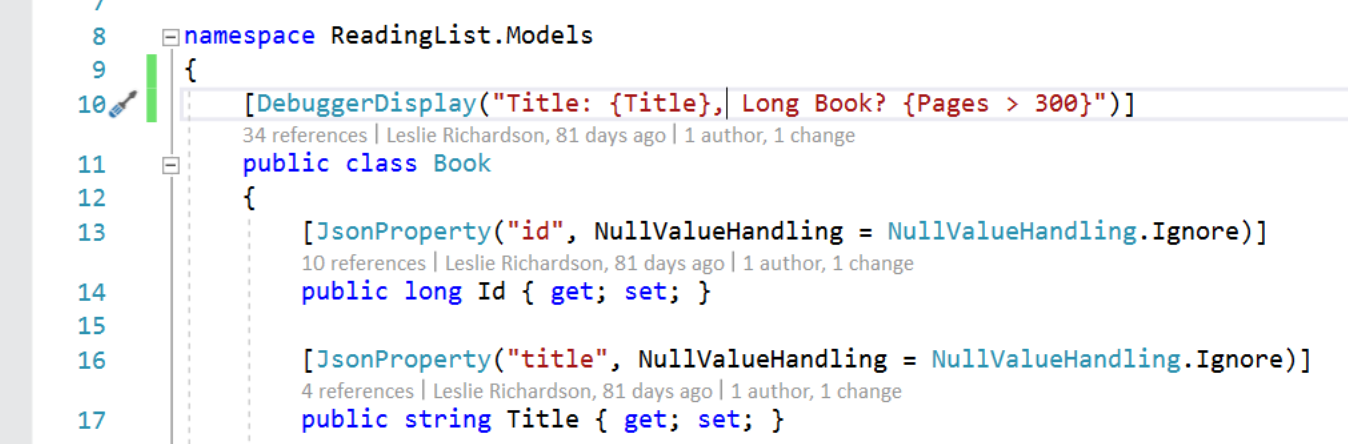
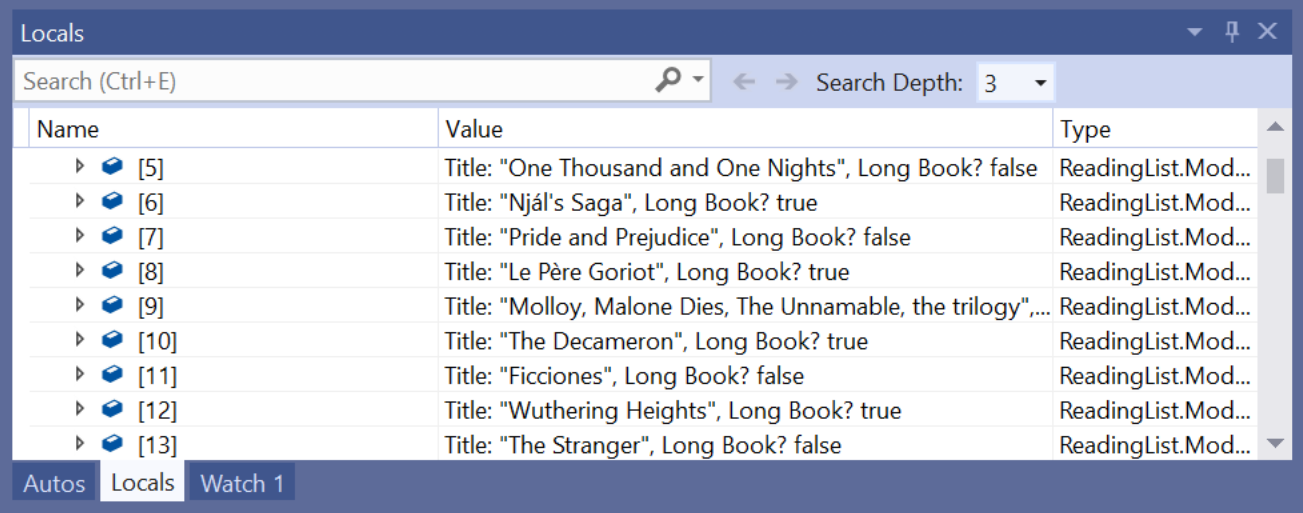
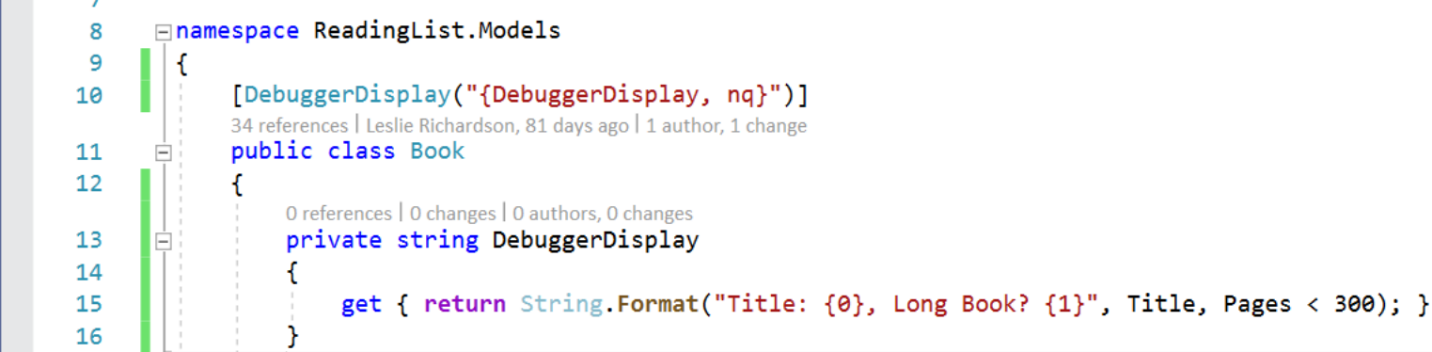
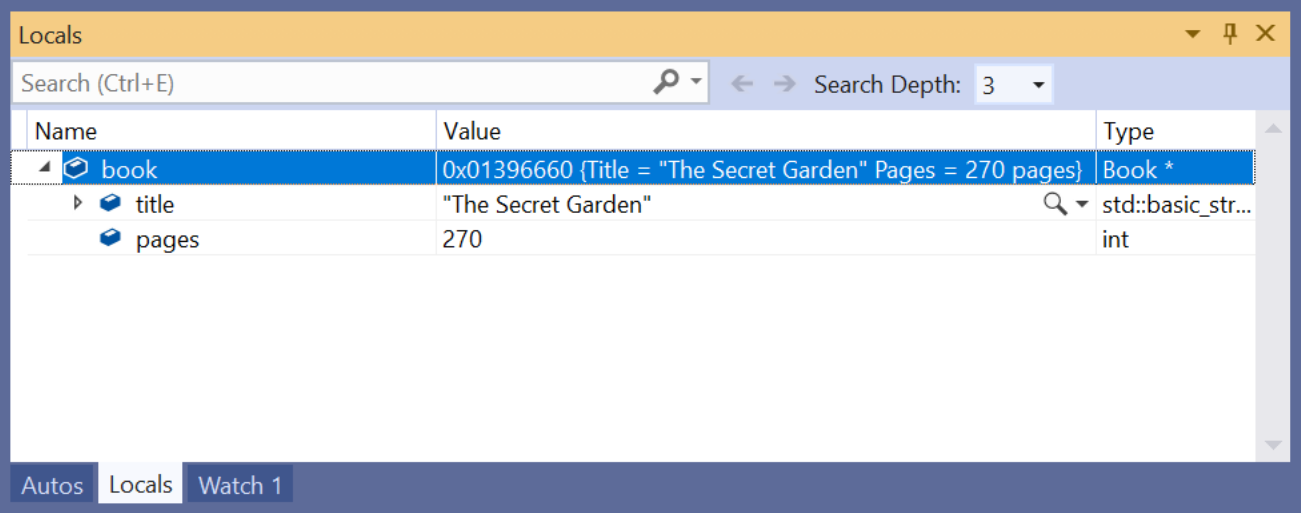
By writing DebuggerDisplay syntax at the top of a class, you can choose what strings and properties you want at the top of each object node in debugger windows. Besides displaying strings in debugger windows, adding curly brackets ({}) to the DebuggerDisplay attribute allows Visual Studio to display the value of a property or method that you specify. You can also add format specifiers to DebuggerDisplay in order to further change how values are displayed and formatted in the debugger windows. In Figure 2, DebuggerDisplay appends the format specifier “nq” (no quotes). The resulting display shows the string property Title without the surrounding quotation marks.
One previous workaround for performing this task is overriding a class’s ToString() method. In contrast, DebuggerDisplay controls how an item is displayed without overriding that method. So, if you don’t want debugging-related content in your ToString() method (especially when that method is called in your actual program), DebuggerDisplay is the way to go!
Can I display expressions for each object in debugger windows?
There may be times when you want to display expressions in debugger windows. Good news: you can display expressions using the DebuggerDisplay attribute!
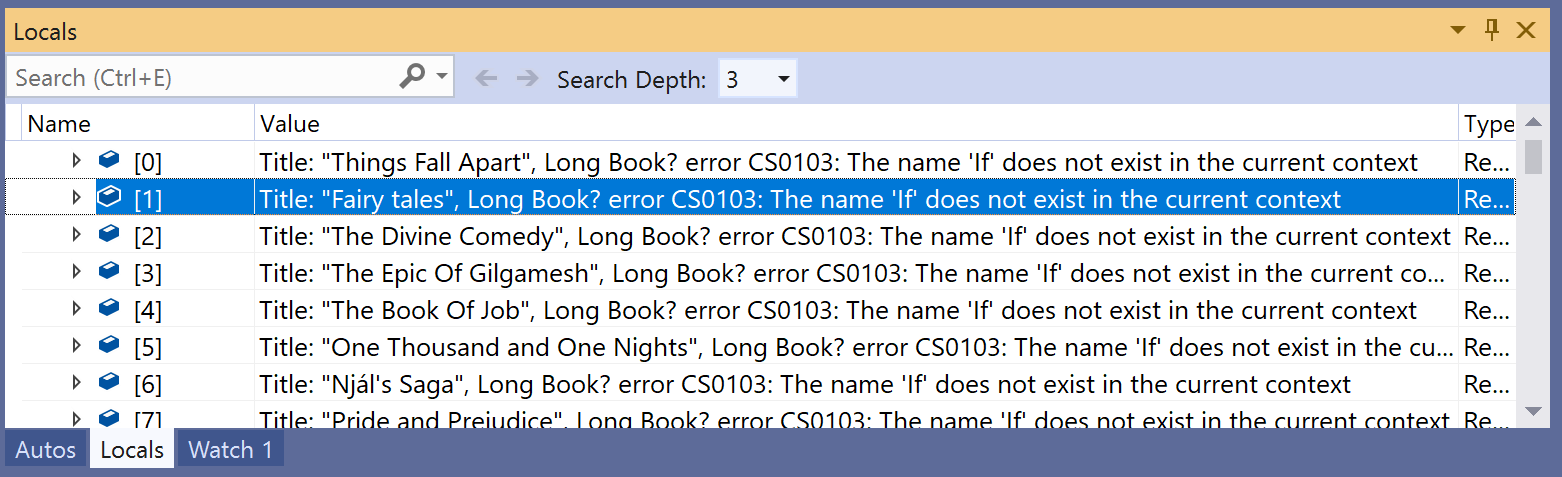
Bad news: DebuggerDisplay expressions can cause additional issues when debugging your code. Potential issues include performance hits for large or complex expressions, compilation and runtime errors when the expression’s language differs from the language being debugged, and application state changes when expressions mutate properties.

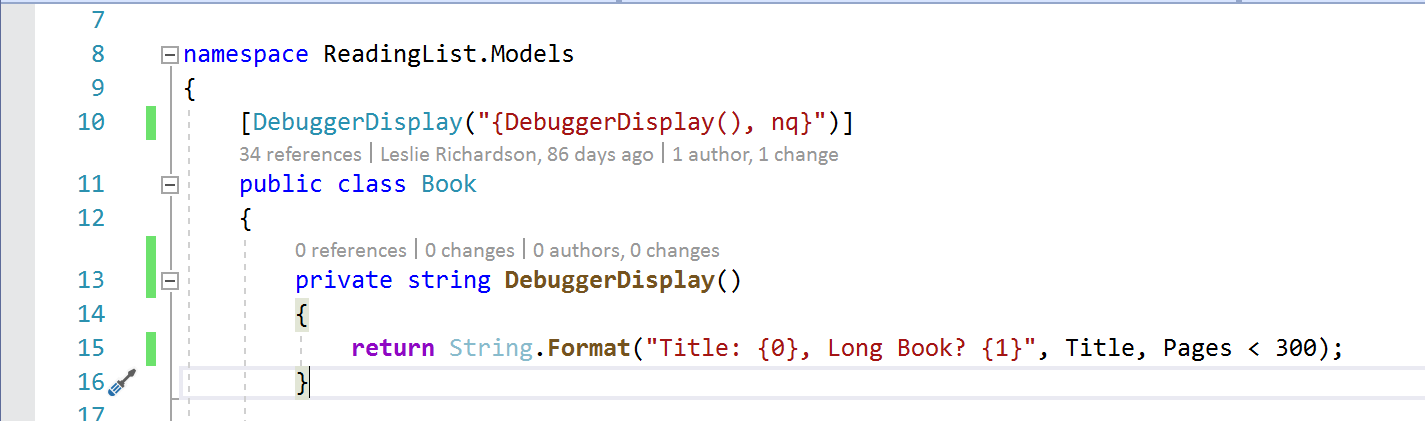
But fear not! One way to reduce these potential issues with expressions is by creating a private property or method that returns the string of an executed expression and telling DebuggerDisplay to display that property.
What is the feature equivalent to DebuggerDisplay for C++ users?
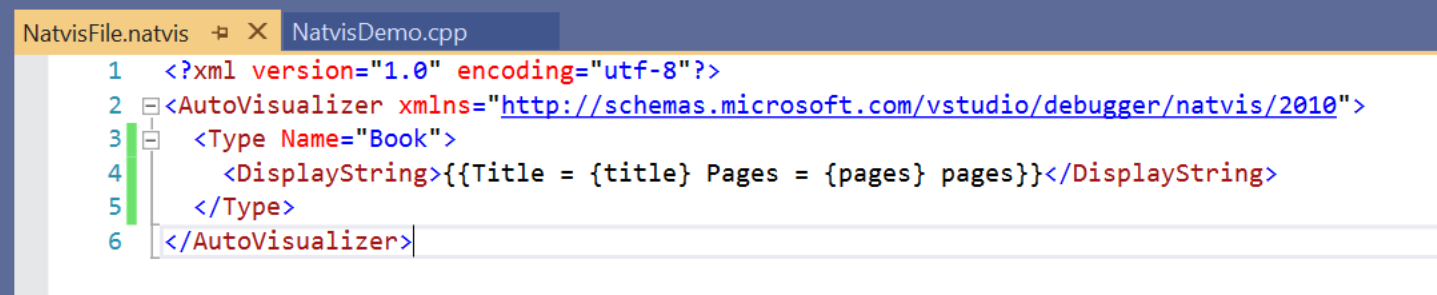
DebuggerDisplay is compatible with C#, F#, and Visual Basic, but if you’re debugging in C++, Natvis is a great alternative! Though not as simple as adding syntax to the top of a class like DebuggerDisplay, adding a .natvis file to a project lets you customize how objects are displayed.
Right-click the C++ project node in Solution Explorer, select Add > New Item, and select Visual C++ > Utility > Debugger visualization file (.natvis). The result is an XML file where you can control which properties are displayed while debugging.
To learn more about using Natvis while debugging C++ projects, check out the documentation.
These features are awesome and will save me lots of time! How can I help share DebuggerDisplay and Natvis with others?
Fun fact: both DebuggerDisplay and Natvis attributes have been in Visual Studio for years! These attributes are extremely useful to most developers but are still not as discoverable and well-known as they could be. As a result, we are currently working to provide an easier method to discover these attributes better, and your feedback will help make this happen! Please complete this survey which will give us insight in providing an improved experience when using these attributes.
 Light
Light Dark
Dark
12 comments
I wish this was easier and properly baked in Visual Studio without using any attributes or commercial extensions, e.g. like this Visualizer example which is not working unfortunatelly on .NET Core https://github.com/codecapital/EnumerableVisualizer/issues/1 Still, it is helpful using DebuggerDisplay but ideally we should be able to see any array or object in e.g. table form.
Note that this github example doesn’t require to modify source code or to add any attributes 🙂
You may be able to get the visualizer to work with .NET Core projects by putting it in a subfolder named “netstandard2.0” (as noted here).
Thank you, that is very helpful, now I am getting different errors relating with System.Windows.Forms. I have to look into your solution as you are using WPF which might be a better solution. Thanks Zehev!
Ok I have now managed to fix my issues. I moved to WPF from Windows.Forms, then had some Security issues with Json.NET so moved to System.Text.Json and now getting byte stream of any object in .NET and .NET Core (without any attribute decorations like mentioned in this post) to WPF form. Still lots of work to do now to parse JSON to WPF DataGrid…
“One previous workaround for performing this task is overriding a class’s ToString() method.”
DebuggerDisplayAttribute has been around since at least .NET Framework 2.0, so since 2006. The statement above is misleading because makes it sound like this is some new feature.
There’s a reason DebuggerDisplayAttribute gets hardly any usage. The same reason custom visualizers in VS get hardly any usage. They are both terrible solutions that require you to modify source code and hardcode solutions to specific types. It’s long past time to bring the VS debugger into the 21st century and add some of the features OzCode adds (like being able to highlight certain properties for a given type at runtime while debugging). And please please please overhaul the visualizer API already. It’s an embarrassment how bad visualizers are compared to other IDEs (or even the custom ones in VS, like Python and R.)
This comment has been deleted.
The visualizer API is admittedly limited — (see here and here) — and there is no straightforward way for visualizer authors to leverage the Marketplace. But custom visualizers don’t modify the source code; they create new types, ideally in a separate assembly, that provide a specialized view for a specific type.
You note that custom visualizers require targeting to a specific type; that is precisely their value, in providing a visualization unique to that specific type. Consider the custom visualizer I’ve written for expression trees — it’s completely irrelevant for virtually all other types.
please overhaul the visualizer API — Out of curiosity, what other limitations have you found in the visualizer API?
+1 for OzCode.
I agree with @MgSam that VS should definitely be usable more like OzCode, when it comes to the DebuggerDisplayAttribute. But I don’t think that custom visualizers are a terrible solution, they just should be improved and continously maintained. Since the inner workings of VS keep changing, it is often hard to troubleshoot why they are not working and how to install them – see: https://developercommunity.visualstudio.com/content/problem/562662/vs2019-custom-debugger-visualizer-for-net-fx-and-c.html I have been using DebuggerDisplayAttribute, DebuggerTypeProxyAttribute and DebuggerVisualizerAttribute heavily for years now and my favourite feature is, that they all can be used on types for which you don’t “own” the code:[assembly: DebuggerDisplay(“No. of Subscribers: {GetInvocationList().Length} No. of Invocations: {_invocationCount}”, TargetTypeName = “System.MulticastDelegate”)] But this features seems to be not really supported by Microsoft see: https://developercommunity.visualstudio.com/content/problem/68105/debuggertypeproxy-attribute-in-autoexpcs-doesnt-wo.html and for a workaround that is broken in VS2019: https://social.msdn.microsoft.com/Forums/vstudio/en-US/07b97513-d980-4f20-92a4-9dd87c1394b1/can-an-extension-inject-an-assembly-dll-into-the-debuggee?forum=vsx So, in summary: These three atributes are incredibly powerful, but they could be better documented, better maintained and easier to use and troubleshoot. And they have to work on the assembly-level and in .NetFx and .Net Core!
The issue you linked to isn’t a reflection of changes to the inner workings of Visual Studio; it’s a reflection of .NET being available on a (relatively) new platform (.NET Core), different from the actual platform in which Visual Studio is running (still .NET Framework). (For fascinating insight on a similar problem — how the WinForms designer running in VS was made to work against .NET Core objects — see Updating the WinForms Designer for .NET Core 3.0.)
Where have you seen issues in custom visualizers because the visualizer API has changed?
Thanks a very helpfull info.
Ehm… This is SO cumbersome. You have to stop debugging, add attribute, start debugging, get to the same part of code and then you can see something.
Oz-Code already solved this by the most elegant way: https://www.youtube.com/watch?v=gg0hGWKOBoo
More here: https://oz-code.com/features/