
quantum-viz.js: a quantum circuits visualization library
We recently released our JavaScript library for quantum circuits visualization as a new open-source project: quantum-viz.js. You might recall it was originally developed last year as an intern project by Raphael Koh, who wrote a great blog post about it for our 2020 Advent Calendar.
Quantum circuits are a commonly used representation of quantum programs, so we’ve been looking for ways to incorporate them into Q# and the QDK. We first considered using existing tools like qpic or qcircuit, but typically they must be invoked from the command line or a Python script, and one key requirement for us was the ability to integrate the visualizer with IQ#, our Jupyter kernel for Q#, which is built on top of .NET Core. Also, these tools generate a static representation of the circuit in the form of a jpeg, LaTeX or pdf file, but we had some interactivity components in mind that we wanted to expose through the tool, so instead we took a bit of inspiration from Bono and built a stand-alone tool based on core HTML technologies like svg, css and javascript.
An example of the interactivity we wanted to build is the ability to expand the definition of an operation. Q# is a high-level programming language for quantum programs; thus, it is possible and common to group operations to reuse them and to convey intention. Take for example the following implementation of the common Teleport algorithm:
From the diagram you can quickly get a high-level view of the different elements of the program: there is an operation that entangles a pair of qubits, another that prepares a message on another qubit, a process that encodes the message using one of the entangled qubits and finally another operation that decodes the message on the other entangled qubit. But notice this circuit is interactive: if you move your mouse over an operation block, you’ll see a ‘plus’ sign appear. Clicking on the plus sign shows a detailed view of that operation so you can see the actual gates. Try it now!
Another interesting interactive feature we built is the way we represent classically controlled operations. Take the following circuit:
When the first qubit is measured, if the result of measurement is 1 the program will apply a Z and X operations to the second bit; otherwise, if the measurement is 0 it applies just a Y. The visualization represents the unknown state of the circuit before measuring with a transparent block of gates: when you click the circle with question mark once, the circuit shows the gates that are executed when the measurement is 1; if you click on the circle again it shows the gates that are executed when the measurement result is 0.
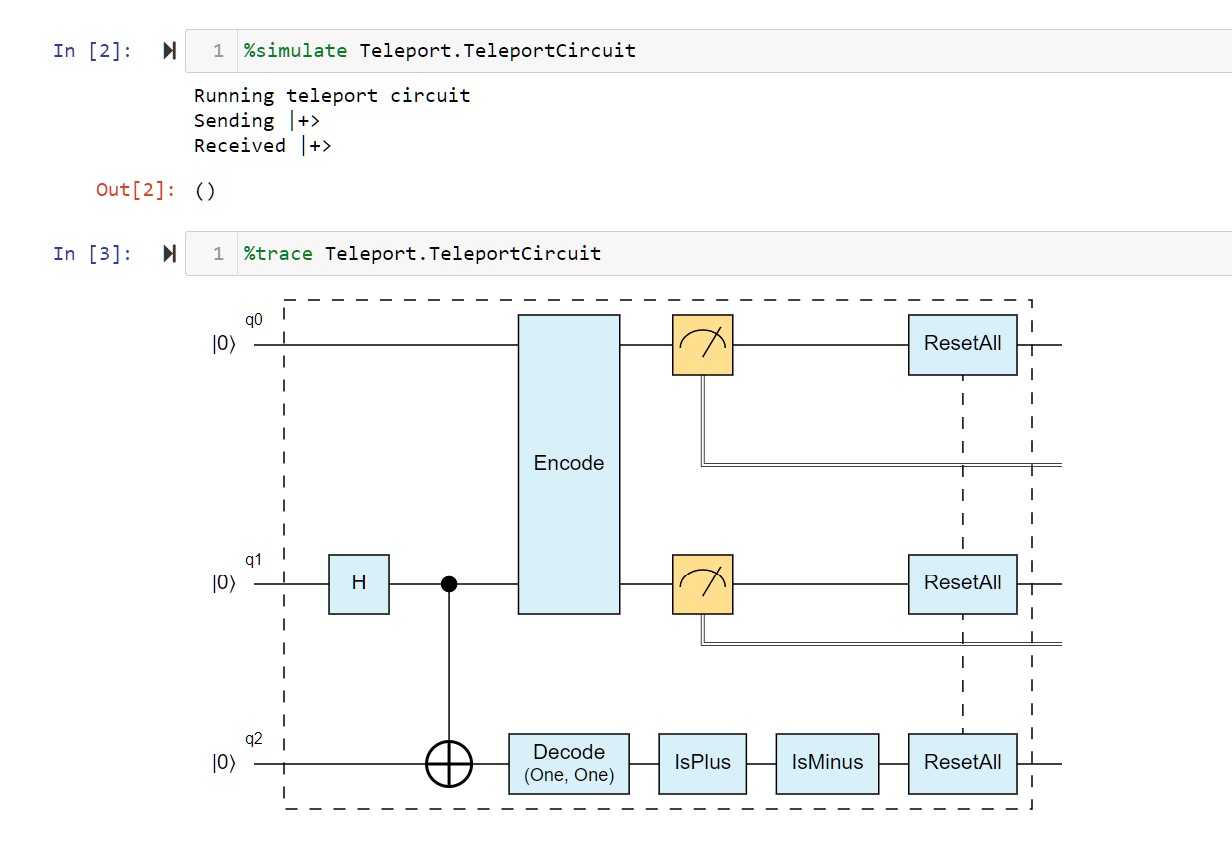
This tool is currently available on IQ# using the %trace magic which we discussed previously in this blog post. Since Q# can mix classical and quantum operations with high level constructs like arrays and loops, there is not a single circuit associated with a Q# program, so this command simulates the corresponding operation and traces the quantum gates that are executed to visualize the corresponding circuit:
Because the tool is built using core HTML technologies, integrating it with Jupyter was fairly simple. We now took the extra step of packaging as a stand-alone tool so it can be easily integrated into other web applications, like Observable or even this blog post!

We are excited about the potential of this tool and we already have some new features in mind, such as the ability to show how the state of the qubits evolve as the program executes. If you have other ideas that you would like to contribute or would like to incorporate the tool into your projects let us know as we would be excited to collaborate.
 Light
Light Dark
Dark
0 comments