
[Service Fabric] How to troubleshoot deployment errors in Service Fabric Windows cluster
Having issues deploying your service to your Service Fabric cluster? Check out this post from Premier Developer consultant Julien Oudot on troubleshooting deployment issues in Service Fabric.
The Service Fabric explorer is a great interface to control the cluster health and configuration. However, I recently worked with customers who did not find obvious to debug issues occurring while deploying services in an Service Fabric Windows cluster. The fact that they could not find this information prevented them from experimenting the great features part of Service Fabric.
In addition to the usual debugging in Visual Studio, here are some ways to detect what went wrong when deploying your services in a Service Fabric cluster. Both in the local cluster or in Azure, these techniques can be useful to diagnose and fix this type of failure.
Using the Service Fabric explorer
This web interface contains a lot of information. It is multi-levels and multi-entities. Users can browse by Application, Node, or System service and expand them.
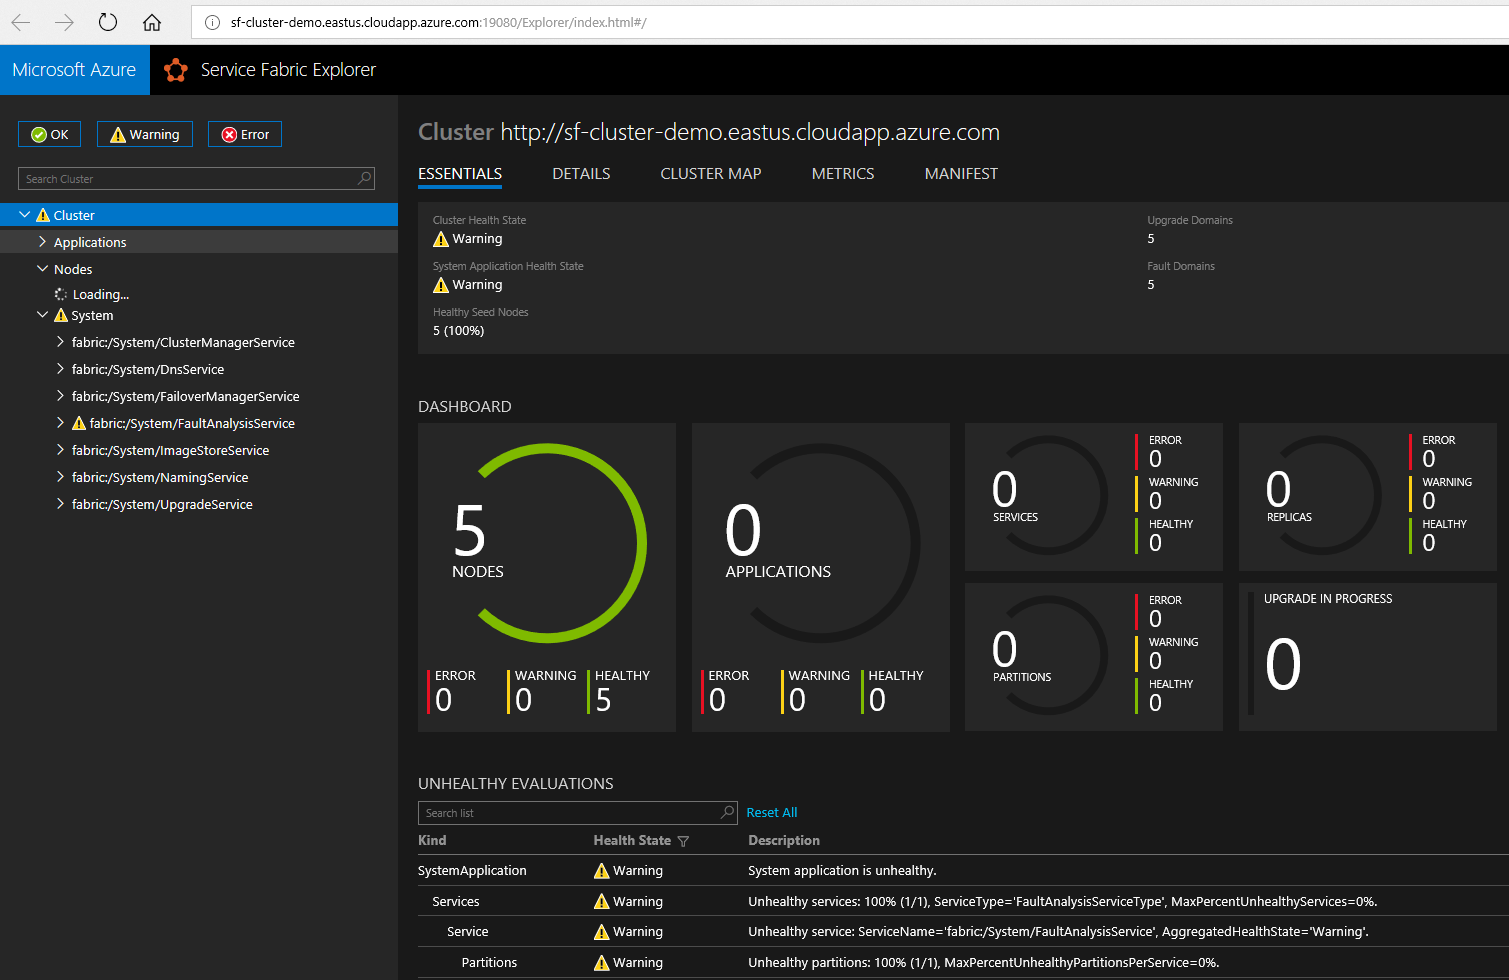
When you first deploy a cluster in Azure, the first thing to check is that the nodes are up and running and that all the System services are healthy.
Sometimes, the deployment status can be complete in Azure even though the nodes are not properly assigned to the cluster or some System services are still failing. To check that it is ready, the Service Fabric explorer is the right tool.
Below, we can see that, even though the 5 nodes are healthy, we cannot load them in the explorer yet. One of the System service is still failing.
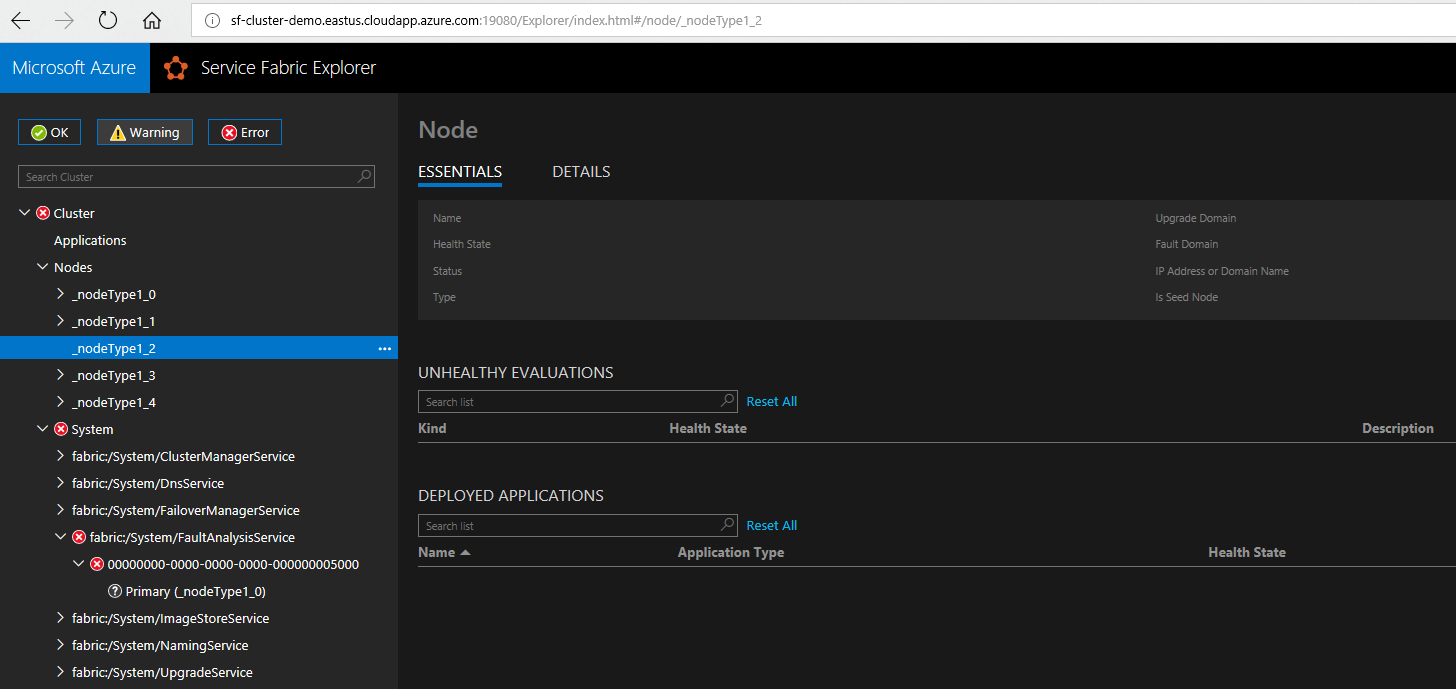
After some time, the nodes appear and we can select them. However, they have no state. They are still being initialized.
And finally, the node become in ‘Ok’ state and all System services are healthy. The services can now be deployed in the cluster.
Debug deployment issues in the Service Fabric explorer
When selecting the application, service or partition, the errors are generic, even when clicking on the ‘Details’ section.
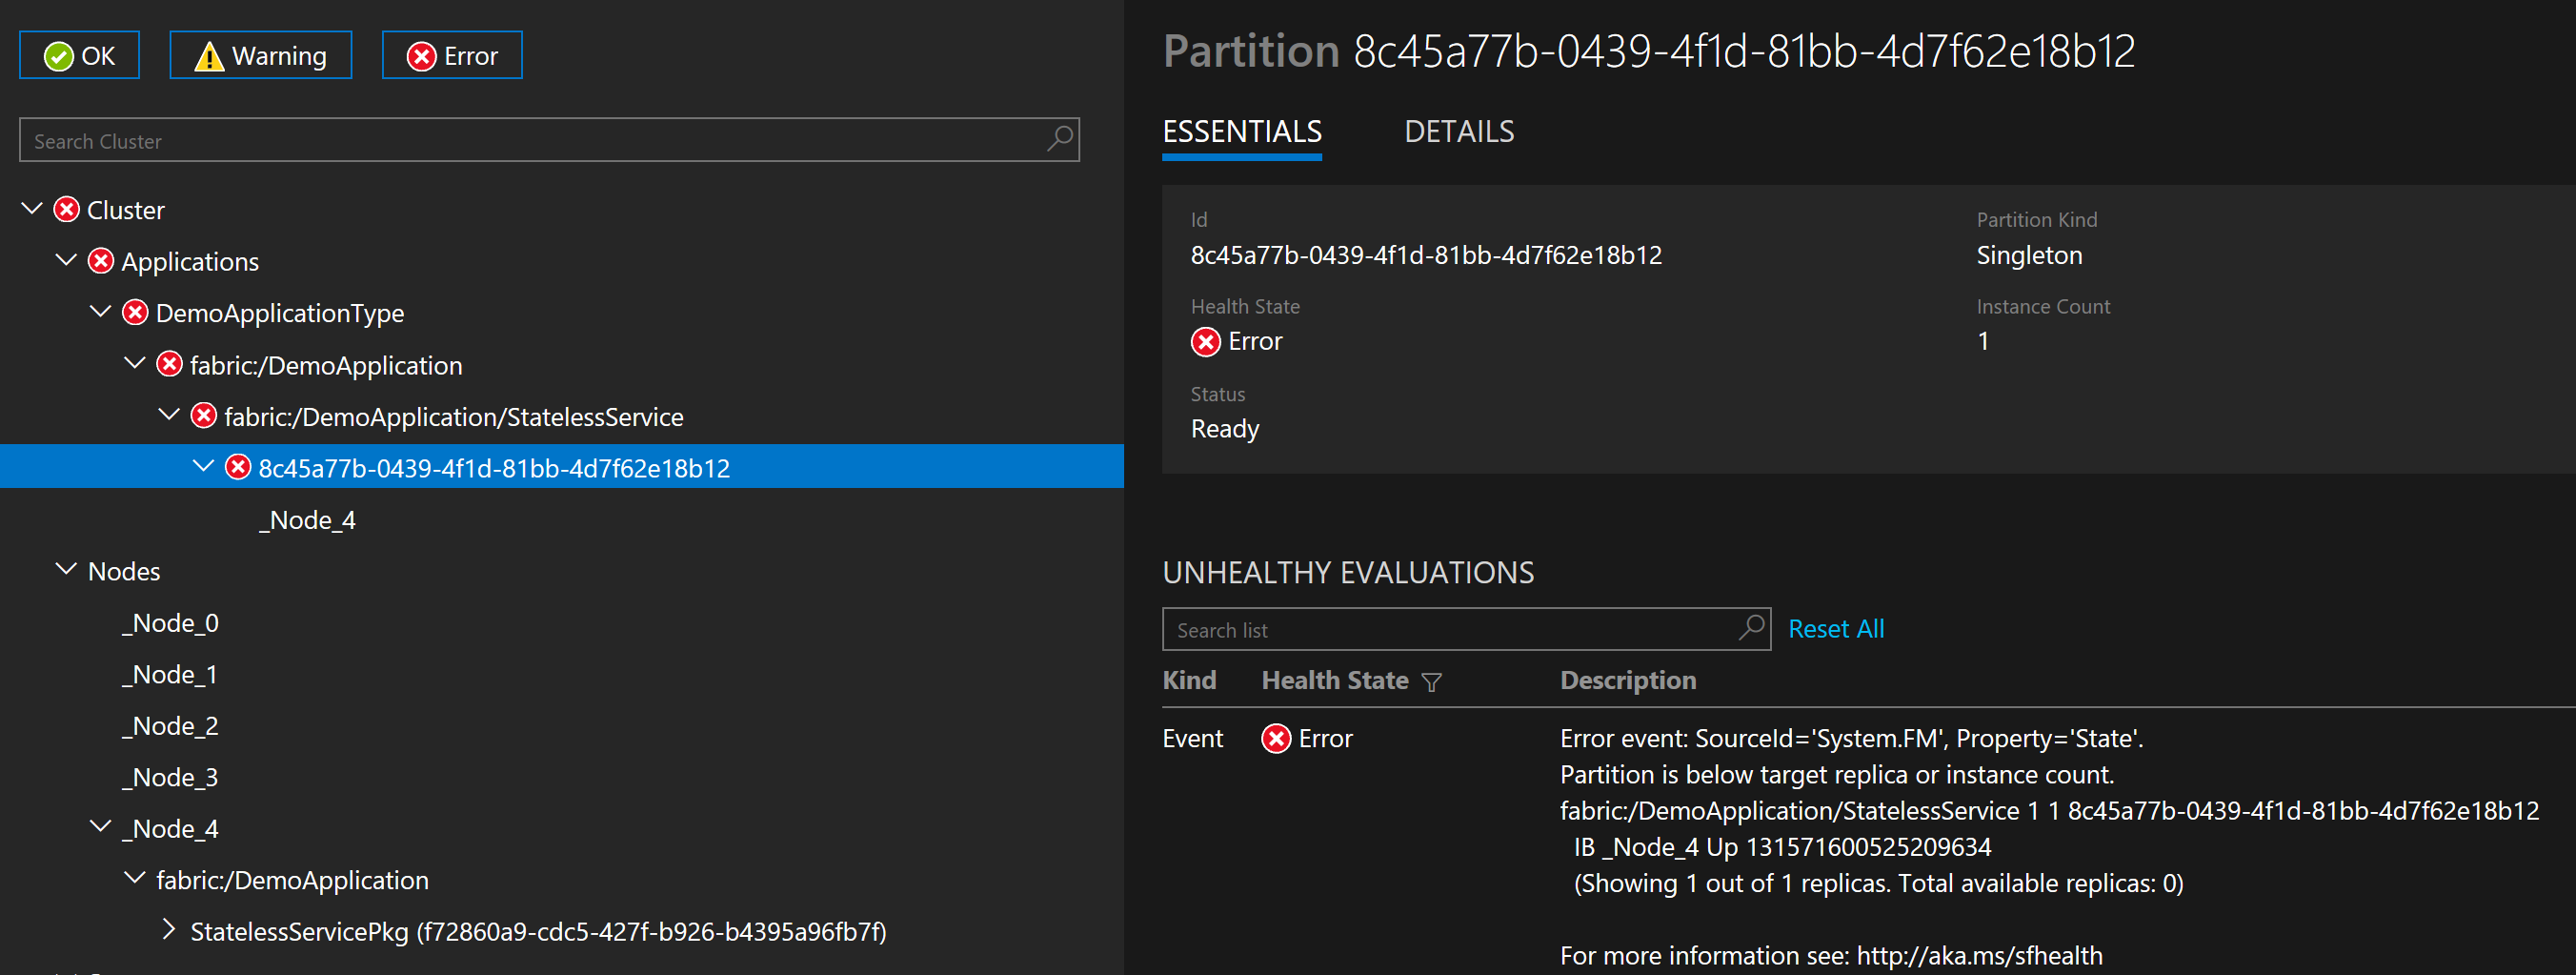
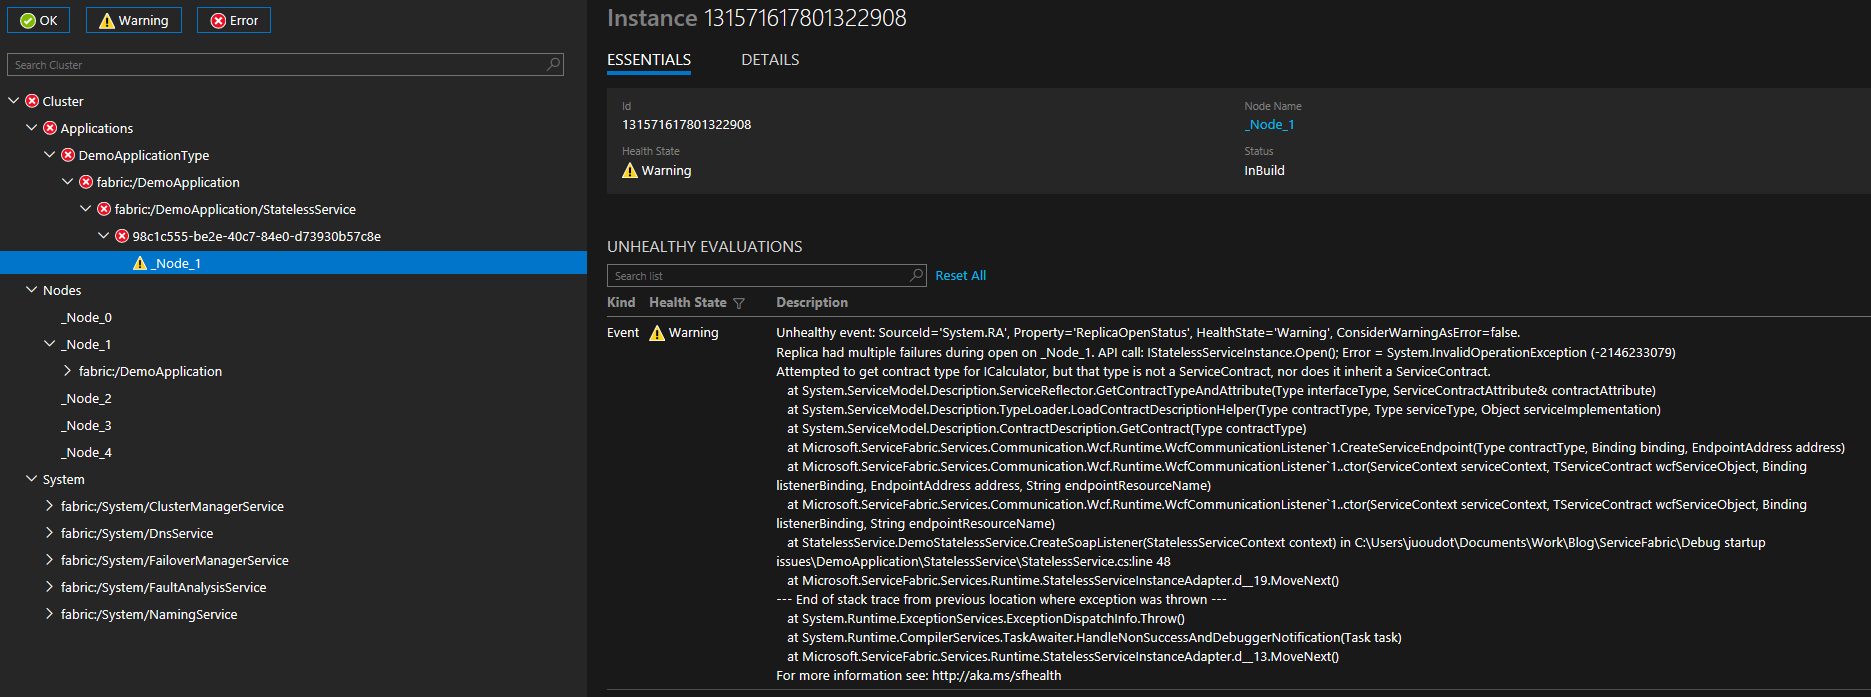
But at some point, when the deployment fails, an error should be displayed while selecting the node in the partition (as opposed to the ‘Nodes’ section below).
Debug service errors using the log files
Assuming there are some Console.[Error.]WriteLine in the code when exceptions are thrown, the Service Manifest can be updated to redirect the console output to the log files as shown below:
<!-- Code package is your service executable. -->
<CodePackage Name="Code" Version="1.0.0">
<EntryPoint>
<ExeHost>
<Program>StatelessService.exe</Program>
<ConsoleRedirection FileRetentionCount="5" FileMaxSizeInKb="2048"/>
</ExeHost>
</EntryPoint>
</CodePackage>
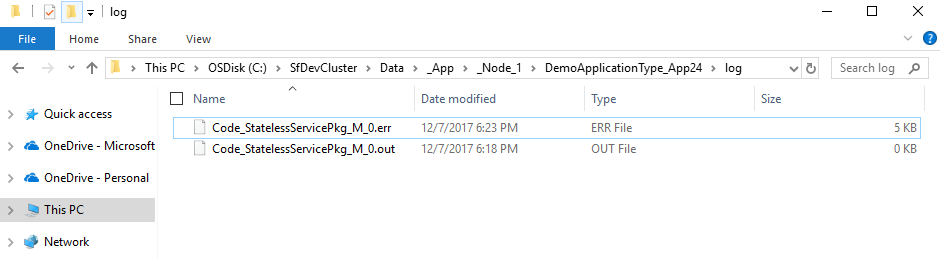
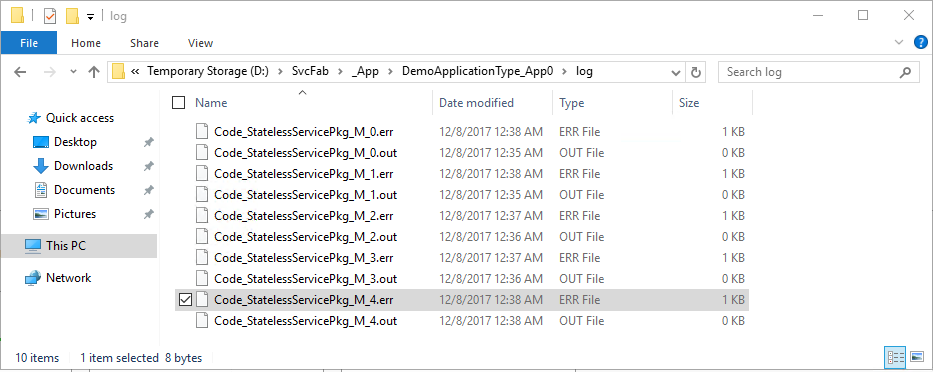
Then, when some logs are written, we can go in the local cluster to see the output files. Below are the log files to locate.
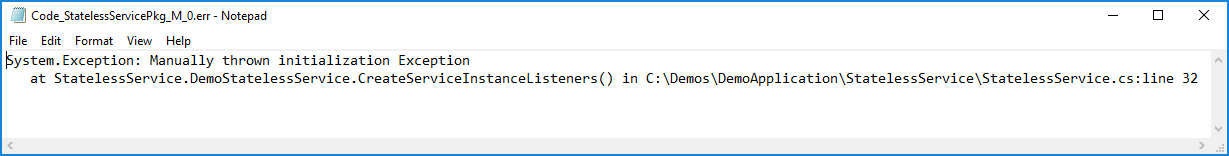
And here is the log line written to the console in the service.
Troubleshooting a Service Fabric cluster in Azure
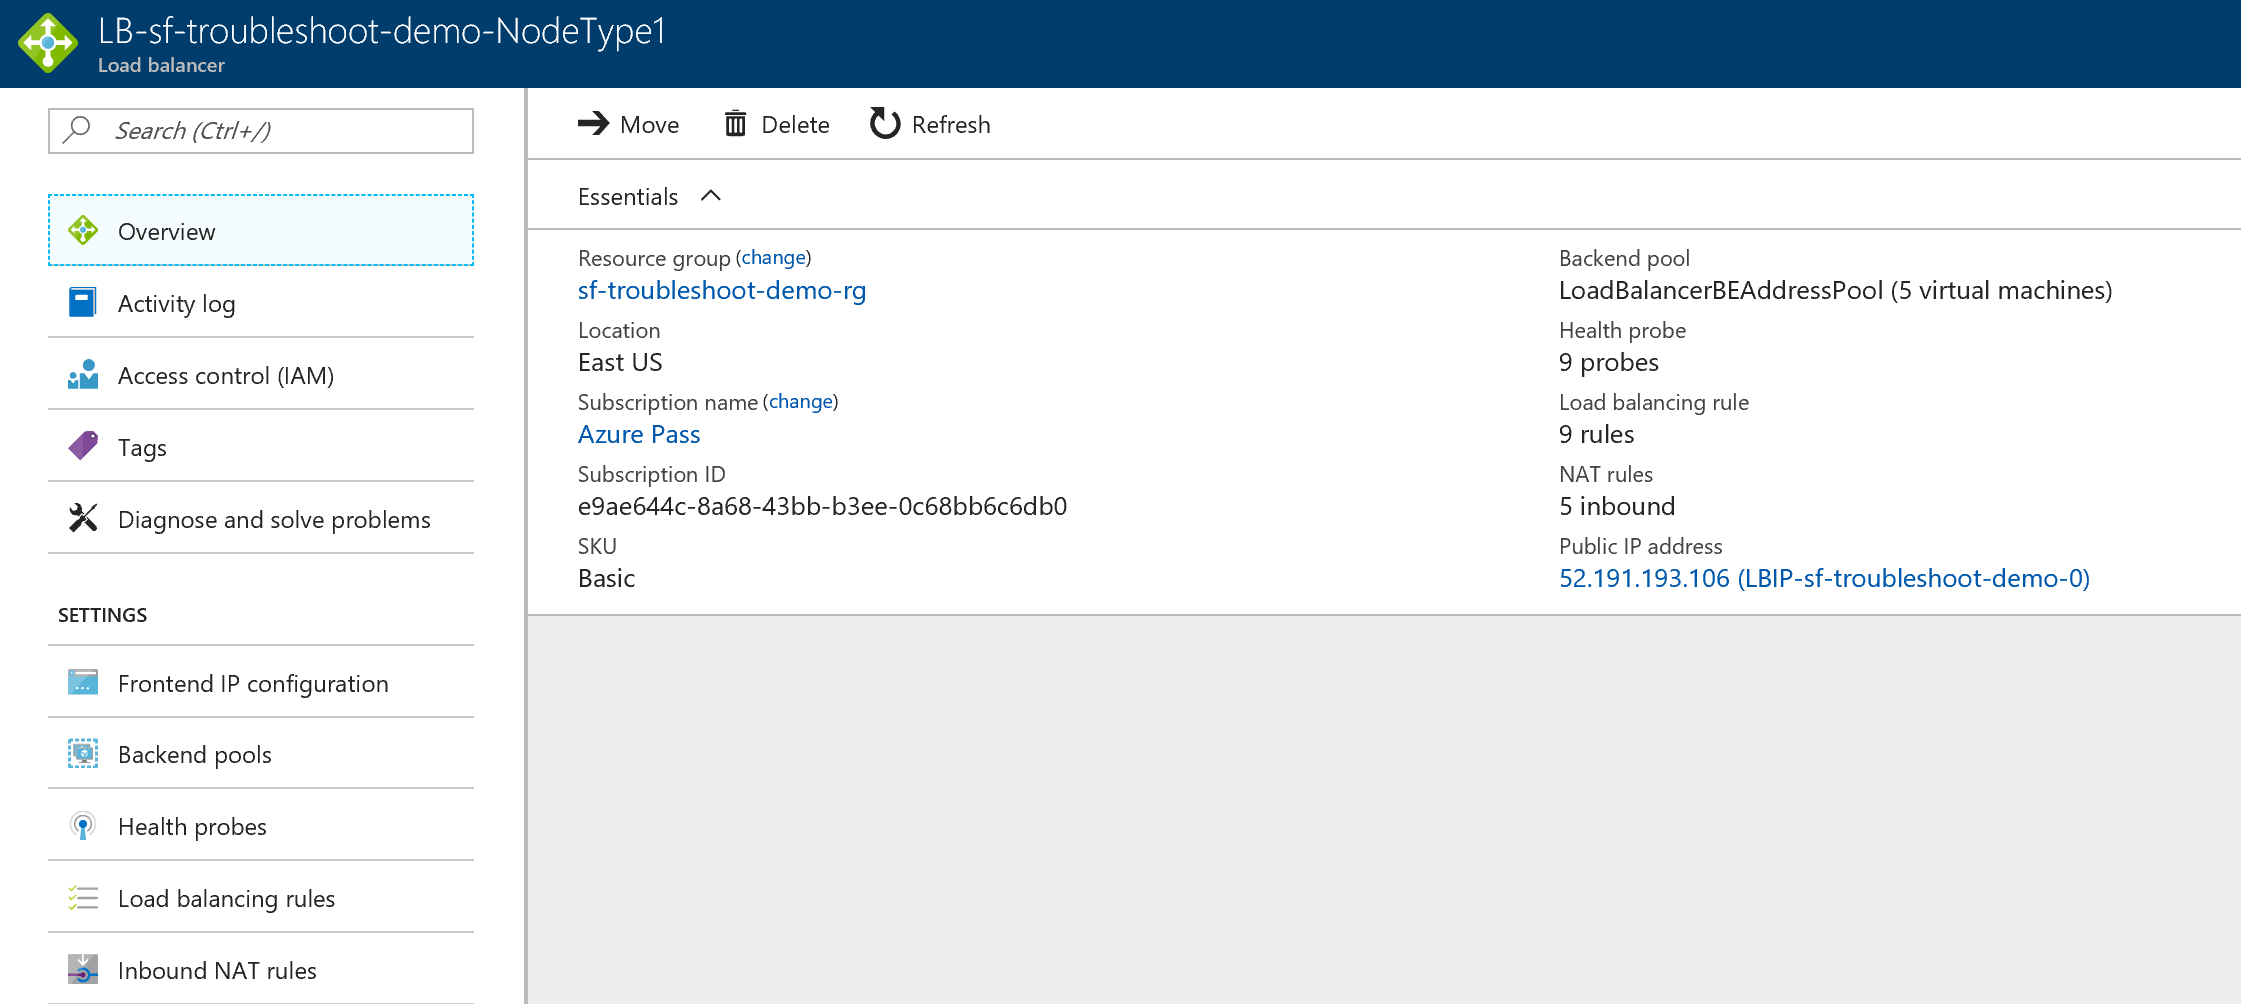
When deploying in an Azure cluster, the troubleshooting option are event better. First, we need to connect remotely to the cluster. To do this, we can open the remote desktop application and type the IP of the load balancer and the port of the machine we want to look at. The user name and password used to connect are the one used when creating the cluster (the domain used has to be localhost\).
Here is the load balancer that has been created along with the Service Fabric cluster.
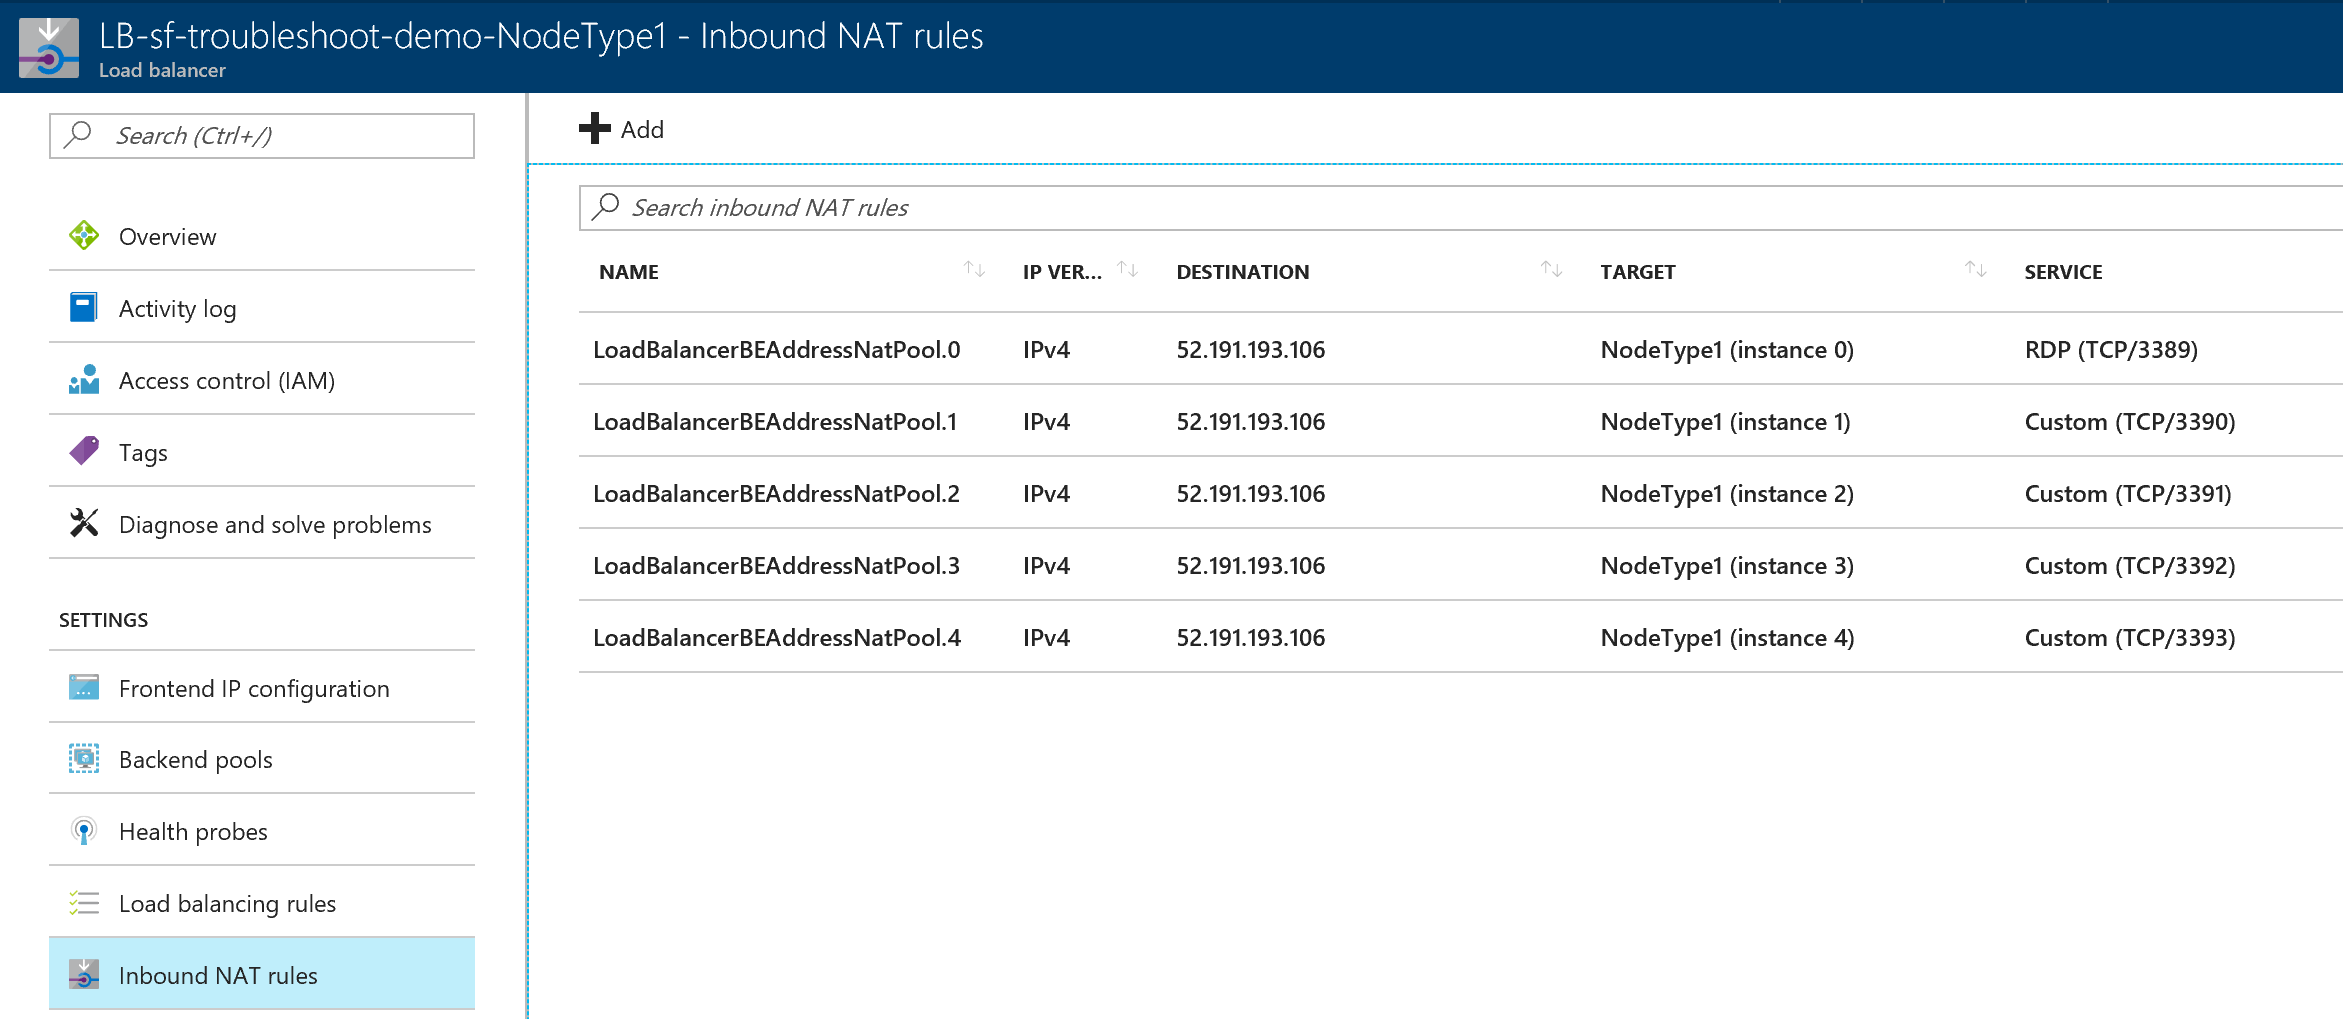
Below is a screenshot of the load balancer NAT rules. To connect to the instance 3, we will need to target 52.191. 106:3392.
The log file can also be found in the following directory (only on the node):
This “ConsoleRedirection” option is useful for local development and debugging purpose but not for production, as explained on this page: https://docs.microsoft.com/en-us/azure/service-fabric/service-fabric-deploy-existing-app
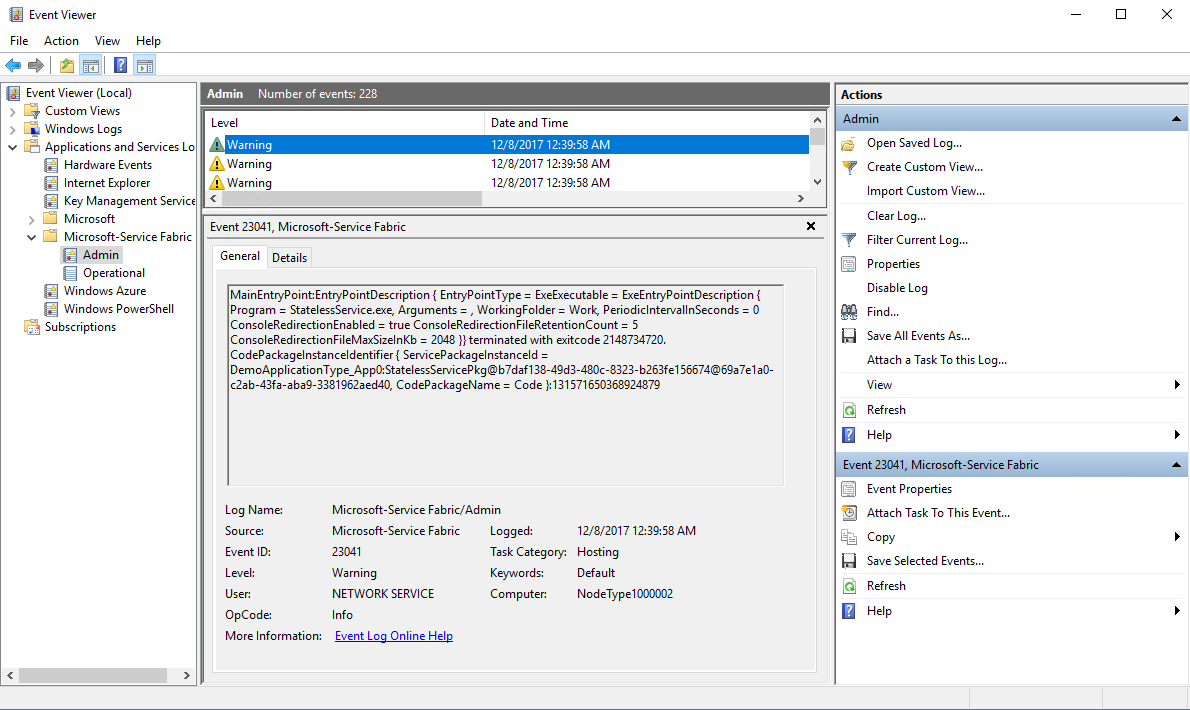
Finally, depending on the error being encountered. It can be useful to take a look at the Event Viewer on the Service Fabric nodes:
There techniques, along with the debugging capabilities part of Visual Studio should help you to troubleshoot most of the errors you can encounter while deploying your Service Fabric service into your cluster.
 Light
Light Dark
Dark
0 comments