
DAX Calculation Groups for Time Intelligence
Dev Consultant Jean Hayes spotlights Data Analysis Expressions (DAX) with Calculation Groups.
Power BI Premium (Preview), Azure Analysis Services and SQL Server Analysis Services 2019 now support Calculation Groups! Why am I so excited? Because this functionality was one of the best capabilities in Multidimensional Analysis Services through Named Sets and Calculated Members. Similar capabilities are now available in AAS/SSAS Tabular as well as in preview in Power BI Premium. Please note that as of April 2020, Power BI Desktop does not have the capability to create calculation groups; in order to add Calculation Groups in Power BI, you need to use Visual Studio 2019 and deploy to a Premium Capacity Workspace with XMLA Read/Write enabled.
Scenario
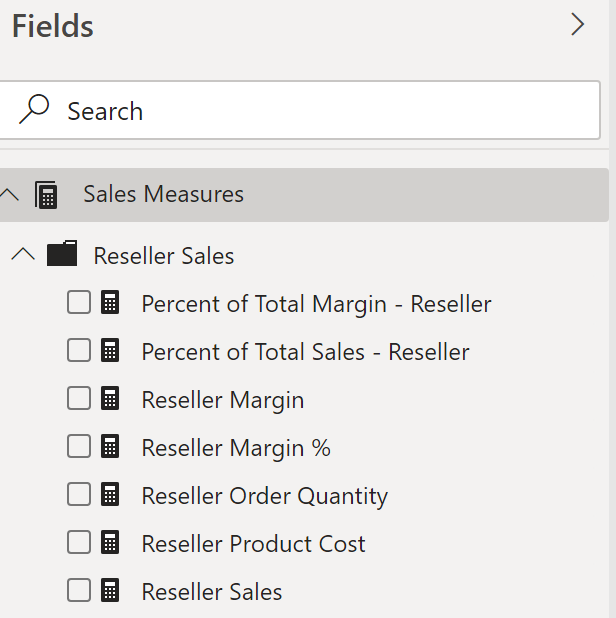
Before Calculation Groups, if you wanted date aggregations or time comparisons in your Power BI, AAS or SSAS tabular model, you needed to create a separate measure for each measure/aggregation/ time comparison. In the example below, I created 7 basic measures plus Time Intelligence measures for the Reseller Sales measure:
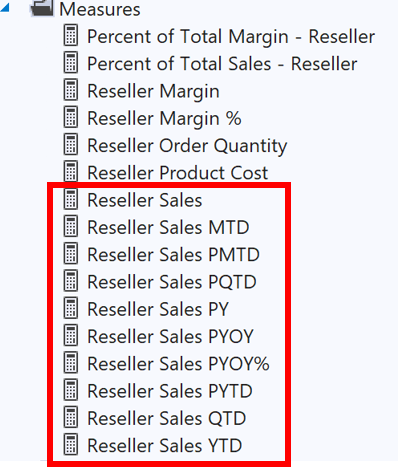
We have Month-to-Date, Quarter-to-Date, and Year-to-Date measures for Reseller Sales.
We have Prior Year, Prior Year over Year, and Prior Year over Year % Difference for Reseller Sales.
Additionally, we have Month-to-Date, Quarter-to-Date, and Year-to-Date measures for Reseller Sales for the Prior Year. That makes a total of 9 additional measures all based upon Reseller Sales.
Now imagine, you also want Year over Year and Year over Year % for Month to Date and Quarter to Date; that would add another 4 measures, bringing total number of measures based upon Reseller Sales to 13.
Now imagine you want all the same Time Intelligence capabilities for all of your other measures – Reseller Margin, Reseller Margin %, Reseller Order Quantity, etc. Your model has grown from 7 basic measures to 7 *13= 91 measures!
Now there is a better way!
Calculation Groups
Calculation Groups allow you to define DAX formulas that you can apply to the selected measure in your report filter context.
The Calculation Group is made up of Columns and Calculation Items. Each Calculation Item is a DAX calculated measure which leverages the function SELECTEDMEASURE() as well as other functions to work on the SELECTEDMEASURE. Two Columns can be defined in a calculation group. One Column will act as the container for the Calculation Item names which the user will leverage in the report interface to display the calculation they want applied to the selected measure. Another Column can be added to control the order in which the Calculation Items are displayed in the reporting interface. This latter column must be called Ordinal.
Add your first Calculation Group
For this exercise, we will create a Calculation Group for the Prior Year calculations for the Calendar Year. Later we will create another Time Aggregations Calculation Group which can be used in conjunction with the Prior Years Calculation Group to create values such as Prior Year to Date. Having separate Calculation Groups further reduces the number of Calculation Items needed. When complete, your first Calculation Group should look like this:
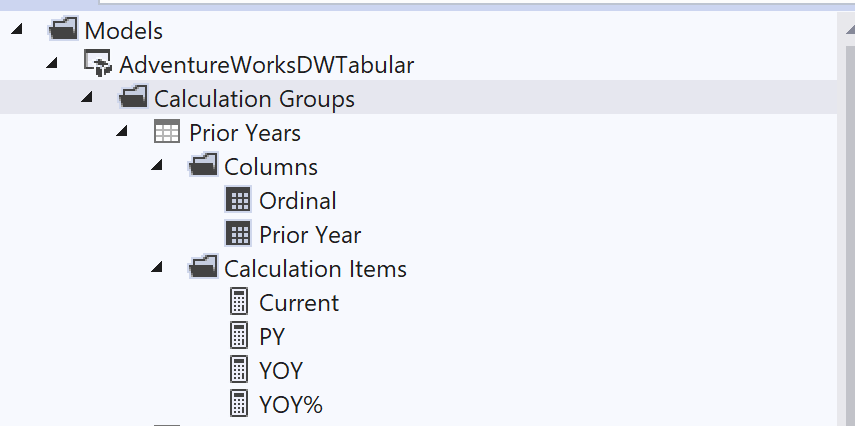
-
-
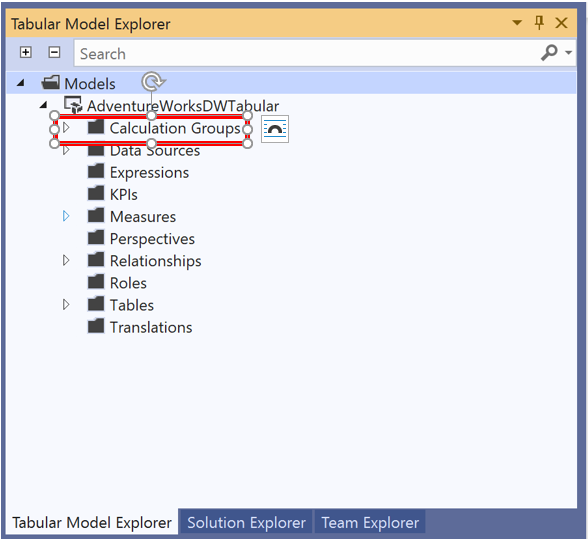
- In Visual Studio 2019, under Models, in the Tabular Model Explorer, you will see a new option for Calculation Groups.

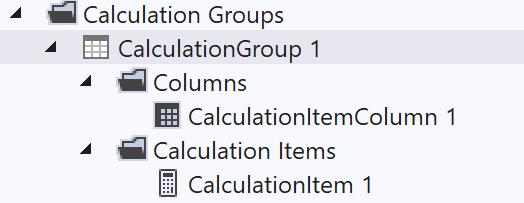
- Right click and chose New Calculation Group. VS will add a new Calculation Group.

- Rename your Calculation Group to Prior Years.
- Rename your Column to Prior Year.
- Right click on Columns add choose Add Column. Rename this column to be Ordinal. Click Hide.
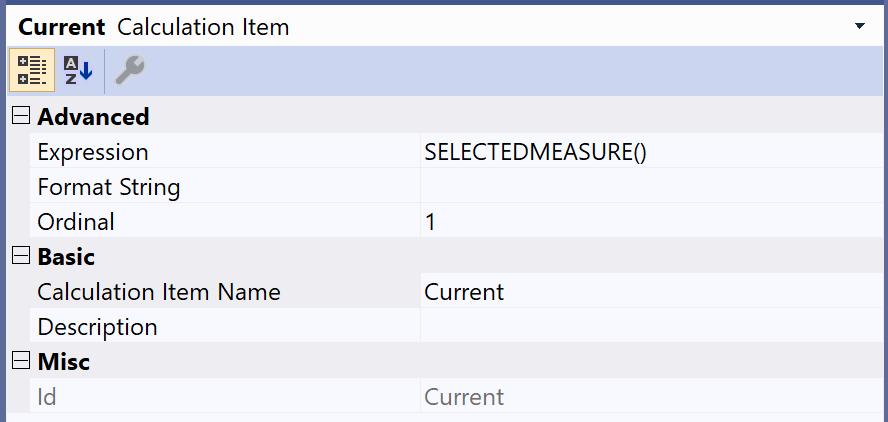
- Rename the first Calculation Item to Current
- For Expression, enter SELECTEDMEASURE()
- Change Ordinal to 1

- Right click on Calculation Items and select New Calculation Item.
- Rename this Calculation to PY
- For Expression, enter:
CALCULATE(SELECTEDMEASURE(), SAMEPERIODLASTYEAR(DimDate[FullDateAlternateKey]))
- Change Ordinal to 2
- Right click on Calculation Items and select New Calculation Item.
- Rename this Calculation to YOY
- For Expression, enter:
VAR CurrentMeasure = SELECTEDMEASURE() VAR PriorMeasure = CALCULATE( SELECTEDMEASURE(), 'Prior Years'[Prior Year] = "PY") RETURN IF(CurrentMeasure = BLANK() || PriorMeasure = BLANK(), BLANK(), CurrentMeasure - PriorMeasure) - Change Ordinal to 3
- Right click on Calculation Items and select New Calculation Item.
- Rename this Calculation to YOY%
- For Expression, enter:
DIVIDE( CALCULATE( SELECTEDMEASURE(), 'Prior Years'[Prior Year]="YOY" ), CALCULATE( SELECTEDMEASURE(), 'Prior Years'[Prior Year]="PY" ) ) - For Format String enter: “0.00%;-0.00%;0.00%”
- For Change Ordinal to 4
- In Visual Studio 2019, under Models, in the Tabular Model Explorer, you will see a new option for Calculation Groups.
-
Add your second Calculation Group
We will now create a calculation group for our Time Aggregations. At the end of this exercise, you will have another calculation group which looks like this:
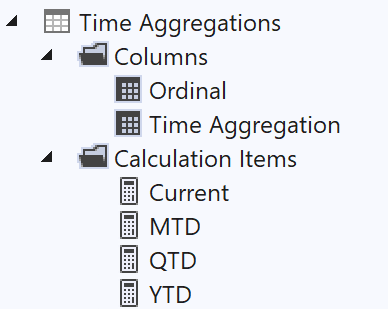
- Create a new Calculation Group called Time Aggregations.
- Rename the column created to Time Aggregation
- Right click on Columns add choose Add Column. Rename this column to be Ordinal. Click Hide.
- Rename the first Calculation Item to Current
- For Expression, enter SELECTEDMEASURE()
- Change Ordinal to 1
- Right click on Calculation Items and select New Calculation Item.
- Rename this Calculation to MTD
- For Expression, enter:
CALCULATE(SELECTEDMEASURE(), DATESMTD(DimDate[FullDateAlternateKey]))
- Change Ordinal to 2
- Right click on Calculation Items and select New Calculation Item.
- Rename this Calculation to QTD
- For Expression, enter:
CALCULATE(SELECTEDMEASURE(), DATESQTD(DimDate[FullDateAlternateKey]))
- Change Ordinal to 3
- Right click on Calculation Items and select New Calculation Item.
- Rename this Calculation to YTD
- For Expression, enter:
CALCULATE(SELECTEDMEASURE(), DATESQTD(DimDate[FullDateAlternateKey]))
- Change Ordinal to 4
Working with Calculation Groups in Power BI Report
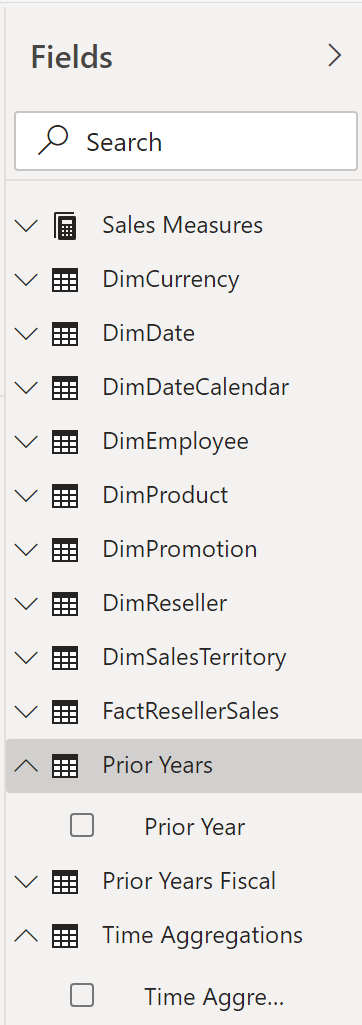
After deploying Visual Studio solution and processing the model, connect to your model with Power BI. You will now see the Calculation Groups in your field list:
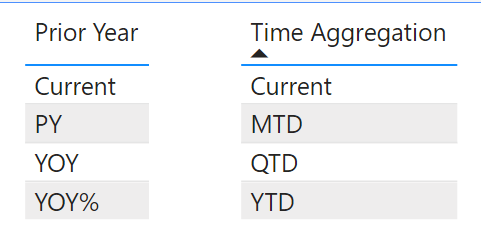
Calculation Item Names display as values for the respective Calculation Group Columns:
Also note how the Sales Measures list remain uncluttered:
Yet I can display the Time Intelligence formulas on 2 cards for all measures. Note how the numeric formatting is displayed correctly without having to specify a format string:
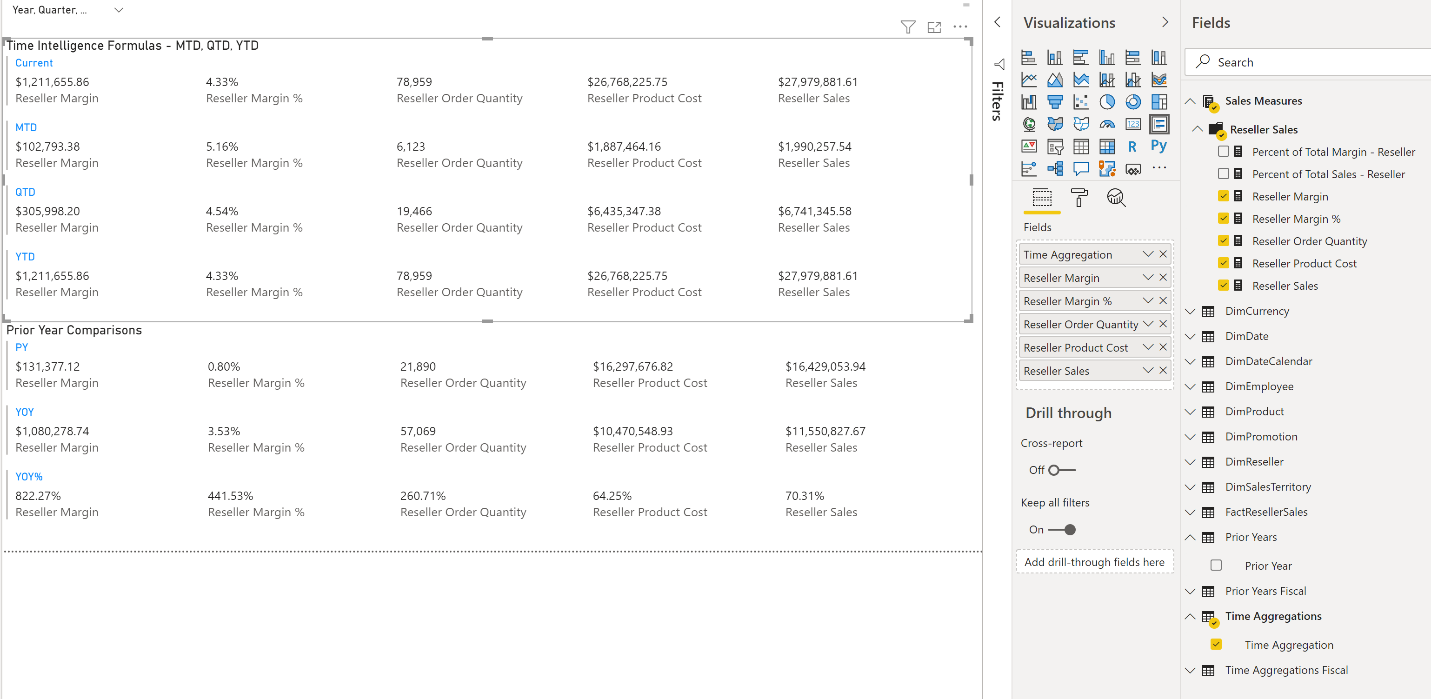
And the best part is, since I created 2 separate Calculation Groups, I can essentially cross join those calculation groups to display Prior Year MTD, QTD, and YTD; YOY MTD, QTD, and YTD, and YOY% MTD, QTD, and YTD in a Matrix.
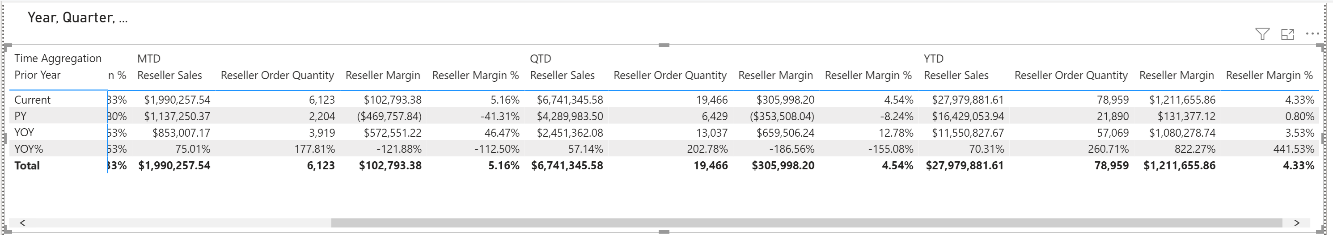 Figure 1 Shows a matrix with Prior Years calculation group on rows, Time Aggregations on columns, and measures Reseller Sales, Reseller Order Quantity, Reseller Margin, and Reseller Margin % as Values.
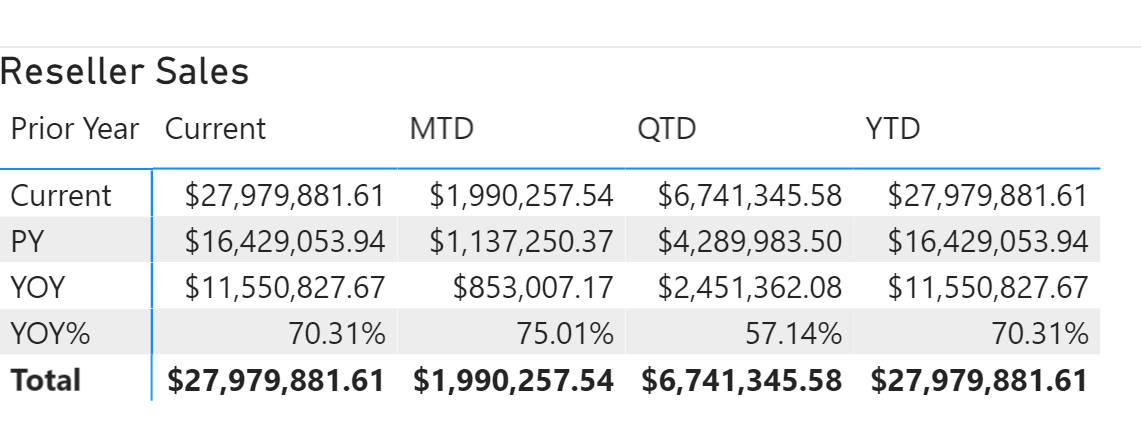 Figure 2 Shows a matrix with Prior Years calculation group on rows, Time Aggregations on columns, and a single measure Reseller Sales.
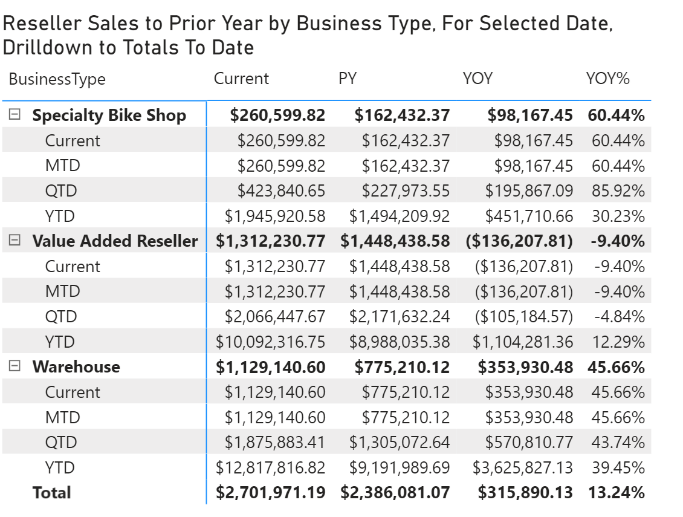 Figure 3 You can also layer with other attribute columns from your model.
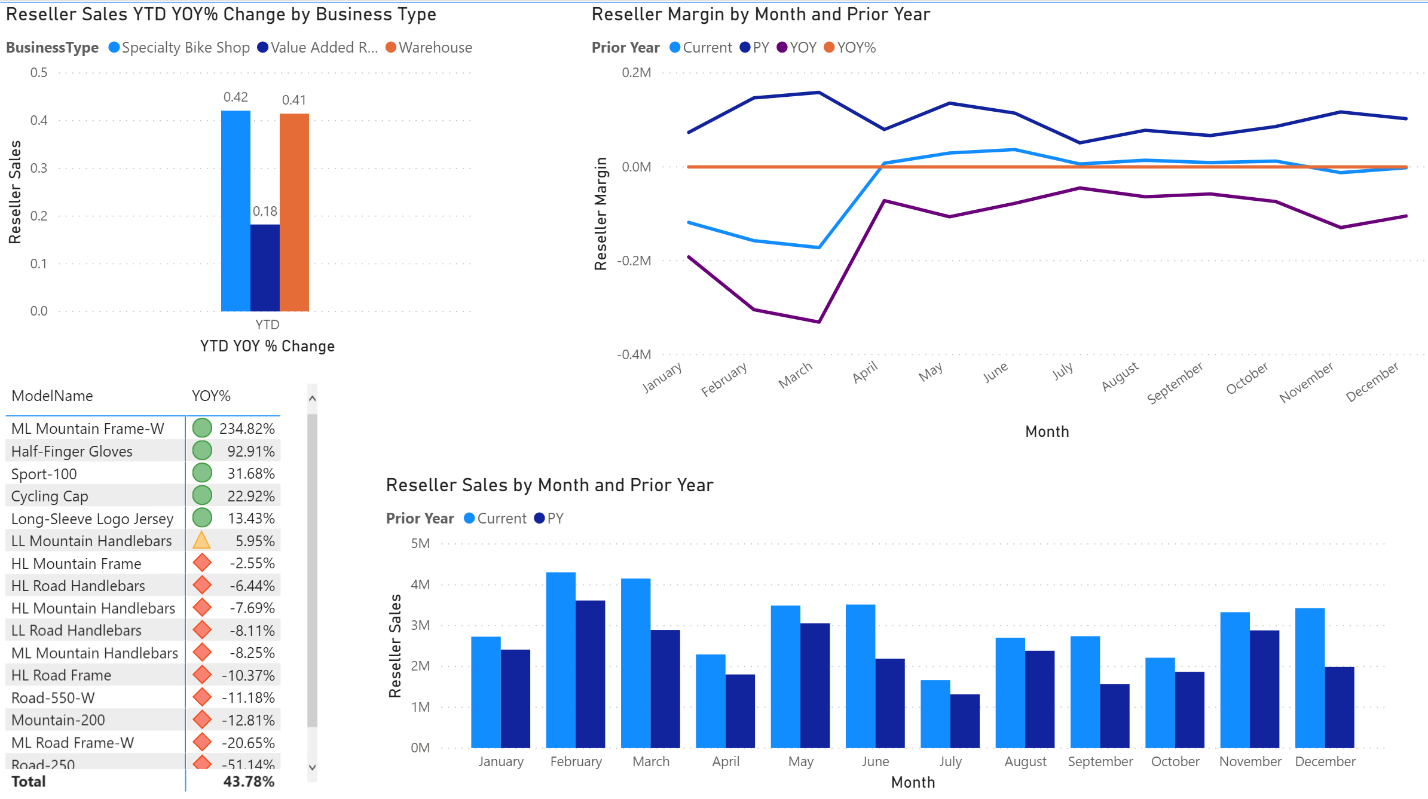
And of course, I can leverage the Calculation Groups in other Power BI visualizations as well:
Summary
Calculation Groups are a very powerful yet easy to use tool to improve usability, provide consistency, and speed up the development process. Now you may say to yourself… this is great for the native Time Intelligence functions for a regular calendar, but what I have fiscal calendars? Stay tuned to Part 2 of this article on how to build calculation groups for Fiscal Calendars!
Additional resources:
- https://docs.microsoft.com/en-us/analysis-services/tabular-models/calculation-groups?view=asallproducts-allversions
- https://docs.microsoft.com/en-us/power-bi/service-premium-connect-tools
 Light
Light Dark
Dark
0 comments