
Angular How-to: Add Application Insights to an Angular SPA
Dev Consultant Laurie Atkinson shows how to add logging and telemetry to an Angular SPA using the latest version of the Application Insights JavaScript library.
Application Insights is an Azure service for monitoring web applications. It includes analytics tools to help you understand application usage and to diagnose issues with the goal of continuously improving performance and usability. In addition to its integration with a variety of backend web platforms, Application Insights also includes browser analytics.
The following steps are specifically targeted at the front-end developers building with Angular and TypeScript that want to start tracking their Single Page Applications.
Step 1 – Add Application Insights to your Azure subscription
- Navigate to portal.azure.com and log in.
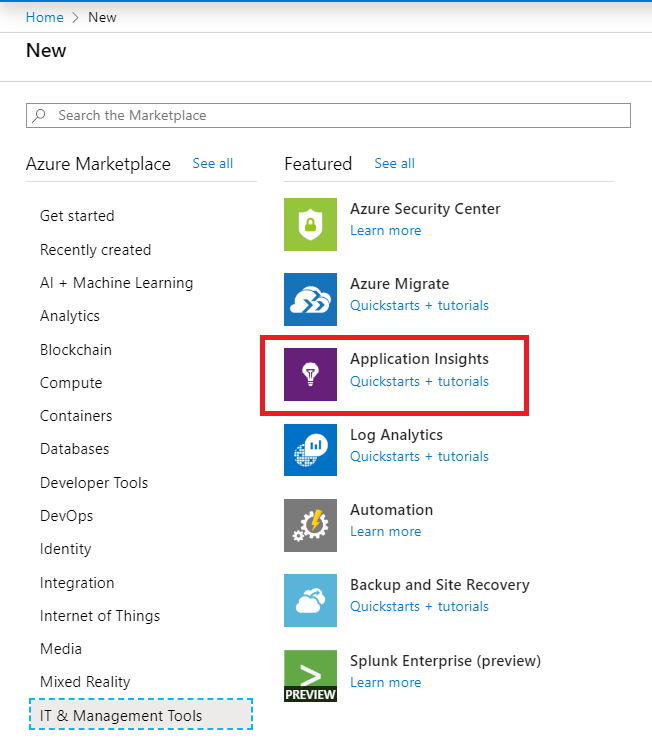
- If an Application Insights resource has not been added yet (or you want to create a new one), select Create a resource

Step 2 – Configure Angular application and include dependencies
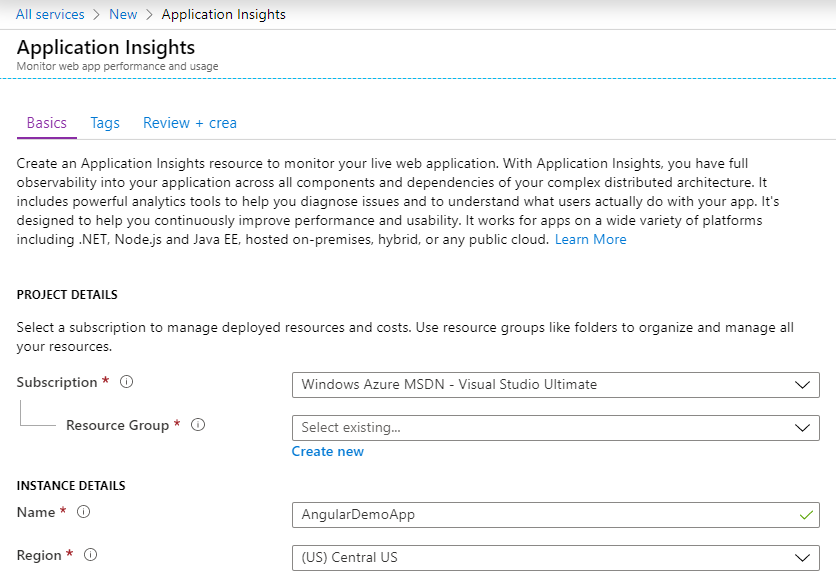
- Copy the instrumentation key into the Angular application. If your app was build using the Angular CLI, then you will have an environment.ts file which is a good place to store the instrumentation key. You may choose another file or service, but this key must be included in your project somewhere.
export const environment = {
    . . .
    appInsights: {
        instrumentationKey: '<your-guid>'
    }
};
- Add a dependency to package.json and restore using npm install. Note: @types are automatically included and no additional dependency is needed.
"dependencies": {
"@microsoft/applicationinsights-web": "~2.4.4",
applicationinsights-web – JavaScript library supplied by Microsoft to interface with the Application Insights SDK. Documentation on this library is located here.
Step 3 – Consume the Application Insights SDK in TypeScript
- Create a TypeScript class as a wrapper around the Application Insights JavaScript API and import the AppInsights class using the module loading system. Include methods for each method in the SDK that you want to support.
logging.service.ts
import { ApplicationInsights } from '@microsoft/applicationinsights-web';

@Injectable()
export class MyMonitoringService {
  appInsights: ApplicationInsights;
  constructor() {
    this.appInsights = new ApplicationInsights({
      config: {
        instrumentationKey: environment.instrumentationKey,
        enableAutoRouteTracking: true // option to log all route changes
      }
    });
    this.appInsights.loadAppInsights();
  }

  logPageView(name?: string, url?: string) { // option to call manually
    this.appInsights.trackPageView({
      name: name,
      uri: url
    });
  }

  logEvent(name: string, properties?: { [key: string]: any }) {
    this.appInsights.trackEvent({ name: name}, properties);
  }

  logMetric(name: string, average: number, properties?: { [key: string]: any }) {
    this.appInsights.trackMetric({ name: name, average: average }, properties);
  }

  logException(exception: Error, severityLevel?: number) {
    this.appInsights.trackException({ exception: exception, severityLevel: severityLevel });
  }

  logTrace(message: string, properties?: { [key: string]: any }) {
    this.appInsights.trackTrace({ message: message}, properties);
  }
- Create an instance of the class defined in step 5 as soon as the application starts in the AppComponent.
export class AppComponent {
    constructor(private myMonitoringService: MyMonitoringService) {
      . . .
    }
Step 4 – Add proper error handling
Although the Application Insights JS code will log all uncaught exceptions it is not a good experience for users to have uncaught exceptions occurring on a page. It is better to catch all exceptions in a global error handler and manually call the trackException() method.
- Add a custom error handler.
@Injectable()
export class ErrorHandlerService extends ErrorHandler {

    constructor(private myMonitoringService: MyMonitoringService) {
        super();
    }

    handleError(error: Error) {
        this.loggingService.logException(error); // Manually log exception
    }
}
- Instruct the module to use the custom error handler.
@NgModule({
  providers: [
    { provide: ErrorHandler, useClass: ErrorHandlerService }
Step 5 – View the results in the Azure Portal
The included App Insights JavaScript library will automatically send metrics to Application Insights. To view the exceptions, navigate to the Failure menu and choose the Exceptions tab. Make sure to toggle to Browser in the top righthand corner. 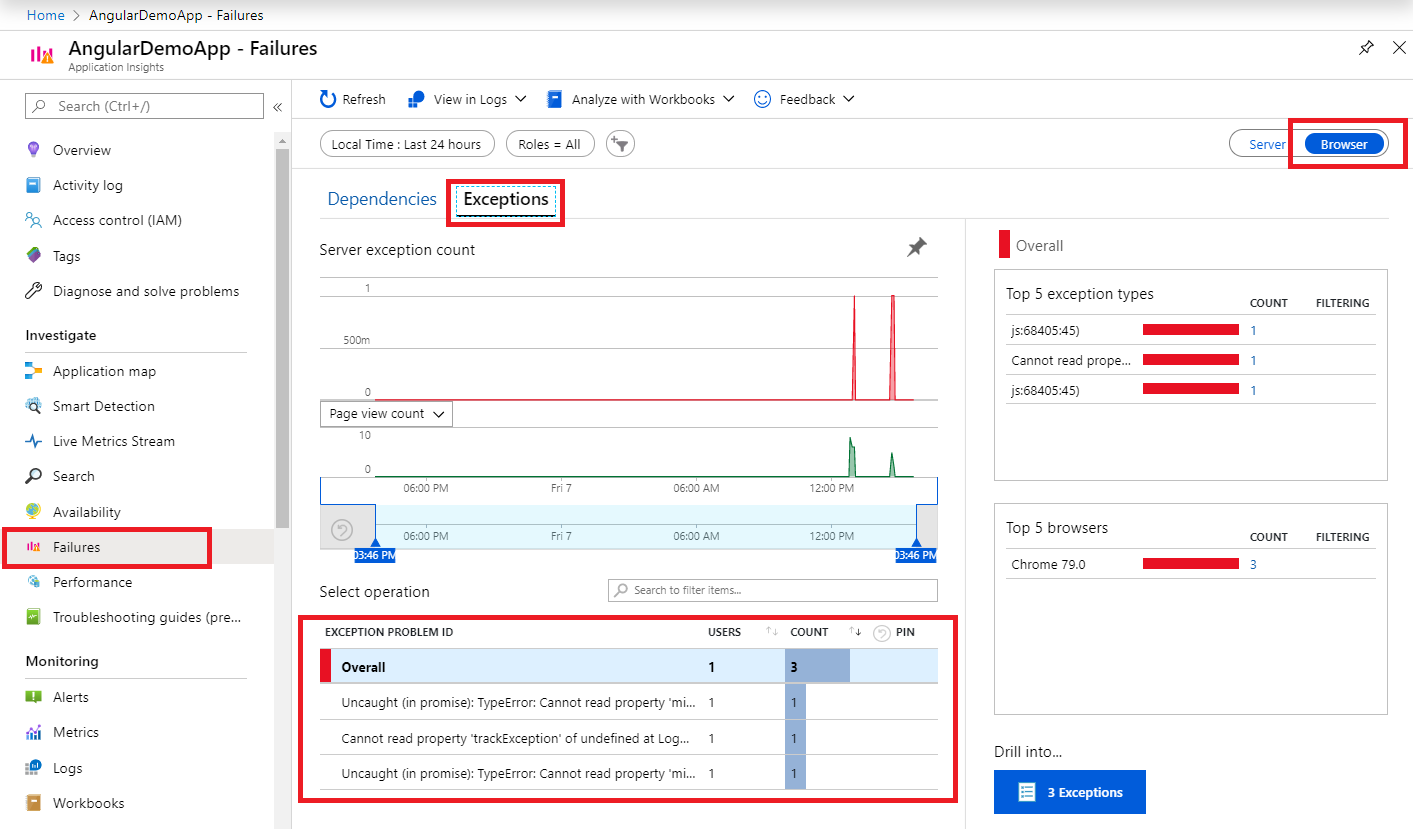
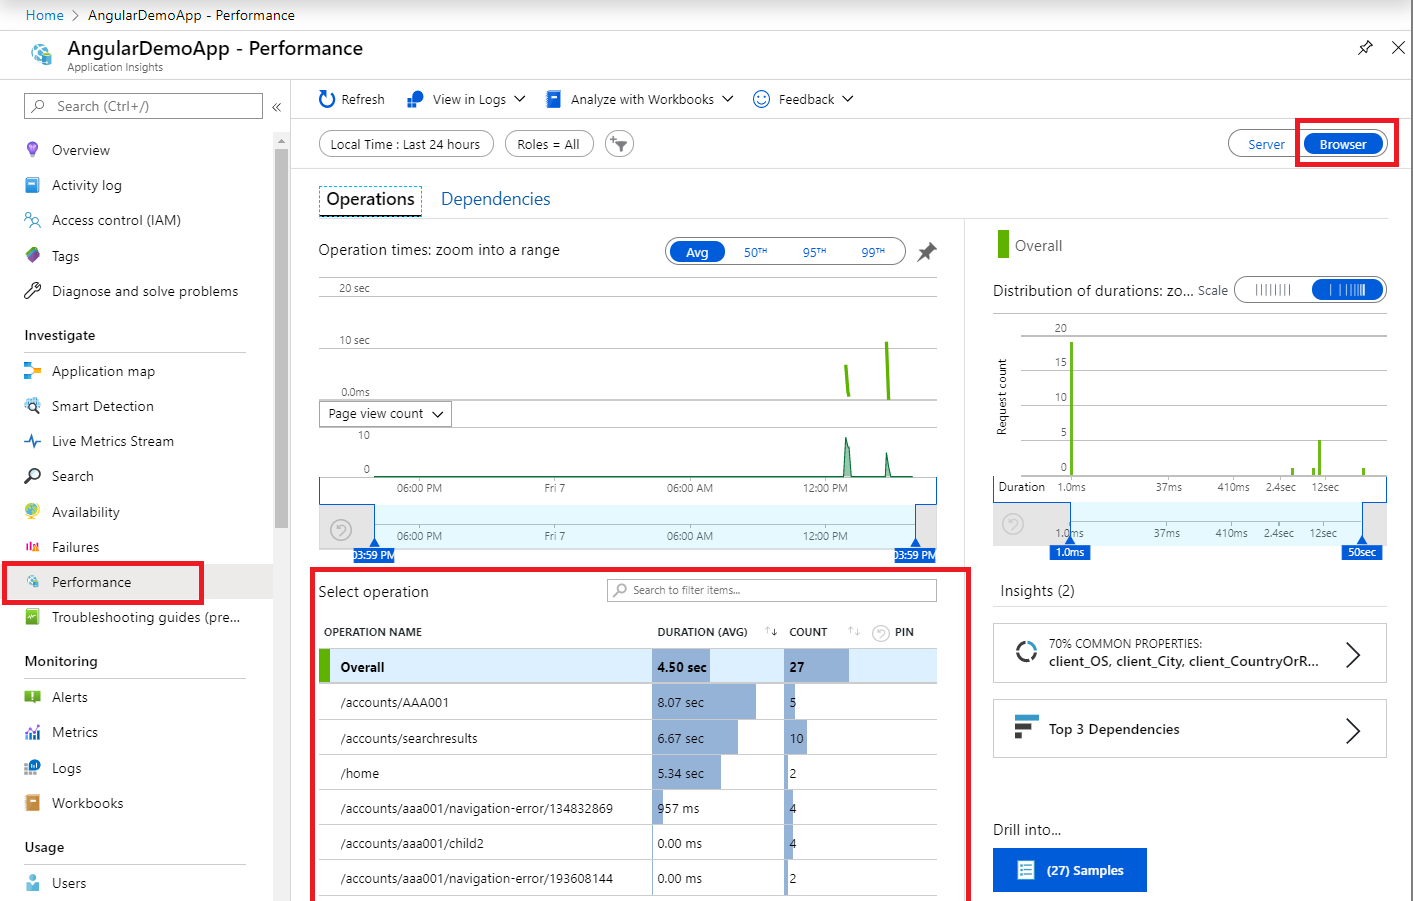
Page views can be found under the Performance menu item.
Using dynamic configuration data
Note that this post uses a hard-coded instrumentation key. Angular does provide the option to store config values in different environment.ts files, but these values are still bundled inside JavaScript code. If you need to obtain the instrumentation key from a config file separated from your code, then you can refer to this demo application. You can find an explanation for downloading a JSON configuration file here. The primary modification you need to make is to move the creation of the ApplicationInsights instance to the AppModule and use the APP_INITIALIZER to ensure it is created as soon as the app starts and therefore before any calls are made to App Insights.
References:
https://devblogs.microsoft.com/premier-developer/angular-how-to-editable-config-files/
https://github.com/laurieatkinson/ng-patterns-demo
 Light
Light Dark
Dark
4 comments
Awesome post!
In step 4 I think you meant to write:
Hi,
First of all thanks for the post. The logging works fine so far. But while implementing I faced a problem with the testing of my components. Basically every component which is declared by the module providing the Error Handler, has failing test with the same error:
        Error: Timeout - Async function did not complete within 5000ms (set by jasmine.DEFAULT_TIMEOUT_INTERVAL)
            at
Does anyone have an idea why this happens?
Hi, great post and worked fine on my local, but once deployed to azure, I am getting the following console error. Any ideas?
Under step 3, this is not correct:
environment.instrumentationKey
It is under
environment.appInsights.instrumentationKey
Also under step 3, you are missing the closing ‘}’