
A How-To Guide For pssdiag and SQL Nexus: Creating a pssdiag Package
In this post, Sr. Consultant Kendal Van Dyke explores pssdiag and SQL Nexus, free tools from Microsoft that help you capture and analyze SQL Server performance data.
This is part 2 in a series of blog posts about pssdiag and SQL Nexus, free tools from Microsoft that help you capture and analyze SQL Server performance data.
The previous blog post provided a general overview the process for using pssdiag and SQL Nexus. In short, the steps are:
- Step 1: Create a pssdiag package
- Step 2: Run pssdiag capture
- Step 3: Import into SQL Nexus
- Step 4: Reporting/Analysis
This blog post covers Step 1: Creating a pssdiag package. As a reminder, this step runs on the SQL Nexus Server.
Creating a pssdiag package
The first step to running a pssdiag capture is to create a pssdiag package using the Pssdiag Configuration Manager. Start by downloading the latest release from Github. There is no installer; simply extract the contents of the ZIP file and double click DiagManager.exe to launch the utility.
Enter Instance Information
First, enter the source server’s machine name, instance name, platform, and version of SQL Server:
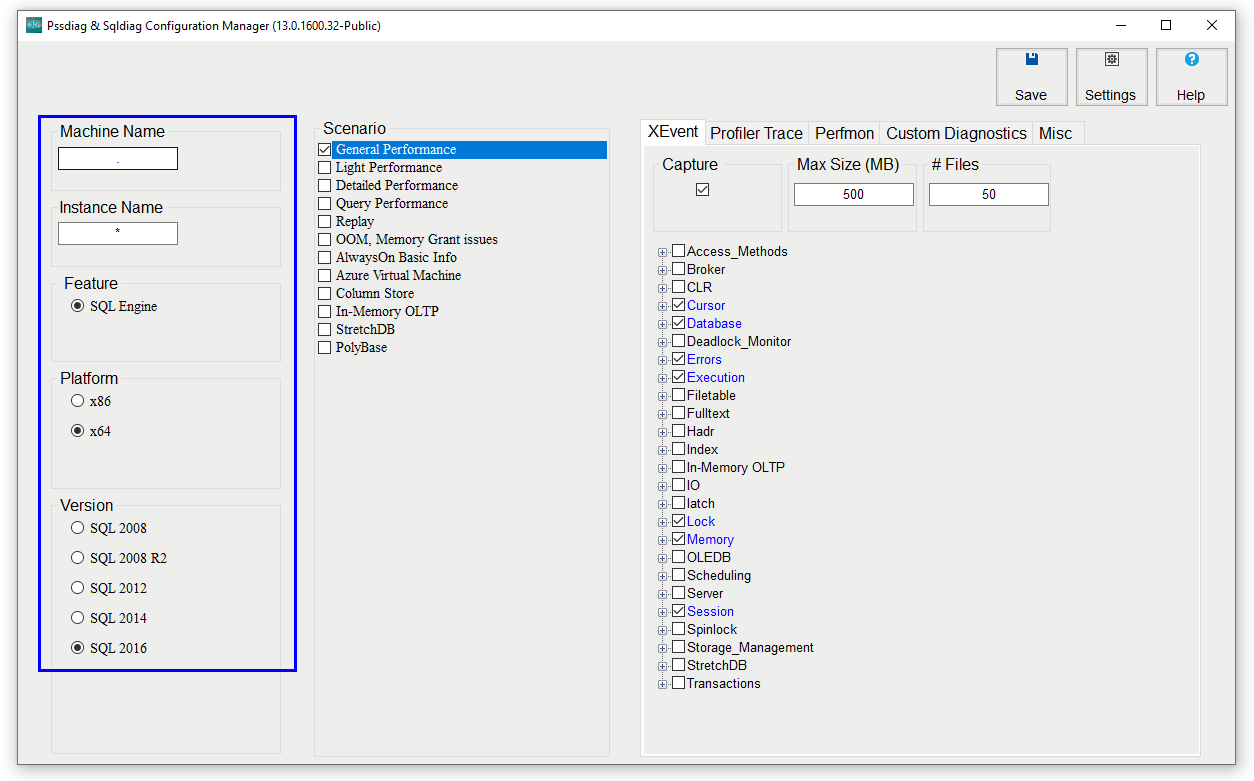
Use the following charts to determine which values to use for Machine Name and Instance Name based on where you plan to run pssdiag:
Standalone Instance
| pssdiag location | Machine Name | Instance Name | Instance | Notes |
| SQL Server | . | * | All | |
| mssqlserver | Default | |||
| {instance name} | Named | |||
| Remote machine | FQDN for SQL Server | * | All | Trace\Xevent data written to local disk on SQL |
| mssqlserver | Default | |||
| {instance name} | Named |
Failover Cluster Instance
| pssdiag location | Machine Name | Instance Name | Instance | Notes |
| Active Node | . | * | All | Captures data from all nodes (this may capture more than intended!) |
| mssqlserver | Default | |||
| {instance name} | Named | |||
| SQL Server Network Name | * | All | ||
| mssqlserver | Default | |||
| {instance name} | Named |
Note: pssdiag should always run on the active node for Failover Cluster Instances
Choose Scenario(s)
Next, select one of more checkboxes in the Scenario section. Enabling a checkbox turn on different options in the tabs to the right of the screen. Scenarios can be combined to capture more events.
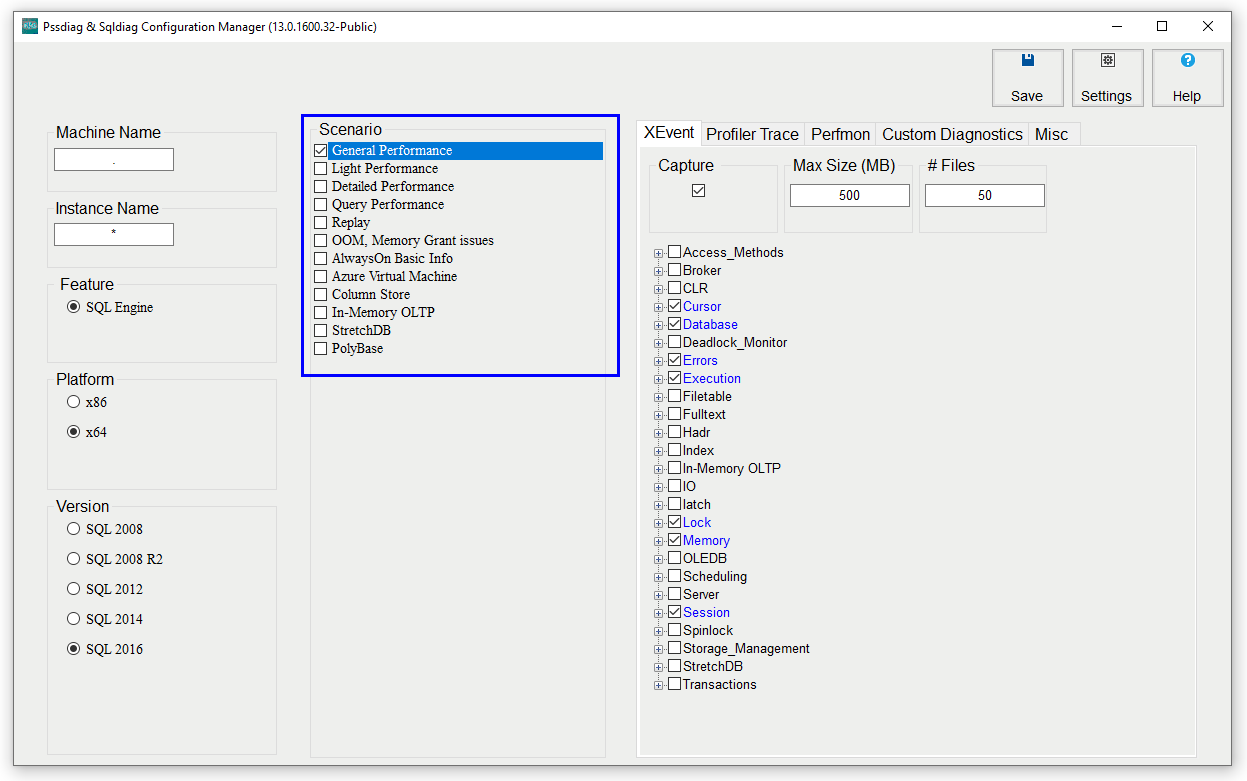
If you’re not sure where to start, General Performance is usually a good place. This will enable an Extended Events Session or Profiler Trace (depending on what version of SQL you’re targeting) capture of batches and RPC calls (+ additional events), perfmon counters related to SQL Server and Windows, and scripts which capture snapshots of DMVs and query activity.
Customize What to Capture
After selecting one or more scenarios, you can enable or disable capture of specific events by using the tabs on the right side of the screen.
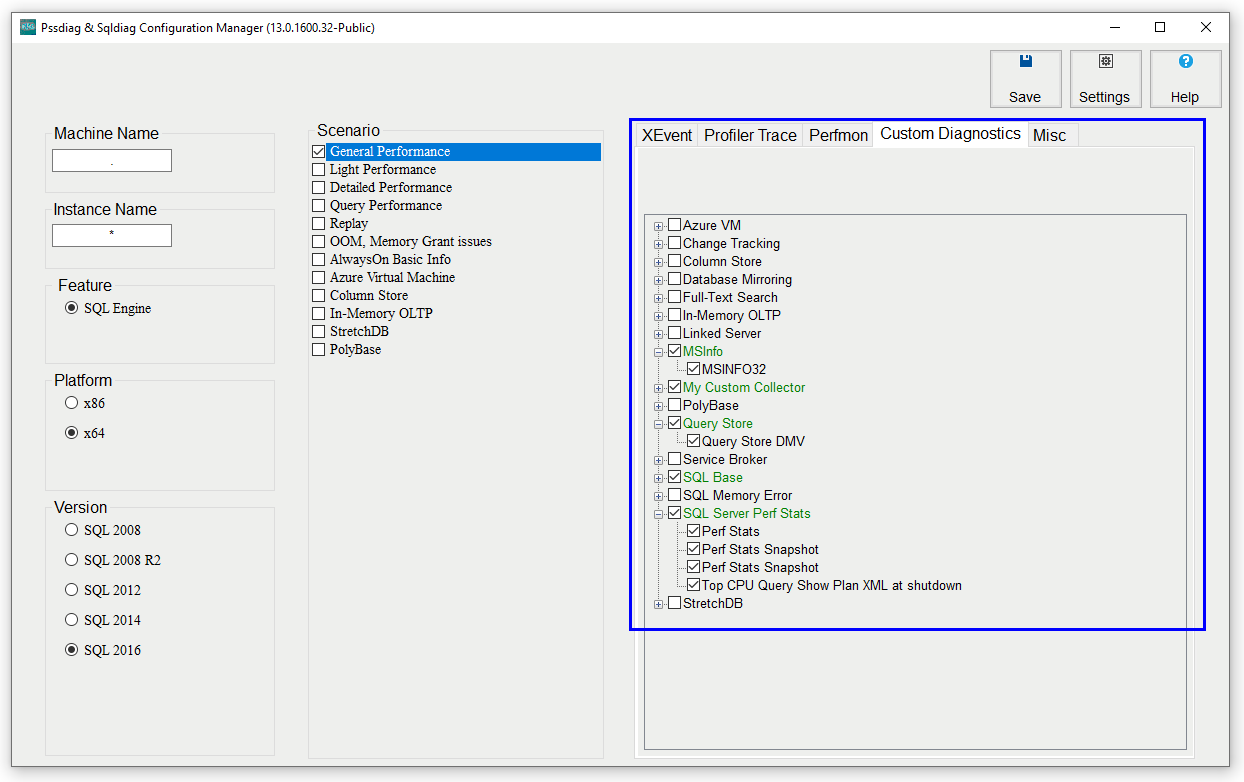
*Important*: If you’re not familiar with what each scenario does, make sure to pay close attention to what’s enabled – some pssdiag scenarios can add a lot of overhead on an instance and potentially bring things to a screeching halt. Before running pssdiag against a production instance, try a test run on a non-production system so you know what the capture configuration you’re creating does to performance.
Tip: For an extended duration (e.g. 1 hour or more) capture of pssdiag a good starting place is the “General Performance” scenario plus these customizations:
- UNCHECK the capture checkboxes on the XEvent and Profiler Trace tabs.
- On the perfmon tab change the polling interval to 20 seconds.
- Leave everything else at the defaults
Save Capture Configuration
Click the save button and save your pssdiag package as a .ZIP file.
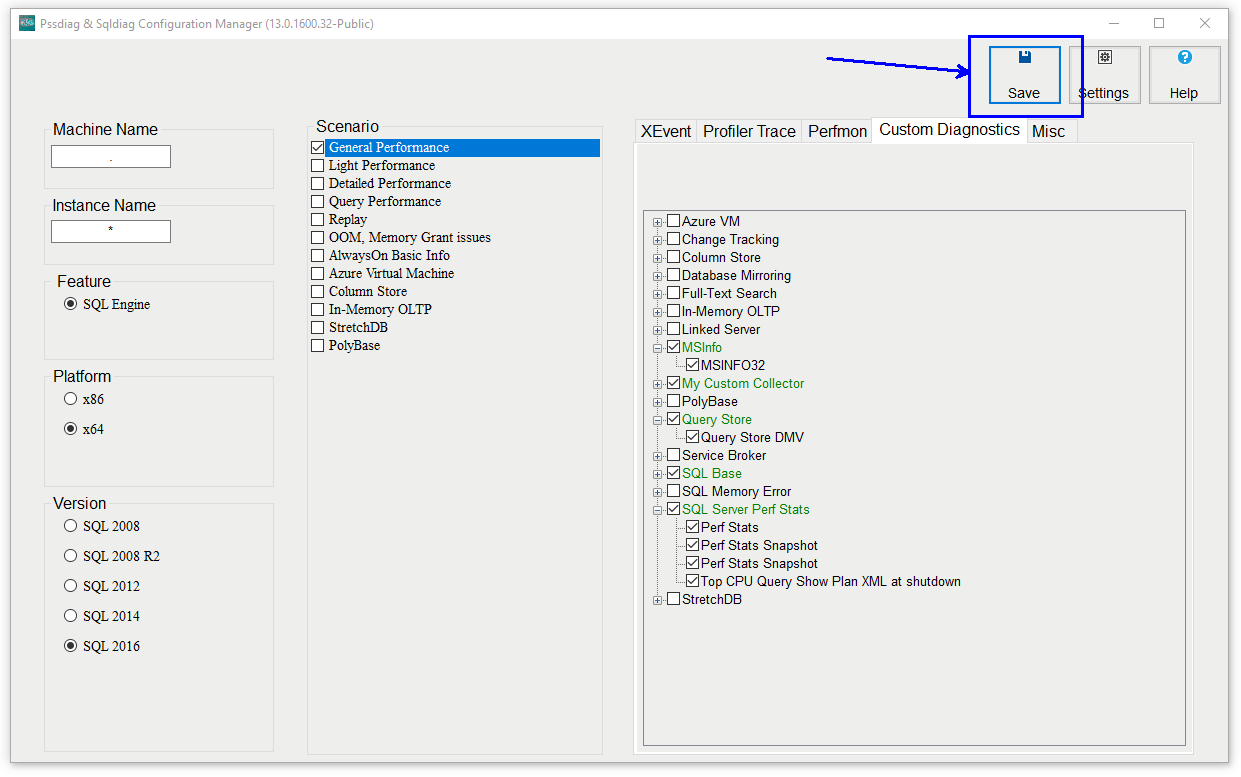
This completes the pssdiag package configuration steps.
Next: Run pssdiag capture
The next blog post in this series will cover how to run the pssdiag package you’ve configured to capture SQL Server and Windows performance data.
 Light
Light Dark
Dark
0 comments