
Windows PowerShell Script Workflow Debugging
Script workflow debugging support is one of two major script debugging enhancements added in Windows PowerShell 4.0. The other new feature is script debugging in remote sessions, which is described in “Windows PowerShell Remote Debugging”.
We introduced script workflow in Windows PowerShell 3.0. These are workflows written in the Windows PowerShell language that are compiled into XAML and then run in Windows Workflow Foundation. There is a subset of Windows PowerShell cmdlets that can be called inside a workflow and are executed as special Windows PowerShell workflow activities when the workflow runs. For a nice introduction to Windows PowerShell workflows see: PowerShell Workflows: The Basics and Getting Started with Windows PowerShell Workflow.
Your only real option for debugging script workflows in Windows PowerShell 3.0 was to look at trace output and add Write-Debug and Write-Verbose statements to your script workflow (Debug or Troubleshoot a Workflow). But in Windows PowerShell 4.0, we now allow you to set line breakpoints in script workflows. When you hit a breakpoint the execution of the next workflow activity is paused, allowing you to see the current point of workflow execution and examine variables, in much the same way that normal Windows PowerShell script debugging works. You don’t need to know anything about the intermediate XAML code that was generated for you that runs the workflow. We map execution of the activity back to the original script workflow you created so you can debug those script statements and forget about the XAML.
Script workflow debugging is integrated into Windows PowerShell’s script debugger so that the experience is as similar as possible to normal Windows PowerShell script debugging. You can add, remove, enable, and disable line breakpoints in script workflows and those breakpoints will halt the activity execution that corresponds to the script statement. You can also step into, out of and through workflows from Windows PowerShell script.
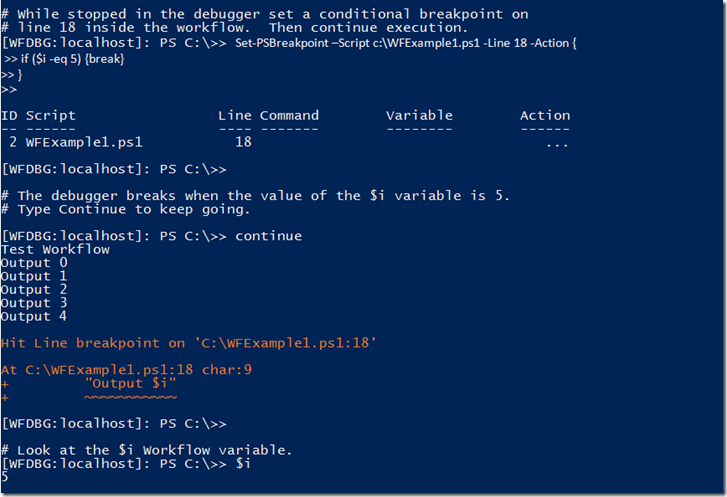
Script workflow debugging supports line breakpoints, but it does not support command or variable breakpoints. Conditional line breakpoints are supported by using the Action parameter in the line breakpoint. The value of the Action parameter is a script that is evaluated when script execution reaches the line. The Action parameter script uses the ‘break’ keyword to stop script execution at that point. For example a simple line breakpoint Action script could be:
if ($count -eq 5) { break }
Script execution will stop at the line breakpoint when the $count variable is equal to 5.
Workflow debugging is fully supported in Windows PowerShell ISE, as well as in the Windows PowerShell console.
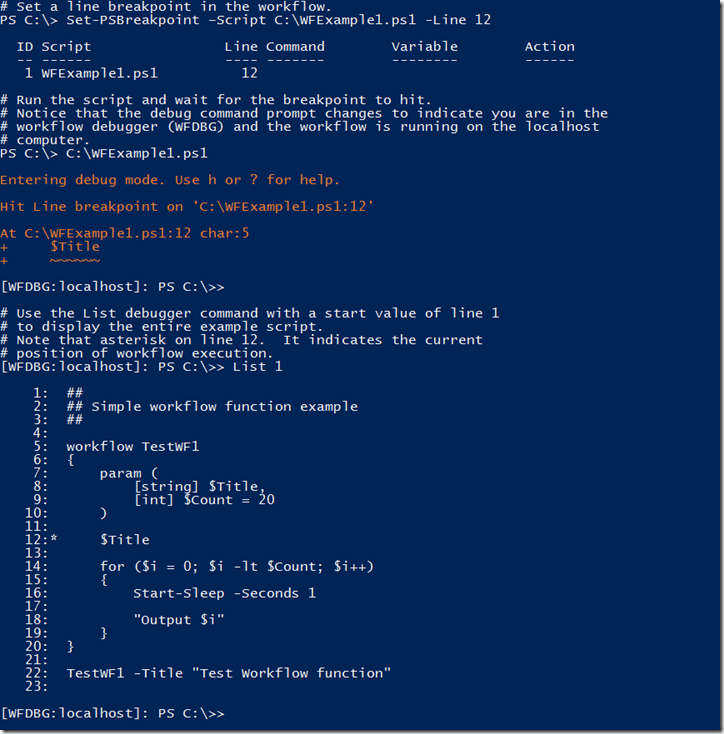
Example 1: Debugging a workflow
In this example, I’ll show you some basic tasks in debugging a script workflow. We’ll set a line breakpoint and, at the breakpoint, we’ll display the statements that are executing and set a new conditional breakpoint. In this example we use the WFExample.ps1 script, which contains a workflow and a command that calls the workflow.
There are some limitations to workflow debugging.
· Nested workflow debugging is not supported. You cannot step into a workflow that’s being called by another workflow. Breakpoints set in a nested workflow will not be hit.
· You cannot debug Windows PowerShell activities as they execute.
· You can get the value of workflow variables, both built-in and created by assignment expressions, at a debugger stop. (To see the value of any variable, type the variable name or use the Get-Variable cmdlet at the debugger prompt). However, you cannot set a workflow variable at the debugger prompt, like you can when debugging a standard (non-workflow) script.
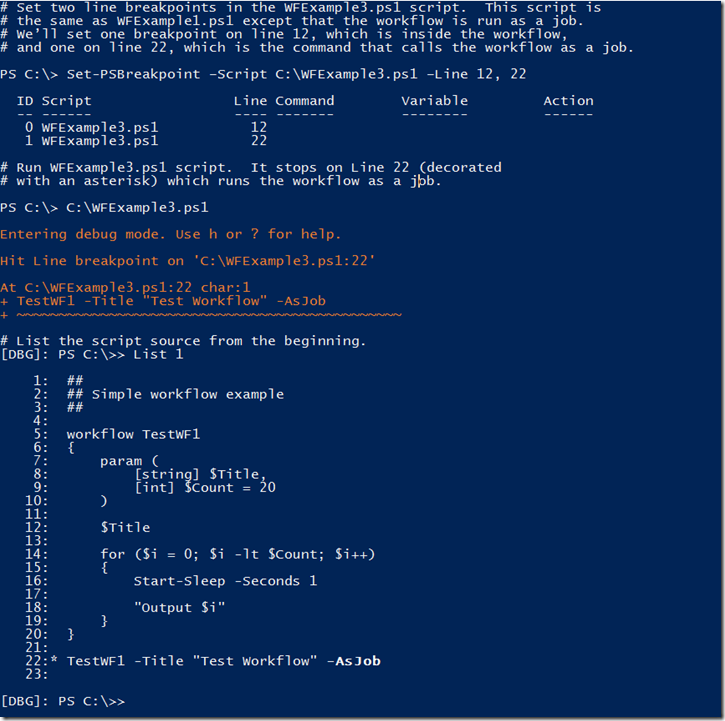
· You cannot debug a script workflow that runs as a job. (To run a workflow script asynchronously as a Windows PowerShell workflow job, use the AsJob common parameter of script workflows). To debug, remove the AsJob parameter from your script temporarily, and put it back when you’re finished debugging.
Example2: Run a Script Workflow as a job

Debug script workflows on remote machines
In the previous post I showed how to debug scripts running on remote machines. In this post, I have shown how to debug script workflows. Now I’ll put the two together to show how to debug script workflows on remote machines.
For remote debugging both client and remote machines must be running Windows PowerShell 4.0. Remote debugging is supported only in the Windows PowerShell console and not in Windows PowerShell ISE.
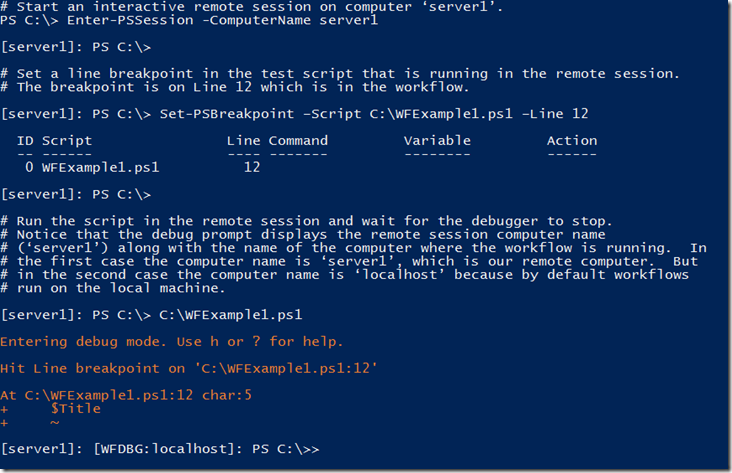
Example 3: Debugging a workflow in a remote session
In this example we’ll debug the workflow in the WFExample1.ps1 script. But, unlike our first example, the script is running in a remote session.
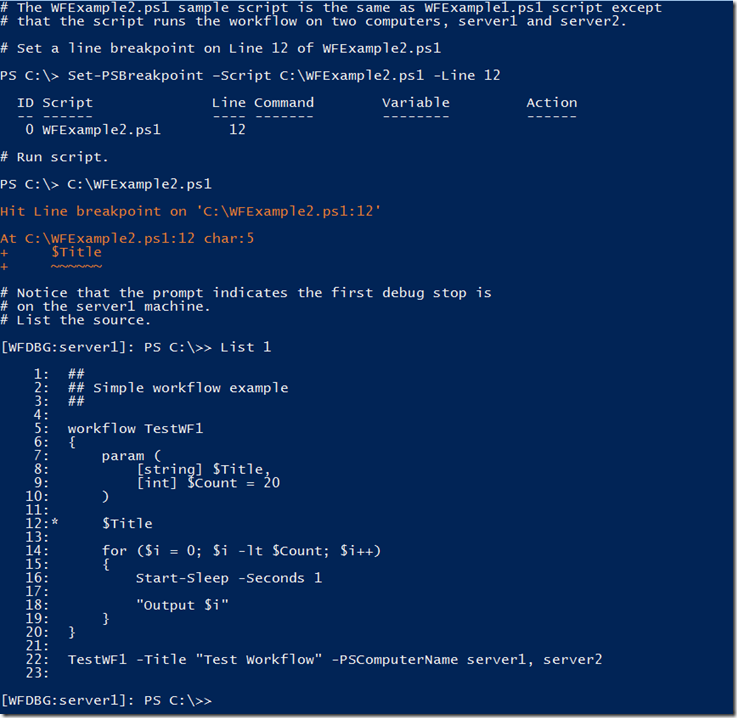
Example 4: Debugging workflow script on multiple remote machines
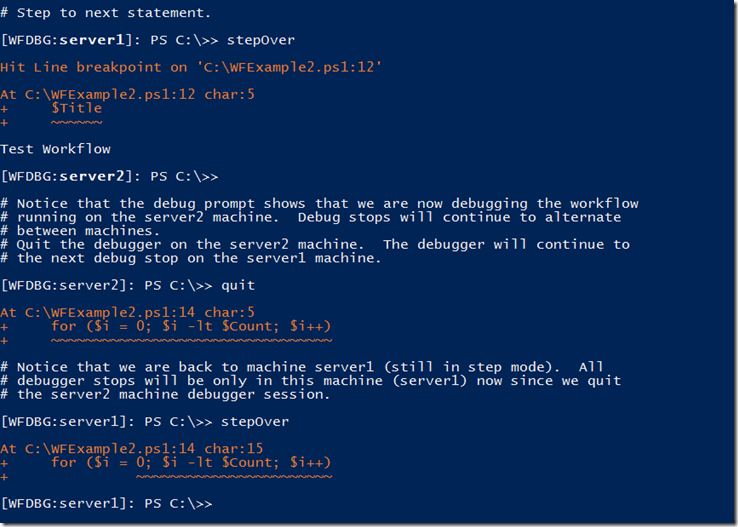
You can run workflows on remote machines. By default they run on the local machine, but you can specify one or more remote machines by including the –PSComputerName common parameter. Underneath the covers Windows PowerShell is using its job infrastructure to run the workflow on the remote machines. The workflow debugger handles all of this and modifies the command prompt when you are stopped in the debugger to indicate the machine that the debug stop pertains to. In addition the workflow debugger supports debugging workflows on multiple machines simultaneously. In this case, the debugger stops (whether due to a breakpoint hit or step action) alternate between machines in the order that the debug stop events arrive at the debugger.
Script workflow debugging is a powerful new feature that lets you debug workflow script in both local and remote PowerShell sessions. With its integration with PowerShell’s script debugger, it gives you a much improved and seamless way to debug your script workflows.
Paul Higinbotham [MSFT] Windows PowerShell Development
 Light
Light Dark
Dark
0 comments