
Optimizing your $Profile
Optimizing your $Profile
Your PowerShell Profile allows you to customize your PowerShell session and runs at startup. Complex profiles can cause a significant delay in the startup of PowerShell as it is a script that needs to be executed before the prompt first shows up.
Spoiler: I’ll show how I got my profile loading time from 1465 ms to 217 ms!
It’s important to note that many of the optmizations I cover here are micro-optimizations. They won’t have significant overall impact and, in general, may not be the best way to write your scripts. In the case of a profile, I’m optimizing for speed and, in some cases, making the script slightly harder to read as a tradeoff. For production scripts used in automation, the micro performance improvement may not be worthwhile as maintainability of the script may be more important.
Using GitHub to store my profile.ps1
As part of working on PowerShell on GitHub, I have a macBook Pro, a Windows desktop, and also a Linux desktop I use frequently. I like to keep my PowerShell environment customizations in sync across these devices without having to manually update the profile should I make changes. The solution I decided upon was to publish my profile as a GitHub Gist.
NOTE: that the current version on GitHub contains all the optimizations covered in this blog post, you can look at the revisions on GitHub to see how my profile has changed over time. I would NOT recommend using my profile directly as I may make changes that break you or are not applicable to your daily usage of PowerShell. Use it more as an example.
The key parts of the code that does this is a ThreadJob that makes a REST call to GitHub to retrieve the latest version of my profile and compare with the current version. Creating the ThreadJob does take time, but because I’m making a networking call which can lead to variable execution time, it’s a worthwhile tradeoff. Also, because that scriptblock is running as a separate thread from the main startup thread, I don’t have to worry about performance optimizations of that ThreadJob scriptblock.
My profile contains a # Version x.y.z comment near the top of the script and this version string is used to determine if the one on GitHub
is newer than the one that’s currently running.
A regular expression is used to parse this from the profile.
If the ThreadJob determines there is a newer version, it saves that version string to a file that I can easily check at the start of my profile.
At the start of my profile, I check the current loaded version against this file and will prompt to install the latest version if there is one.
This means that on startup, I won’t know that a newer version exists until the next startup, but it’s a worthwhile tradeoff.
Getting a baseline for pwsh
Before we start making changes, we want to get a baseline so we know what impact, if any, our changes are affecting the startup performance.
I wanted to separate the startup time of pwsh itself from the execution of my profile.
I got an average startup, in milliseconds, for pwsh starting up without loading any profile.
Here I use the Measure-Command cmdlet to make this easy. However, I do a loop of 100 times to make sure any variance of my computer are accounted for and calculate the average time:
$p = 0
1..100 | ForEach-Object {
    Write-Progress -Id 1 -Activity 'pwsh' -PercentComplete $_
    $p += (Measure-Command {
        pwsh -noprofile -command 1
    }).TotalMilliseconds
}
Write-Progress -id 1 -Activity 'profile' -Completed
$p = $p/100
$p
I’m using the variable $p to store the result as I want to subtract that time from my profile measurements.
Since running this 100 times can take some time, I like to know how far it’s progressed, so I’m using Write-Progress as a visual indicator of
how many more need to be run.
Since the writing of progress is not in the scriptblock used by Measure-Command, it has no impact on the measured time.
pwsh -noprofile -command 1 will ensure that when PowerShell starts, it doesn’t load my profile, and the command 1 simply has PowerShell
emit the number 1 and exit.
For my baseline, I got a time of 1176 ms for the startup of pwsh.
Getting a baseline for my profile
To get the average start time of my profile, the script is quite similar:
$a = 0
1..100 | ForEach-Object {
    Write-Progress -Id 1 -Activity 'profile' -PercentComplete $_
    $a += (Measure-Command {
        pwsh -command 1
    }).TotalMilliseconds
}
Write-Progress -id 1 -activity 'profile' -Completed
$a/100 - $p
The only major difference here is not using -noprofile so that my profile is loaded and also subtracting the startup time of pwsh $p from the result.
I got a time of 1465 ms for the startup of my profile.
Measure-Script
Mathias Jessen published a great profiling tool for scripts called PSProfiler that I decided to use against my profile to see which lines were taking the most time.
The module doesn’t require PowerShell 7, but if you use it with PowerShell 7.2, then you get some coloring to help identify the top lines that are taking the longest execution time:
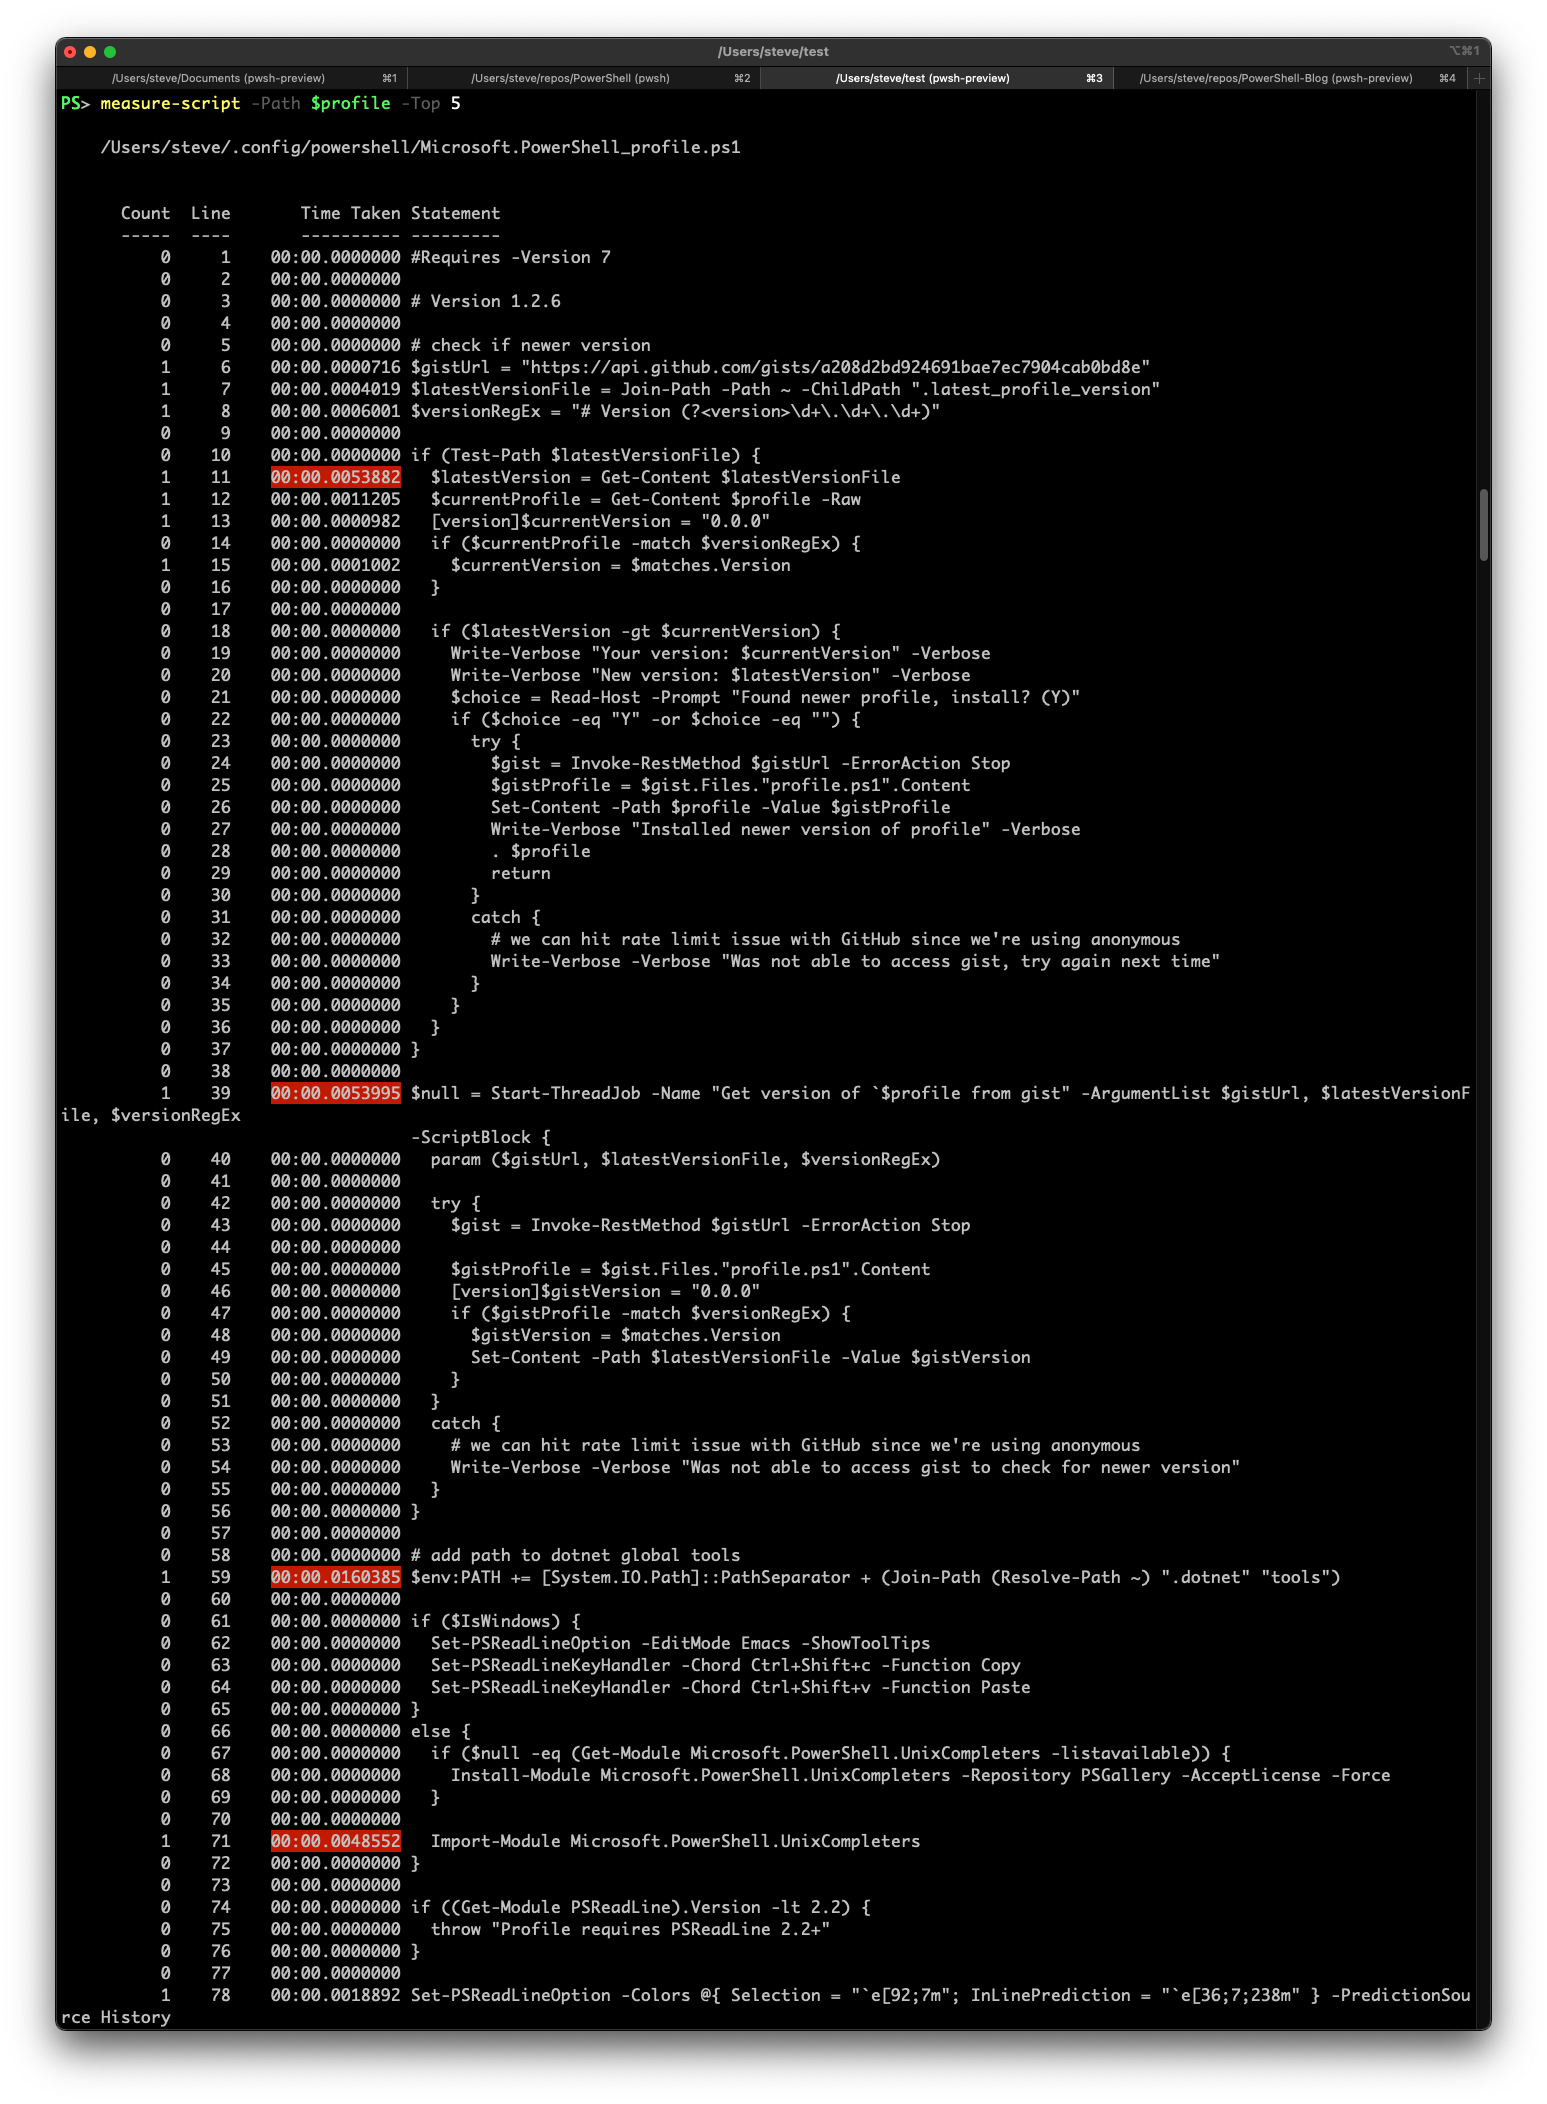
This screenshot shows a few lines I should focus on optimizing first. At the top, you can see that reading contents of a file was identified as a performance hot spot.
Get-Content
One thing that is not obvious is that when you use the Get-Content cmdlet, it will add some additional note properties to the output identifying
the original source of the content.
For my usage in the profile, I have no need for this metadata.
The cmdlet has a -ReadCount parameter that specifies how to batch lines sent through the pipeline.
However, it also tells the cmdlet not to add the additional source information note properties.
Since I’m not using the pipeline to process the contents, using -ReadCount 0 will help avoid incurring the cost of the cmdlet adding the note properties.
This saved a very tiny amount of milliseconds although a good percentage improvement.
Using Get-Content $profile -Raw was 0.807888 ms, Get-Content $profile -Raw -ReadCount 0 was 0.651742 ms.
Instead of relying on the cmdlet, I could simply call the equivalent .NET API directly.
Since I’m not using the features of the cmdlet and simply getting the contents of the file, I could use [System.IO.File]::ReadAllText($profile) which took 0.185826 ms.
Now this is a much more significant improvement.
Also, these measurements were taken when the Get-Content cmdlet from the Management module was already loaded.
So for profile startup where the module is not loaded, this would be even more significant.
Changing cmdlets to using .NET APIs
Using cmdlets can make writing scripts much easier and potentially easier to read. However, there is a startup time impact of loading the module (which itself is a series of complex steps), having the cmdlet process the input, and finally wrapping the result in a PSObject and emitting to the pipeline. Since my profile was not using any of the advanced capabilities of many cmdlets, I proceeded to change most of my cmdlet usage to .NET APIs.
In the screenshot, you can see that cmdlets like Join-Path and Resolve-Path are another line that is relatively slow and my profile uses these two cmdlets quite often.
Join-Path can be replaced by [System.IO.Path]::Combine().
I was using Resolve-Path ~ as Windows doesn’t understand that the tilde is supposed to point to the user’s home directly.
However, PowerShell already has a $HOME variable for that purpose, so I simply removed the use of Resolve-Path and used $HOME directly instead.
Taking another measurement
With all the changes from using cmdlets to .NET APIs, I was able to drop the start time to 1404 ms from 1465 ms. This was pretty good for minimal work, but not enough of an improvement that I would notice on a daily basis.
Using Measure-Script again, I can see that the new hot spots were with Get-Command to see if some commands were available before doing some work.
There isn’t an equivalent .NET API to Get-Command, however, I could just try executing a command or cmdlet and catch the CommandNotFoundException.
Get-Command import-foo -ErrorAction Ignore takes about 15.8 ms.
However, try { import-foo } catch [System.Management.Automation.CommandNotFoundException] { } only takes about 10 ms.
With a few more changes I would also be reduce the profile start time to 1360 ms. This was about a 100 ms improvement, but still not something I would notice on a daily basis. To make an improvement that was noticeable I needed to take a different approach.
A new hope
It occurred to me that lots of the script I had in my profile were only ever intended for when I used PowerShell interactively.
This includes customizations to PSReadLine, ensuring dotnet was in my path, creating PSDrives as shortcuts to my test folder and git folders.
So the big change was to move all of that into a new private function called Initialize-Profile.
I would then update my prompt function to check if this function was ever called and if not, then call it to complete setting up my environment.
This meant that the majority of the script was moved to Initialize-Profile which was only ever run if there was an interactive prompt.
With this change, my profile startup reduced to 217 ms!
In a way, this is cheating a little bit as it will delay the first time I see a prompt when PowerShell starts up.
However, it’s a definite psycological impact not seeing the message from PowerShell telling me my profile was taking a large amount of the overall startup time.
There are other improvements I could make to defer more initialization until needed.
For example, only adding some tools to my $env:PATH when my file location is in a git repo.
Closing
- Use tools like
PSProfilerto identify hot spots in your scripts to know where to focus optimization efforts. - Understand trade offs for when to use cmdlets vs .NET APIs.
- Micro-performance improvements do not necessarily translate to real world benefits.
- Defer some initialization in your profile to the prompt if you can separate parts of your profile for interactive use vs automation.
 Light
Light Dark
Dark
9 comments
Awesome post!
I created a gist wrapping your initial benchmarking stats into a quick function.
https://gist.github.com/matthewjdegarmo/9116187b246aef1b8087caea6a8e4730
Nice! I kind of feel like `Measure-Command` should have a `-Iteration` parameter to run the scriptblock multiple times and compute the average…
Very informative and very useful!!! Thanks for sharing it Steve!
Awesome, thank you!
My profile is currently loading between 15 and 23s and it pains me a bit that it takes so long.
I now learned that importing the modules I need takes the majority of time… nothing I can influence here 🙂
Could you elaborate a bit on the Initialize-Profile bit – How do you identify whether it the prompt is interactive in order to call the function?
Thanks,
David
PowerShell only calls your `prompt` function if a prompt needs to be displayed by the console host. The console host will only prompt for input if the session is interactive. For example, if you use: pwsh -c get-command, then the console host knows this is not interactive and will simply run `get-command`, display the results, and exit. So you can simply rely on `prompt` being called to know it’s interactive. I don’t want the initialization parts to run for every prompt since it’s not needed as the script will setup the runspace and only needs to do this once for every prompt. So I just check to make sure I haven’t run my private `Initialize-Profile` function before running it.
Works!!! A time saver. Thank you. 👍👍👍
I found that my profile time according to the initial benchmark was also about 1.5 seconds, which made me suspicious as my profile does a lot less than yours. So I tried changing the pwsh commands to pipe “Write-Output 1” into stdin instead of using -Command, so that it would act as close to an interactive session as feasible (processing the prompt, loading PSReadLine, etc.), and I found that the impact of my (unoptimized) profile dropped to around 200 ms! I strongly suspect this means that running non-interactively is masking some extra non-profile overhead that’s re-exposed when the profile is run, and thus gets incorrectly blamed on the profile. Maybe PSReadLine?
Of course, you probably care about the impact of the profile on both interactive and non-interactive sessions, so I guess more measurements are needed, and in general you should probably run non-interactive sessions with -NoProfile where feasible (because it doesn’t matter where that second and a half comes from, just that it happens).
Here are my machine’s results from a version of Matt’s code modified to measure both interactive and non-interactive and calculate some differences. This was run with a profile optimized similarly to Steve’s (the PSReadLine configuration and prompt are set up the first time the prompt is shown).
The “interactive impact” is the difference between the average non-interactive no-profile run and the average interactive no-profile run, trying to indicate how much time it costs to run interactively regardless of the profile.