
PIX 1904.23 – New Timing Capture preview and improved DXIL shader debugging
Today we released PIX 1904.23, available for download here. This release contains a preview of the new Timing Capture implementation and improvements to DXIL shader debugging and pixtool as well as various other improvements and bug fixes.
Highlights
- Preview of a new implementation of Timing Captures (see below)
- HLSL variables are now available during DXIL shader debugging
- New pixtool features:
- Use “take-capture –winml” to capture a WinML workload
- Use “take-capture –frames=5” to capture multiple frames
- Run “pixtool –help take-capture” for more details
- Information in timing capture’s Resources & Heaps view can now be copied to the clipboard
- Format is tab separated and can be pasted directly into Excel
- WinPixRemoteMonitor now has a UI
- ARM64 support (see below)
Preview of new Timing Capture implementation
This release of PIX includes a Preview version of a new implementation of Timing Captures. This new version is labeled a Preview both because various aspects of the new captures may change based on your feedback, and because the new implementation of Timing Captures does not yet include all of the features that existing Timing Captures have.
The new implementation of Timing Captures offers several advantages over existing Timing Captures, including:
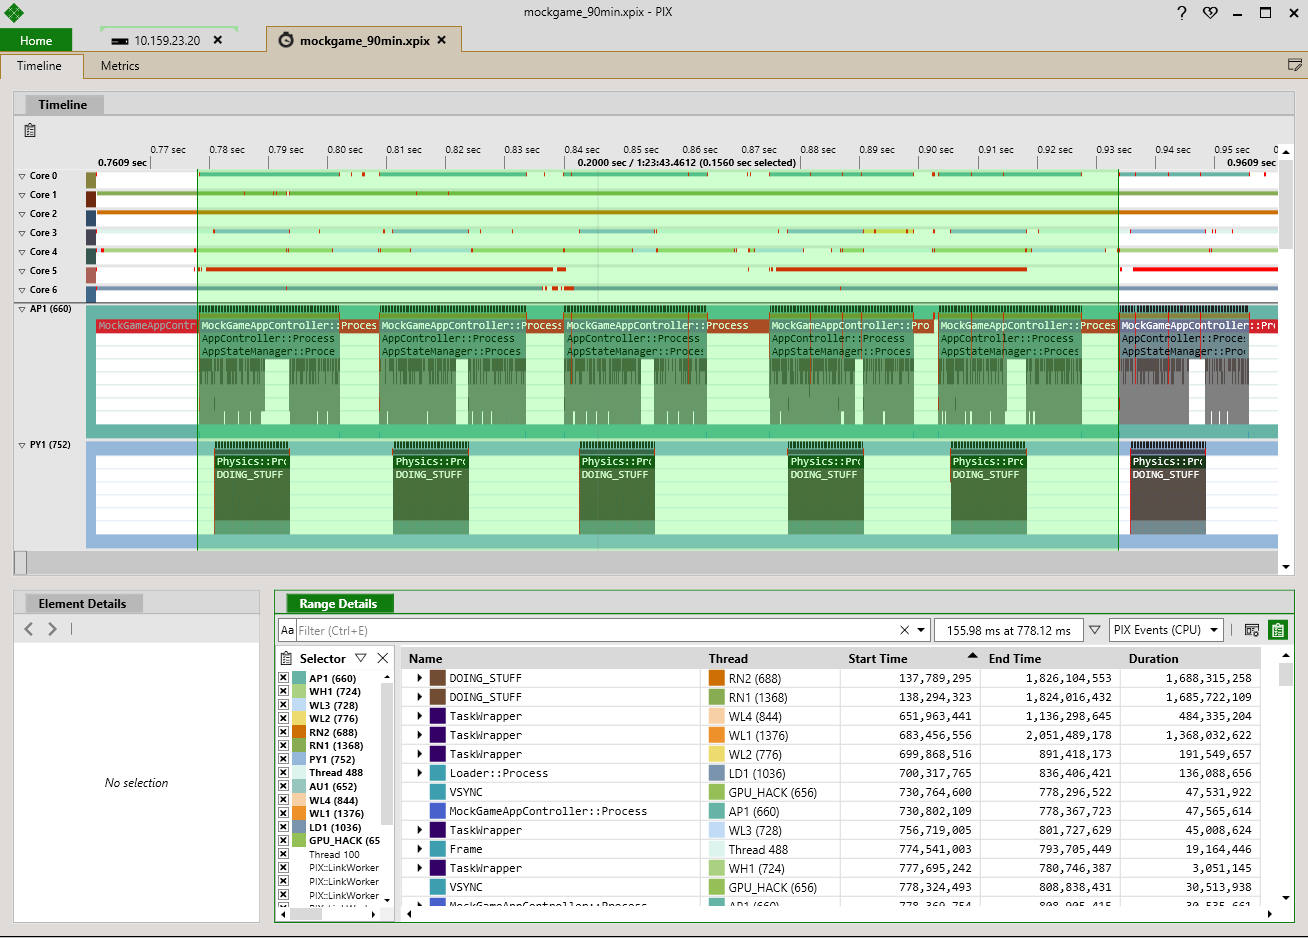
- Longer capture durations. Existing Timing Captures allow you to view a maximum of 2 seconds of profiling data. Capture durations are significantly extended in the new implementation. Capturing for durations on the order of hours is now supported.
- Faster capture opening times. New Timing Captures open much more quickly than existing Timing Captures. With larger captures, it’s not practical for PIX to show all the data immediately, but the goal is to show you enough data to get started within a few seconds.
- Improved analysis tools. A Metrics View has been added to Timing Captures to help you analyze the large volumes of data present in larger captures. This new view allows you to graph metrics such as event durations and counter values. Graphing multiple related metrics together allows you to see correlations between the performance characteristics of different PIX events and counters in your title.
- Integration of additional data sources. The addition of title-defined counter data to Timing Captures enables you to correlate the value of various counters with the code that is executing in your title at any point in time. For example, you can correlate the value of your title-defined metrics like “NumEnemies” with the PIX events in your title.
- Numerous improvements to the Timeline. The Timeline view includes numerous usability and navigation improvements. For example, you can now see Core and Thread activity together in one view, and context switches are easier to find and analyze.
New Timing Captures currently include a subset of the features present in existing PIX Timing Captures. These features will be added to New Timing Captures over the next several releases. The set of features currently missing from New Timing Captures is:
- GPU data
- Fence signals and waits
- GPU memory usage
- Tracked functions
- Stack Analysis view
- Warnings view
- Visualization that shows the correlation between GPU and CPU PIX events
- Execution times (in addition to duration) in the event list
- Setting a time limit for a capture
- Ready Thread visualization in Timeline
Known issues
- System Monitor doesn’t plot any data while new timing captures are active.
ARM64 Support
This release of PIX includes support for ARM64 desktop machines. Follow the steps below to get it configured:
- Install PIX on your x64 development machine.
- Copy the entire installed PIX folder (c:\Program Files\Microsoft PIX\<pix version>) to your ARM64 desktop machine.
- Launch WinPixRemoteMonitorUI.exe on the ARM64 machine.
- Create a new connection for the ARM64 remote machine and connect!
We’re Listening!
- Please do send any feedback, bug reports or questions to askwinpix at microsoft.com
- See Support page for other ways to contact us
Other Changes
- Buffer viewer usability improvements:
- Scroll position is preserved if format changed to same-sized type
- Progress bars are now shown while collecting data
- Integration with background shader optimizations (https://devblogs.microsoft.com/directx/background-shader-optimizations/)
- Pipeline view now shows parameters to meta command and resolves in an “API Parameter” stage, rather than “DMA”
- Shader editor now displays the reason why it is read-only
- Fix bug when collecting timing data in captures where the same command list is executed multiple times
- Fix crash during capture when app calls ID3D12Device2::CreatePipelineState with a null root signature
- Fix race condition when connecting to remote devices that could result in crashes or failed connections
- Fix capture of OpenSharedHandle for resources in the same process
- Update to AMD plugin
 Light
Light Dark
Dark
1 comment
not bad, trying