
GPU timing data in New Timing Captures
GPU timing data was added to the New Timing Captures preview feature in the PIX 1906.14 release. This allows developers to view GPU work submission and execution, including async compute.
Getting Started
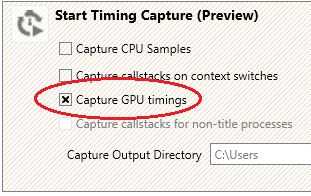
The application should be launched with the following GPU timings checkbox checked in the options to enable timing data collection.
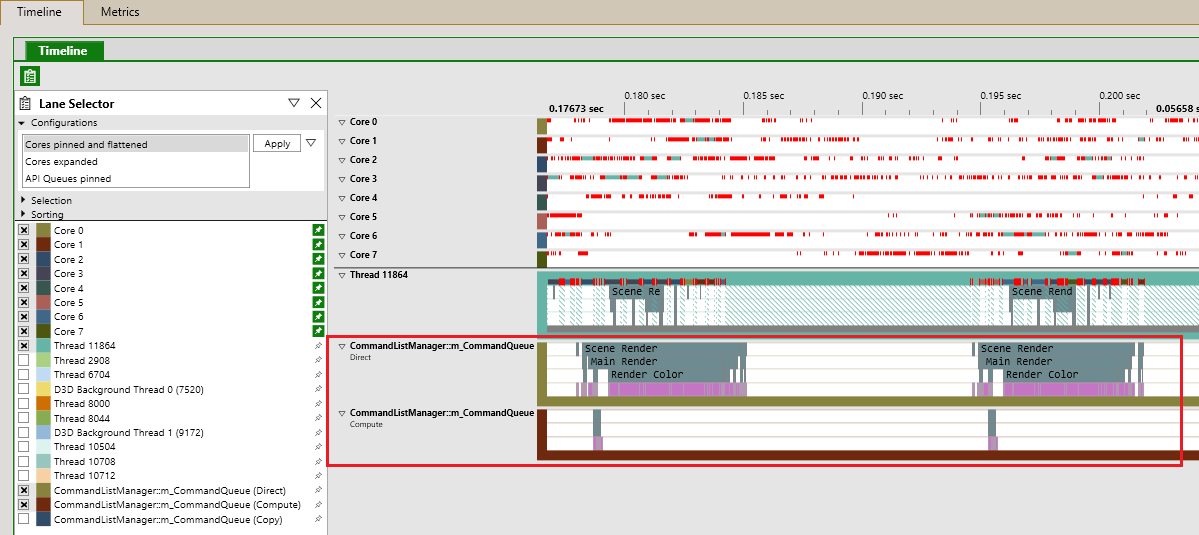
Command Queues
D3D12 command queues created by the application are represented as separate lanes containing colored bars that indicate GPU work. The name of the lane is a combination of D3D12 command queue name, if named by the title and the D3D12 command queue type (ex: DIRECT, COMPUTE, COPY, etc.)
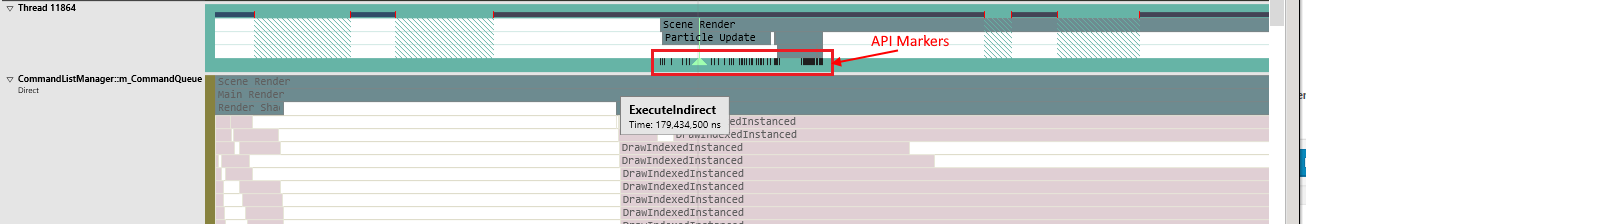
API Markers
API markers indicate on the CPU timeline for a particular thread where a specific operation was added to a command list. Each black tick mark shown below is a single API Marker. API markers are created when an application builds up a command list for execution.
GPU work
GPU work is drawn on the timeline as a flattened pink bar by default representing EOP (End Of Pipe) to EOP timestamps to make the lane more compact allowing PIX to fit more lanes on the timeline. The flattened lane visualization is a quick way to see that work is being executed on the command queue.

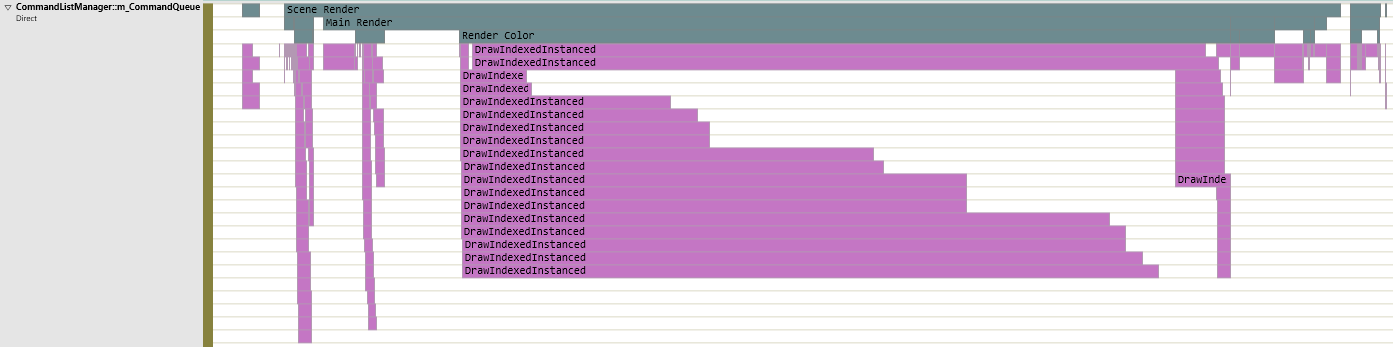
Viewing overlapped GPU work
The flattened view is not ideal for analysis as it hides overlapped GPU operations. Overlapping operations can be viewed by clicking the small arrow next to the command queue name and unchecking the ‘Flatten GPU Work’ checkbox setting.
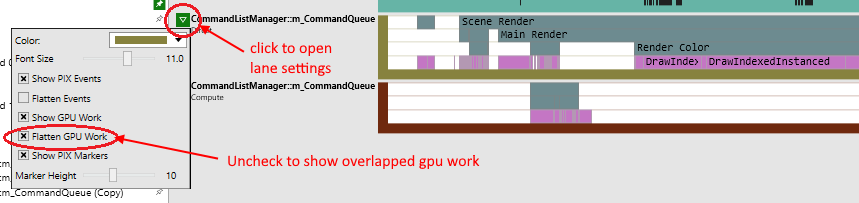
The following shows what overlapping gpu work looks like on a command queue. Overlapping operations are represented as TOP (Top Of Pipe) to EOP (End Of Pipe) timestamps.
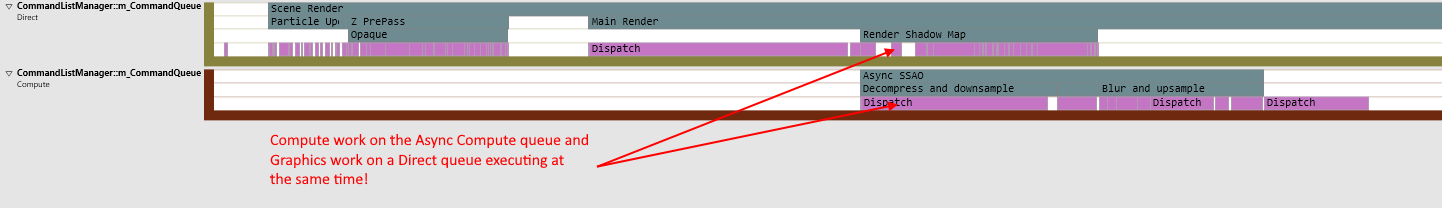
Viewing Parallel GPU work executing on multiple Command Queues
PIX will also show work that is executing in parallel on the GPU from different command queues. This is useful if you are debugging Async Compute workloads. The following is an example of a DIRECT command queue and a COMPUTE command queue doing work at the same time!
Viewing Timing data
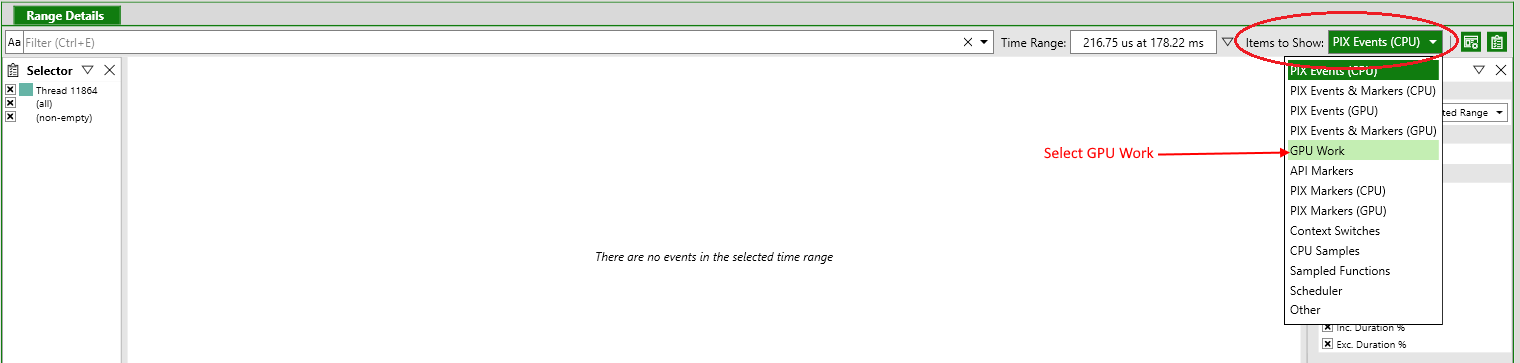
Mousing over individual gpu operations will show a tool tip that contains duration information. A table representation of a set of events can be configured to be shown in the Range Details view by dragging and selecting a range on the timeline.

In addition to the selection you may also have to change the ‘Items to Show’ combo box to ‘GPU Work’. The default is ‘PIX Events (CPU)’ so there will most likely not be anything shown after making your initial selection.
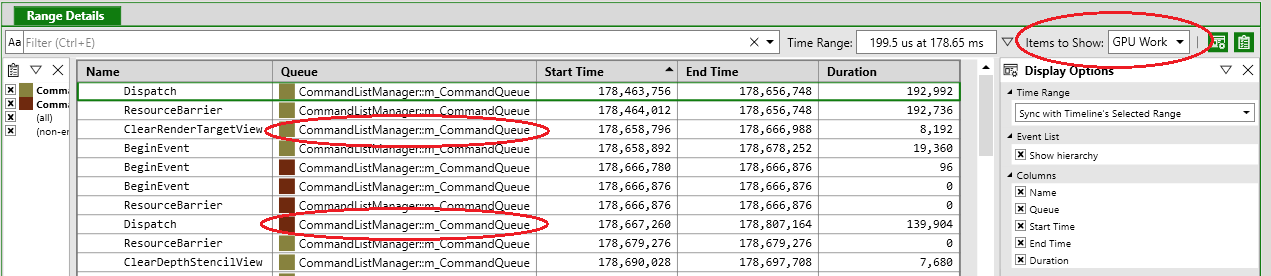
The Range Details table shows Start Time, End Time and Duration information. Notice that the selection range is across all visible lanes on the timeline. This means that if you have a COMPUTE queue and a DIRECT queue on your timeline you might see timing information for both in the same table.
Old Style timing captures used different terminology for timing information. Start Time is equal to SOP (Start of Pipe) and End Time is equal to (End of Pipe).
What’s Next
In the future, we plan to add more features currently found in existing Timing Captures, including:
- VSyncs and Presents
- Visualizations that show correlations between GPU and CPU PIX events
- Fence Signals and Waits
- GPU memory Usage
 Light
Light Dark
Dark
0 comments