
Debug your Arduino code with Visual Studio Code
Debugging Arduino application is a challenging task as the debugging feature has not been officially supported in Arduino IDE.
Many modern IDEs have debug support that developers are used to, using Breakpoints, Steps, Call Stack, Watch, Local/Global Variables, etc. Arduino developers often have to explore many alternative methods and tools to debug Arduino code. If the board has JTAG interface support, with the help of extra hardware, developer can do the debugging. For Atmel MCU, DebugWire. Some have to rely on Serial Monitor to print necessary messages for debugging. For those enterprise users, there are more paid options such as Visual Micro for Visual Studio, etc.
There is a new release from Arduino Extension for Visual Studio Code, with modern debugging features to help Arduino developers easily perform the debugging tasks within Visual Studio Code, without the need of extra hardware or extra lines of print messages.
Here is a sample debugging session to help Arduino developers get started:
- assuming developers have been using Arduino Extension for Visual Studio Code for developing Arduino code.
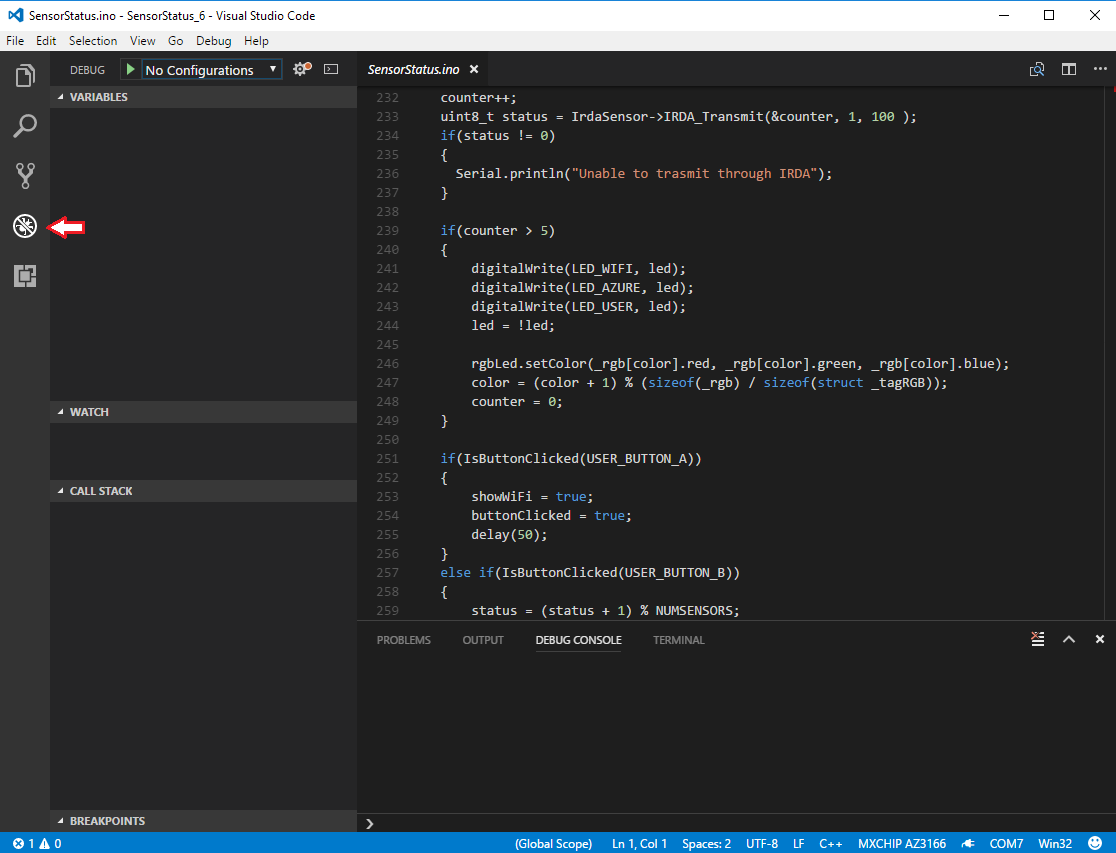
- open a *.ino file with device connected. Here we used Microsoft Azure IoT Developer Kit as test board, which is an Arduino compatible MCU board. Click debug button or (Ctrl+Shift+D), to enter debug view:

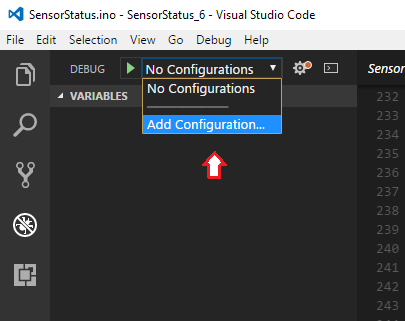
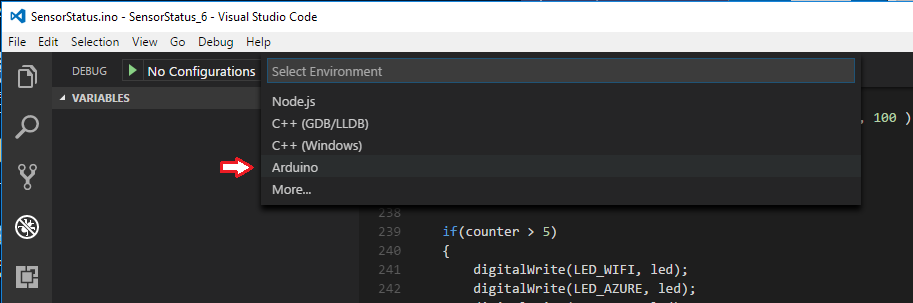
- follow this screen to add Arduino debugging configuration (F5)


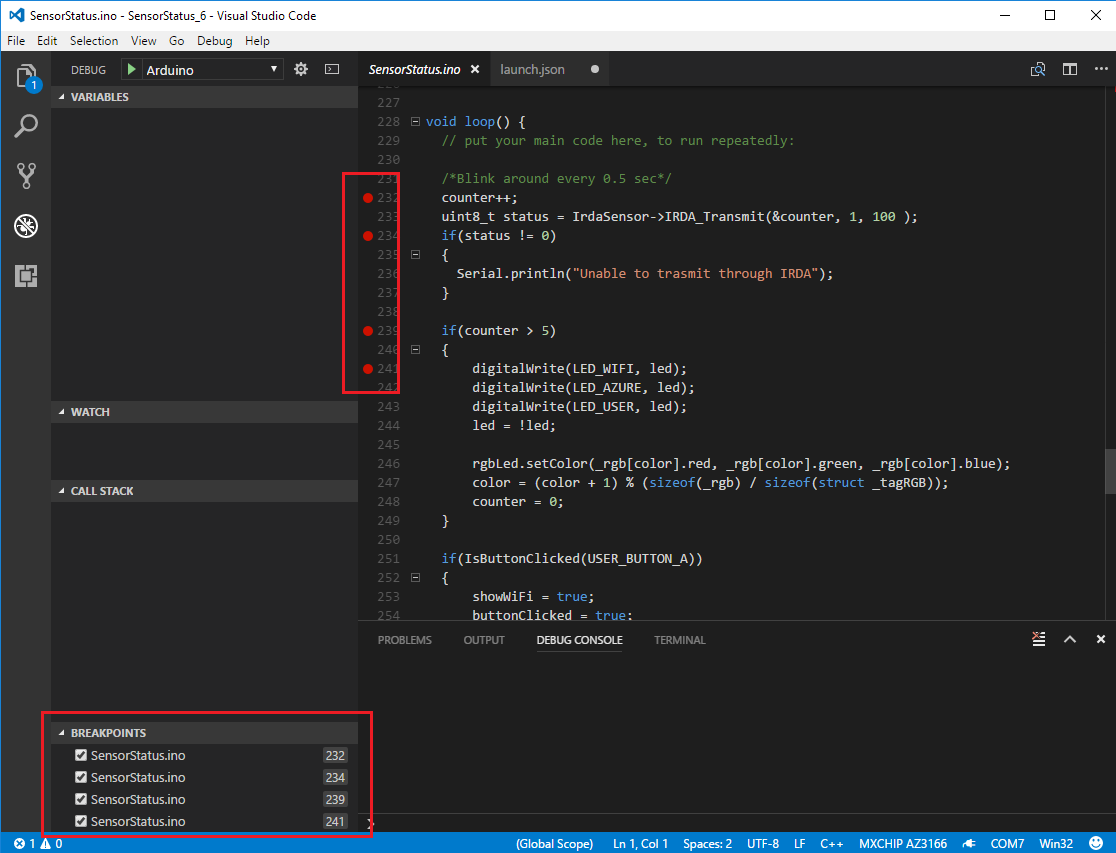
- Switch back to the *.ino file you are developing, and click before the line number to set desired break points:
- Click the “start” button or press F5 to start the debugging session. It will first verify the code, then upload the binary to the board.

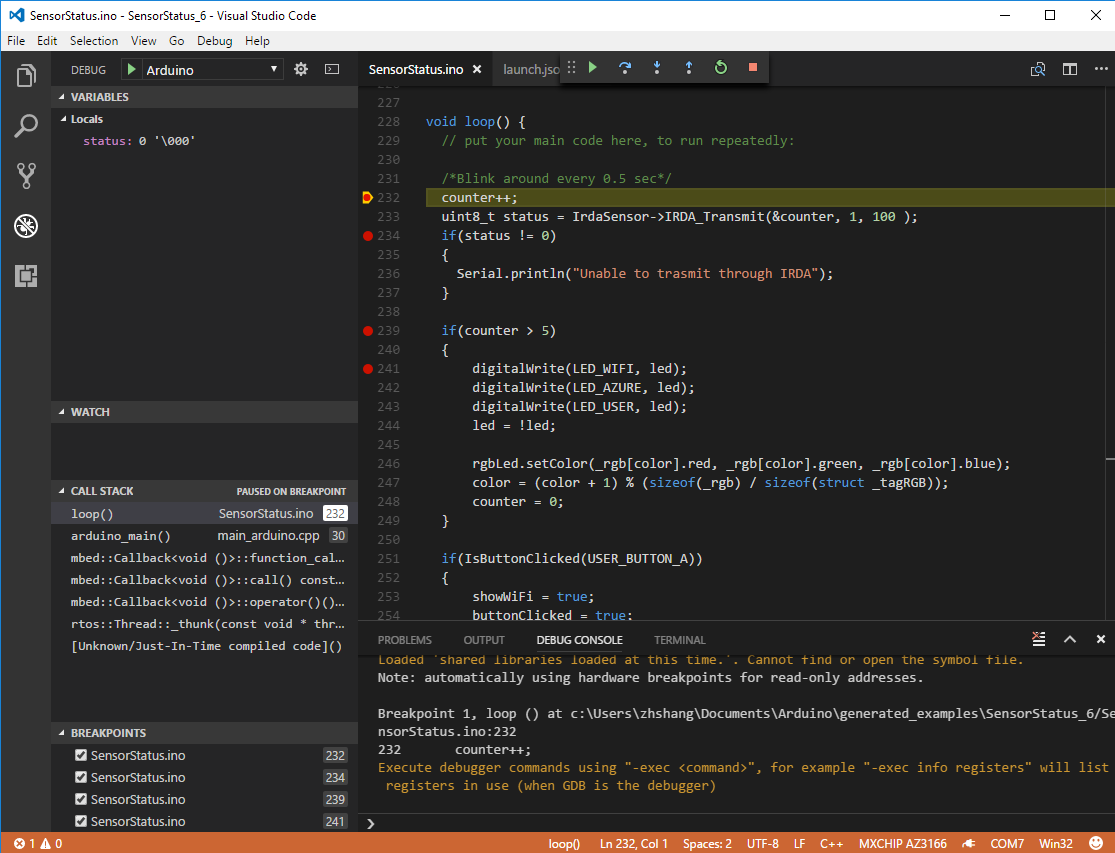
- Once pause at the first break point, you can do the regular debugging tasks using short-cut keys or GUI controls to do the regular continue, step-over, step-in, step-out, restart, stop actions. Meanwhile the debugging panel will display the local variables and values, call stack and watch if you set any.

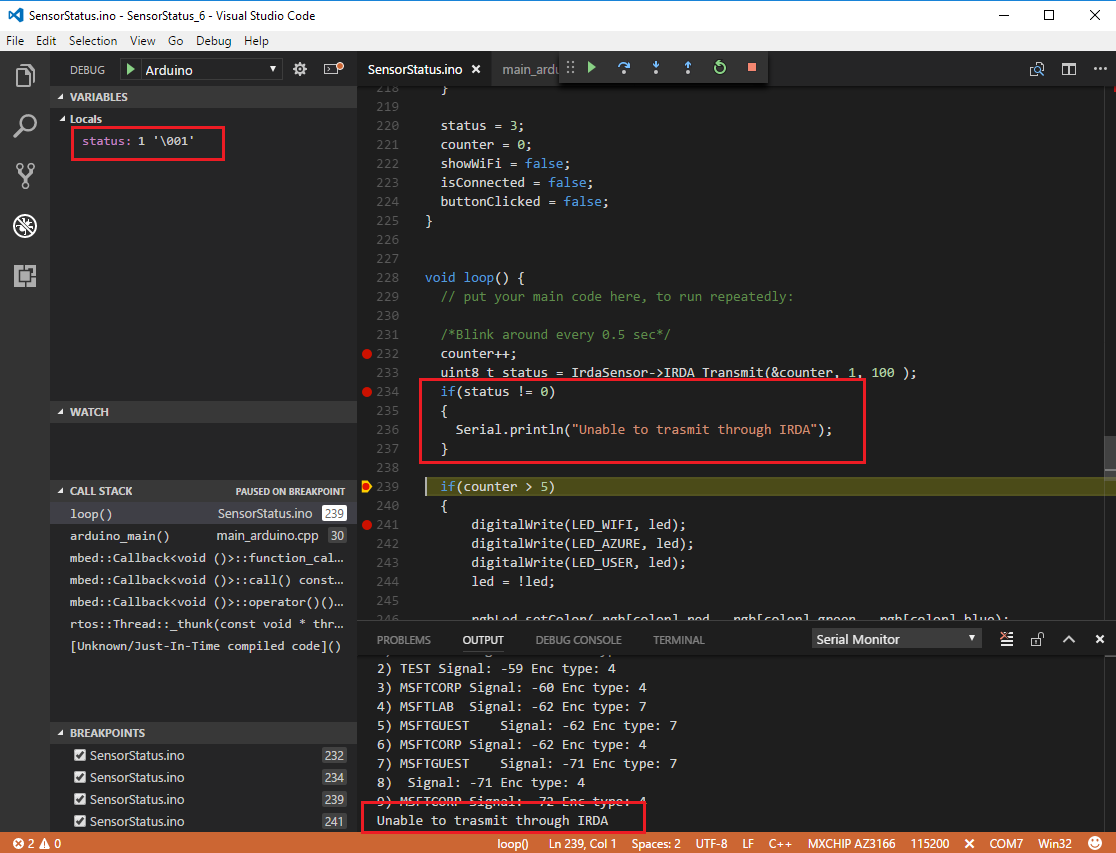
- you can dynamically change the local variable or global variable values. You can also open the Serial Monitor at the same time to print out messages:


The boards we tested to work with new debugging features:
- Microsoft Azure IoT Developer Kit (AZ3166)
- Arduino Zero Pro
- Arduino M0 PRO
- Adafruit WICED WiFi Feather
- Addafruit Feather M0
- more to come…
What the current version of debugging doesn’t support:
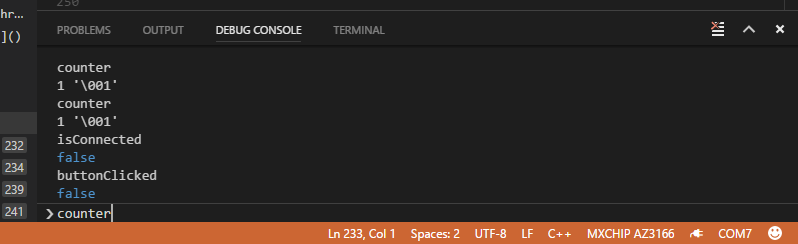
- listing global variables and values in debugging panel. You can instead type the global variable in debug console to see the value, or mouse over the variable of interest in your code while in debug mode to get the current value:

Please download the latest Arduino Extension for Visual Studio Code to try the debugging feature. If you don’t have a supported board yet for testing out the debugging feature, please check out Microsoft Azure IoT Developer Kit page to register and request a kit.
We have built many getting started tutorials and code samples for your reference.
We welcome your feedback and you can join our discussion at chat on gitter.
 Light
Light Dark
Dark
4 comments
Hi, Thank you for this article.
Regarding Arduino, I cannot debug because I did not found the way to install the debugger (which one should I install?).Here are my 2 questions:
#1 Is there a simple debugger that works without the physical bord plugged in, just to check whats going on with the “pure” C code?
#2 Is there a debugger that would take the name of the board and provide fakes I/O and wont need the actual board so you could fix yourself the value of these I/O (when used as input)?
Thank you
I have trying to debug an Arduino Uno Rev2; When I run thedebugger I get the error message “Cannot find the OpenOCD from the launch.json debugServerPath property”Do I need to install OpenOCD, or addsome configuration to launch.json ?
Hello, i have the same trouble.
In the tutorial it is missing that you should configure the Arduino extension