
Large Object Heap Uncovered (an old MSDN article)
I wrote this article in 2008 and the MSDN website no longer has it so I am making it available here. Please note that it has been quite a while and some things related to LOH have changed quite a bit. See the GC ETW blog entries I wrote for the current tooling options. Also note that obviously some of the links mentioned in this article may no longer exist.
The .NET Garbage Collector divides objects up into small and large objects. When an object is large some attributes associated with it become more significant than if the object is small. For instance, compacting it, meaning copying the memory elsewhere on the heap, is expensive. In this article we are going to look at the large object heap in depth. We will talk about what qualifies an object as a large object, how these large objects are collected and what kind of performance implications large objects impose.
How an object ends up on the large object heap and how GC handles them.
In .NET 1.1 and 2.0 if an object is >= 85,000 bytes it’s considered a large object. This number was determined by performance tuning. When an object allocation request comes in, if it’s >= 85,000 bytes, we will allocate it on the large object heap. What does this mean exactly? To understand this, it may be beneficial to explain some fundamentals about the .NET GC.
As many of you are aware, the .NET Garbage Collect is a generational collector. It has 3 generations – generation 0, generation 1 and generation 2. The reason behind having 3 generations is that we expect for a well tuned app, most objects die in Gen0. For example, in a server app, the allocations associated each request should die after the request is finished. And the in flight allocation requests will make into Gen1 and die there. Essentially Gen1 acts as a buffer between young object areas and long lived object areas.
From the generation point of view, large objects belong to generation 2 because they are collected only when we do a generation 2 collection.
When a generation gets collected, all its younger generation(s) also get collected. So for example, when a generation 1 GC happens, both generation 1 and 0 get collected. And when a generation 2 GC happens, the whole heap gets collected. For this reason a generation 2 GC is also called a full GC. In this article I will use generation 2 GC instead of full GC but they are interchangeable.
So generations are the logical view of the GC heap. Physically, objects live on the managed heap segments. A managed heap segment is a chunk of memory that the GC reserves from the OS (via calling VirtualAlloc) on behalf of managed code. When the CLR gets loaded we allocate 2 initial heap segments – one for small objects and one for large objects which we will refer to as SOH (Small Object Heap) and LOH (Large Object Heap) respectively.
The allocation requests are then satisfied by putting managed objects on this managed heap segment. If the object is less than 85,000 byte it will be put on the segment for SOH; otherwise it’ll be on a LOH segment. Segments are committed (in smaller chunks) as more and more objects are allocated onto them.
For SOH, objects that survive a GC get promoted to the next generation; so objects that survive a generation 0 collection will now be considered generation 1 objects, and so on. Objects that survive the oldest generation, however, will still be considered in the oldest generation. In other words, survivors from generation 2 will be generation 2 objects; and survivors from LOH will be LOH objects (collected with gen2). The user code can only allocate in generation 0 (small objects) or LOH (large objects). Only GC can “allocate” objects in generation 1 (by promoting survivors from generation 0) and generation 2 (by promoting survivors from generation 1 and 2).
When a GC is triggered, we trace through the live objects and compact them. For LOH though, because compaction is expensive we choose to sweep them, meaning making a free list out of dead objects that can be reused later to satisfy large object allocation requests. Adjacent dead objects are made into one free object.
An important thing to keep in mind is that even though today we don’t compact LOH, we might in the future. So if you allocate large objects and want to make sure that they don’t move you should still pin them.
Note that the figures below are only for illustration purposes – I use very few objects to show what happens on the heap. In reality there are much more objects there.
Fig. 1 illustrates a scenario where we form generation 1 after the first generation 0 GC where Obj1 and Obj3 are dead; and we form generation 2 after the first generation 1 GC where Obj2 and Obj5 are dead.
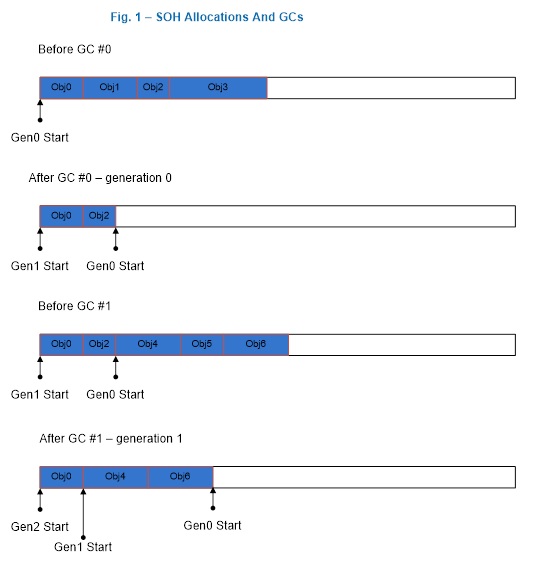
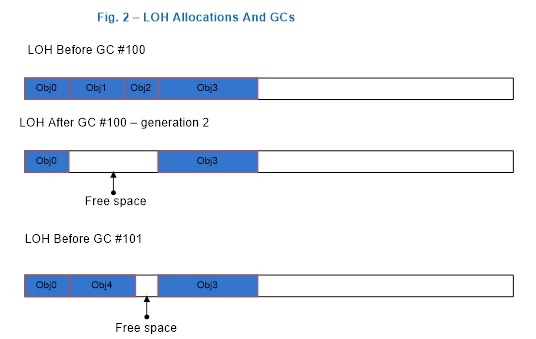
Fig. 2 illustrates that after a generation 2 GC which saw that Obj1 and Obj2 being dead we formed one free space out of memory that used to be occupied by Obj1 and Obj2 which then was used to satisfy allocation request for Obj4. The space after the last object Obj3 till end of the segment can also be used to satisfy allocation requests.
If we don’t have enough free space to accommodate the large object allocation requests we will first attempt to acquire more segments from the OS. If that fails then we will trigger a generation 2 GC in hope of freeing up some space.
During a generation 2 GC we take the opportunity to release segments that have no live objects on them back to the OS (by calling VirtualFree). Space after the last live object till the end of the segment is decommitted. And the free spaces remain committed though they are reset, meaning the OS doesn’t need to write data in them back to disk. Fig. 3 illustrate a scenario where we released one segment back to the OS (segment 2) and decommitted more space on the remaining segments. If we need to use the decommitted space at the end of the segment to satisfy large object allocation requests we will commit the memory again.
For an explanation on commit/decommit please see the msdn documentation on VirtualAlloc.

When a large object gets collected
To answer this question, let’s first talk about when a GC happens in general. A GC occurs if one of the following 3 conditions happens:
1) Allocation exceeds the generation 0 or large object threshold;
2) System.GC.Collect is called;
3) System is in low memory situation;
The threshold is a property of a generation. When you allocate objects into a generation you set the threshold we set for that generation. And when the threshold is exceeded for a generation a GC is triggered on that generation. So when you allocate small or large objects you consume generation 0 and LOH’s respective threshold. And when GC allocates into generation 1 and 2 it consumes their thresholds. These thresholds are dynamically tuned as the program runs.
1) is your typical case – most GCs happen because of allocations on the managed heap. 2) is the case when someone calls GC.Collect. If it’s called on generation 2 (by passing either no arguments to GC.Collect or passing GC.MaxGeneration as an argument) LOH will get collected right away along with the rest of the managed heap. 3) happens when we receive the high memory notification from the OS and if we think doing a generation 2 GC will be productive we will trigger one.
LOH Performance Implications
1) Allocation cost.
The CLR makes the guarantee that the memory for every new object we give out is cleared. This means the allocation cost of a large object is completely dominated by memory clearing (unless it triggers a GC). If it takes 2 cycles to clear one byte, it means it takes 170,000 cycles to clear the smallest large object. It’s not uncommon that people allocate large objects that are a few to many MBs. For a 16MB object on a 2GHz machine it’ll take approximately 16ms to clear the memory. That’s a rather large cost.
2) Collection cost.
As we mentioned above, LOH and generation 2 are collected together. If either one’s threshold is exceeded it will trigger a generation 2 collection. If a generation 2 was triggered because of LOH, generation 2 itself won’t necessarily get much smaller after the GC. Now, if there’s not much data on generation 2 this is not a problem. But if generation 2 is big it could cause performance problems if many generation 2 GCs are triggered. If many large objects are allocated on a very temporary basis and you have a big SOH, you could be spending too much time doing GCs; not to mention the allocation cost can really add up if you keep allocating and letting go really large objects.
3) Very large objects on LOH are usually arrays (it’s very rare to have an instance object that’s really really large). If the elements of an array are reference rich it incurs cost that is not present if the elements are not reference rich. If the element doesn’t contain any references we wouldn’t need to go through the array at all. For example, if you use an array to store nodes in a binary tree, one way to implement it is to refer to a node’s right and left node by the actual nodes:
class Node { Data d; Node left; Node right; };
Node[] binary_tr = new Node [num_nodes];
If num_nodes is a large number it means we will need to go through at least 2 references per element. An alternative approach is to store the index of the right and the left node:
class Node { Data d; uint left_index; uint right_index; };
This way instead of referring the left node’s data as left.d you refer to it as binary_tr[left_index].d. And GC wouldn’t need to look at any references for left and right node.
Out of the 3 factors, the first 2 are usually more dominating factors than the 3rd one.
Based on this it’s recommended that it would be best if you could allocate a pool of large objects and reuse them instead of allocating temporary ones. Yun Jin has a good example of such a buffer pool in his blog entry. Of course you would want to make the buffer size larger.
Collecting performance data for the LOH
There are a few ways to collect performance data that’s relevant for the LOH. But before I explain them, let’s talk about why you would want to collect performance data for LOH.
Before you start collecting performance data for a specific area hopefully you have already done the following:
1) found evidence that you should be looking at this area or
2) exhausted other areas that you know of and didn’t find any problems that could explain the performance problem you saw.
I would recommend reading this blog entry for more explanation. It talks about the fundamentals about memory and CPU.
The Investigating Memory Issues MSDN article talks about steps of diagnosing performance problems in a managed process that may be related to managed heap.
1) .NET CLR Memory Performance counters
These performance counters are usually a good first step in investigating performance issues. The ones that are relevant for LOH are:
# Gen 2 Collections:
Displays the number of times the generation 2 GCs have occurred since the process started. The counter is incremented at the end of a generation 2 garbage collection (also called a full garbage collection). This counter displays the last observed value.
Large Object Heap size
Displays the current size, in bytes, including the free space, of the Large Object Heap. This counter is updated at the end of a garbage collection, not at each allocation.
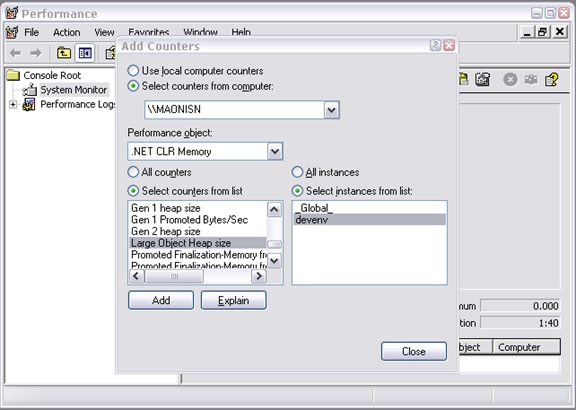
A common way to look at performance counters is via Performance Monitor (perfmon.exe). Use “Add Counters” to add the interesting counter for processes that you care about.
You can save the performance counter data to a log file in perfmon.
Performance counters can also be queried programmatically. Many people collect them this way as part of their routine testing process. When they spot counters with values that are out of ordinary they will use other means to get more detailed to help with the investigation.
2) Using a debugger
The debugging commands mentioned in this section are applicable to the Windows Debuggers.
If you need to look at what objects are actually on the LOH you can use the SoS debugger extension provided by the CLR (explained in the Investigating Memory Issues article). An example output of analyzing the LOH is below:
0:003> .loadby sos mscorwks 0:003> !eeheap -gc Number of GC Heaps: 1 generation 0 starts at 0x013e35ec generation 1 starts at 0x013e1b6c generation 2 starts at 0x013e1000 ephemeral segment allocation context: none segment begin allocated size 0018f2d0 790d5588 790f4b38 0x0001f5b0(128432) 013e0000 013e1000 013e35f8 0x000025f8(9720) Large object heap starts at 0x023e1000 segment begin allocated size 023e0000 023e1000 033db630 0x00ffa630(16754224) 033e0000 033e1000 043cdf98 0x00fecf98(16699288) 043e0000 043e1000 05368b58 0x00f87b58(16284504) Total Size 0x2f90cc8(49876168) —————————— GC Heap Size 0x2f90cc8(49876168) 0:003> !dumpheap -stat 023e1000 033db630 total 133 objects Statistics: MT Count TotalSize Class Name 001521d0 66 2081792 Free 7912273c 63 6663696 System.Byte[] 7912254c 4 8008736 System.Object[] Total 133 objects
This says that the LOH heap size is (16,754,224 + 16,699,288 + 16,284,504 =) 49,738,016 bytes. And between address 023e1000 and 033db630, 8,008,736 bytes are occupied by System.Object[] objects; 6,663,696 are occupied by System.Byte[] objects and 2,081,792 bytes are occupied by free space.
Sometimes you’ll see the total size of the LOH being less than 85,000 bytes, why is this? Because the runtime itself actually uses LOH to allocate some objects that are smaller than a large object.
Since LOH are not compacted, sometimes people suspect that LOH is the source of fragmentation. When we talk about “fragmentation” we need to first clarify what fragmentation means. There’s fragmentation of the managed heap which is indicated by the amount of free space between managed objects (ie, what you see when you do !dumpheap –type Free in SoS); there’s also fragmentation of the virtual memory address space which is the memory marked as MEM_FREE type which you can get by various debugger commands in windbg. Below is an example that shows the fragmentation in the VM space:
0:000> !address 00000000 : 00000000 – 00010000 Type 00000000 Protect 00000001 PAGE_NOACCESS State 00010000 MEM_FREE Usage RegionUsageFree 00010000 : 00010000 – 00002000 Type 00020000 MEM_PRIVATE Protect 00000004 PAGE_READWRITE State 00001000 MEM_COMMIT Usage RegionUsageEnvironmentBlock 00012000 : 00012000 – 0000e000 Type 00000000 Protect 00000001 PAGE_NOACCESS State 00010000 MEM_FREE Usage RegionUsageFree
… [omitted]
——————– Usage SUMMARY ————————– TotSize ( KB) Pct(Tots) Pct(Busy) Usage 701000 ( 7172) : 00.34% 20.69% : RegionUsageIsVAD 7de15000 ( 2062420) : 98.35% 00.00% : RegionUsageFree 1452000 ( 20808) : 00.99% 60.02% : RegionUsageImage 300000 ( 3072) : 00.15% 08.86% : RegionUsageStack 3000 ( 12) : 00.00% 00.03% : RegionUsageTeb 381000 ( 3588) : 00.17% 10.35% : RegionUsageHeap 0 ( 0) : 00.00% 00.00% : RegionUsagePageHeap 1000 ( 4) : 00.00% 00.01% : RegionUsagePeb 1000 ( 4) : 00.00% 00.01% : RegionUsageProcessParametrs 2000 ( 8) : 00.00% 00.02% : RegionUsageEnvironmentBlock Tot: 7fff0000 (2097088 KB) Busy: 021db000 (34668 KB) ——————– Type SUMMARY ————————– TotSize ( KB) Pct(Tots) Usage 7de15000 ( 2062420) : 98.35% : <free> 1452000 ( 20808) : 00.99% : MEM_IMAGE 69f000 ( 6780) : 00.32% : MEM_MAPPED 6ea000 ( 7080) : 00.34% : MEM_PRIVATE ——————– State SUMMARY ————————– TotSize ( KB) Pct(Tots) Usage 1a58000 ( 26976) : 01.29% : MEM_COMMIT 7de15000 ( 2062420) : 98.35% : MEM_FREE 783000 ( 7692) : 00.37% : MEM_RESERVE Largest free region: Base 01432000 – Size 707ee000 (1843128 KB)
As we mentioned above fragmentation on the managed heap is used for allocation requests it’s more common to see VM fragmentation caused by temporary large objects which require GC to frequently acquire new managed heap segments from the OS and release empty ones back to the OS.
To verify if LOH is causing VM fragmentation you can set a breakpoint on VirtualAlloc and VirtualFree and see who call them. For example, if I want to see who tried to allocate virtual memory chunks from the OS that are larger than 8MB, I can set a breakpoint like this:
bp kernel32!virtualalloc “j (dwo(@esp+8)>800000) ‘kb’;’g'”
This says to break into the debugger and show me the callstack if VirtualAlloc is called with the allocation size greater than 8MB (0x800000) and don’t break into the bugger otherwise.
In CLR 2.0 we added a feature called VM Hoarding that may be applicable if you are in a situation where segments (including on the large and small object heap) are frequently acquired and released. To specify VM Hoarding, you specify a startup flag called STARTUP_HOARD_GC_VM via hosting API. When you specify this, instead of releasing empty segments back to the OS we decommit the memory on these segments and put them on a standby list. Note that we don’t do this for the segments that are too large. We will use these segments later to satisfy new segment requests. So next time we need a new segment we will use one from this standby list if we can find one that’s big enough. This feature is also useful for applications that want to hold onto the segments that they already acquired, like some server apps that don’t want to get OOM because they avoid fragmentation of the VM space as much as they can, and since they are usually the dominating apps on the machine they can do this. I strongly recommend you to carefully test your application when you use this feature and make sure your application has a fairly stable memory usage.
Conclusion
Large objects are expensive in 2 ways:
- The allocation cost is high because we need to clear the memory for a newly allocated large object because CLR guarantees that memory for all newly allocated objects is cleared.
- LOH is collected with the rest of the heap so carefully analyze how that impacts performance for your scenario.
Reuse large objects if possible to avoid fragmentation on the managed heap and the VM space.
Currently LOH is not compact but that is an implementation detail that should not be relied on. So to make sure something is not moved by the GC, always pin it.
 Light
Light Dark
Dark
0 comments