
Improving Debug-time Productivity with Source Link
How many times have you been in the debugger tracking down a bug, stepping through code, looking at what local variable values changed, when you hit a wall — the value isn’t what you expected, and you can’t step into the method that produced it because it’s from a library or .NET framework itself? Or you set a conditional breakpoint waiting to examine how some value got set, then noticing a call stack that’s mostly greyed out, not letting you see what happened earlier in the call stack? Wouldn’t it be great if you could easily step into, set breakpoints, and use all the debugger’s features on NuGet dependencies or the framework itself?
.NET development practices in 2020 are a lot different and better in many ways than they were ten years ago. The biggest change is that the .NET platform is open source and maintained on GitHub. Many of the NuGet libraries that we all use on a daily basis are also maintained on GitHub. That means that the source I’d really like to see in my debugger is just one HTTPS GET away. We could have this wonderfully productive ecosystem where we could all debug with source, for all our dependencies, all the time. That would be nice! In fact, the Source Link project, which was started by Cameron Taggart, realized this, and built an experience that did just that. Let me tell you about it.
With Source Link-enabled libraries, the debugger can download the underlying source files as you step in, and you can set breakpoints/tracepoints like you would with any other source. Source Link-enabled debugging makes it easier to understand the full flow of your code from your code down to the runtime. Source Link is language-agnostic, so you can benefit from it for any .NET language and for some native libraries.
Debugging the framework
Let’s look at an example. Sometimes you want to step into the framework to see what’s going on, especially if something is happening that you didn’t expect. With Source Link, you can step into framework methods just like you can with your own code, inspect all variables, and set breakpoints.
If you tried it without Source Link, here’s what you’d see, before and after hitting F11 to step in.
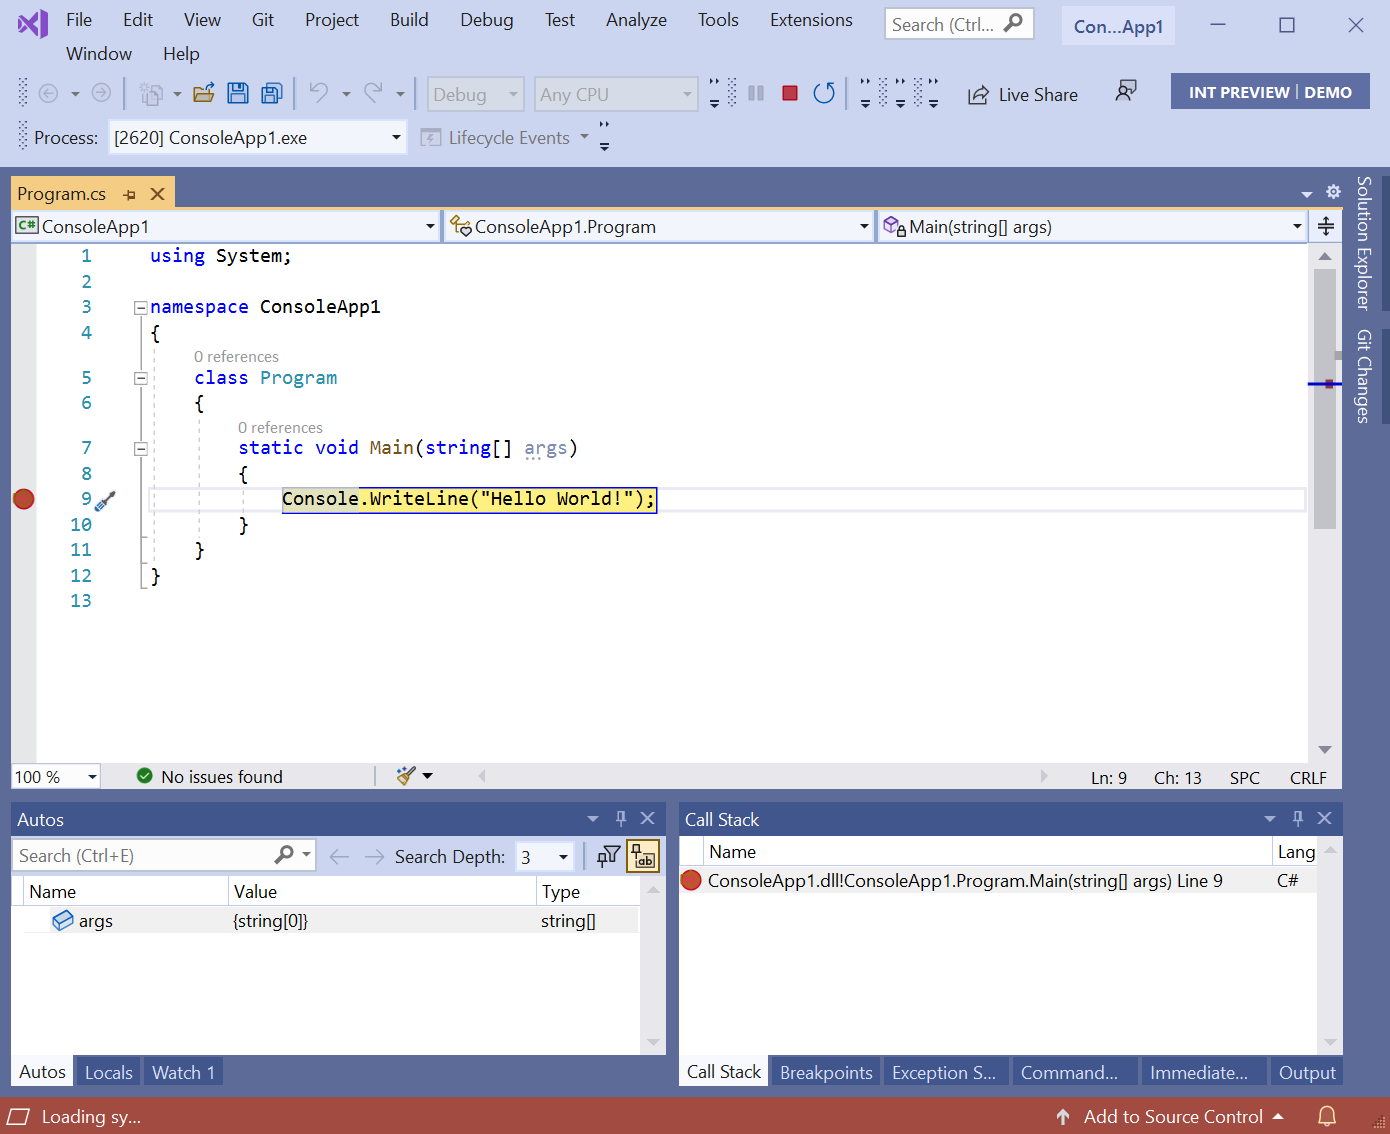
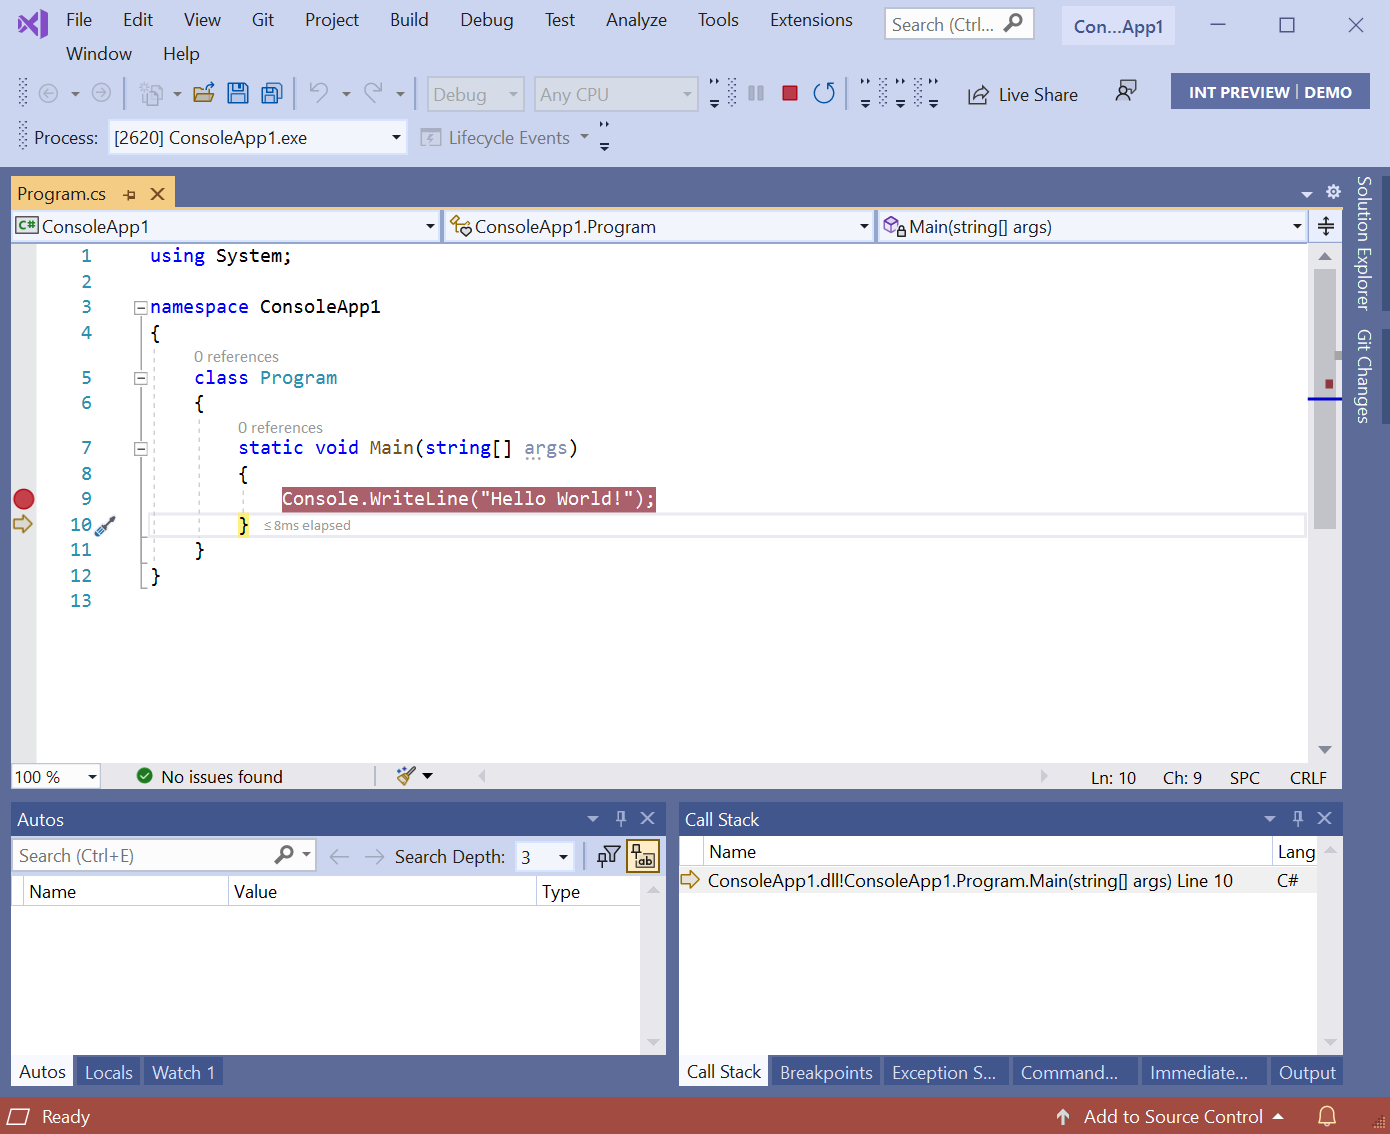
The debugger does not step into Console.WriteLine because there are no symbols or source for it. Once we configure Source Link, when we step in, we get a different result:
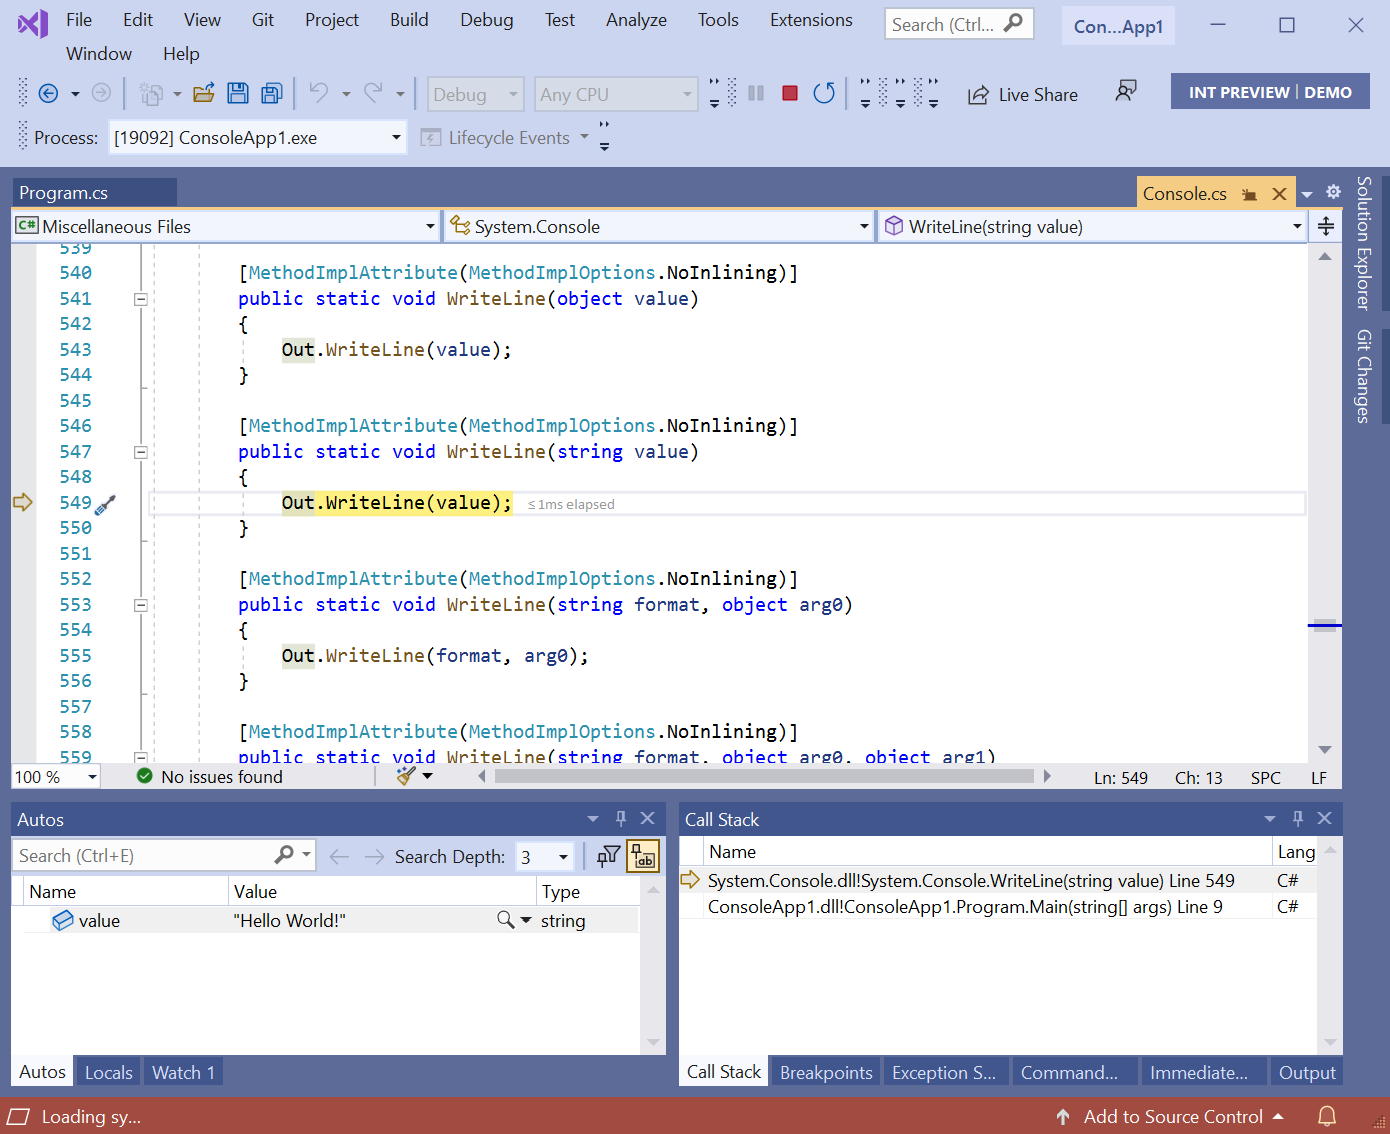
You can see that Visual Studio has downloaded the matching source and stepped into the method. If you look at the Autos window, it shows the local variables passed in. You can step into, over, and out of the framework code as much as you’d like.
Debugging a dependency
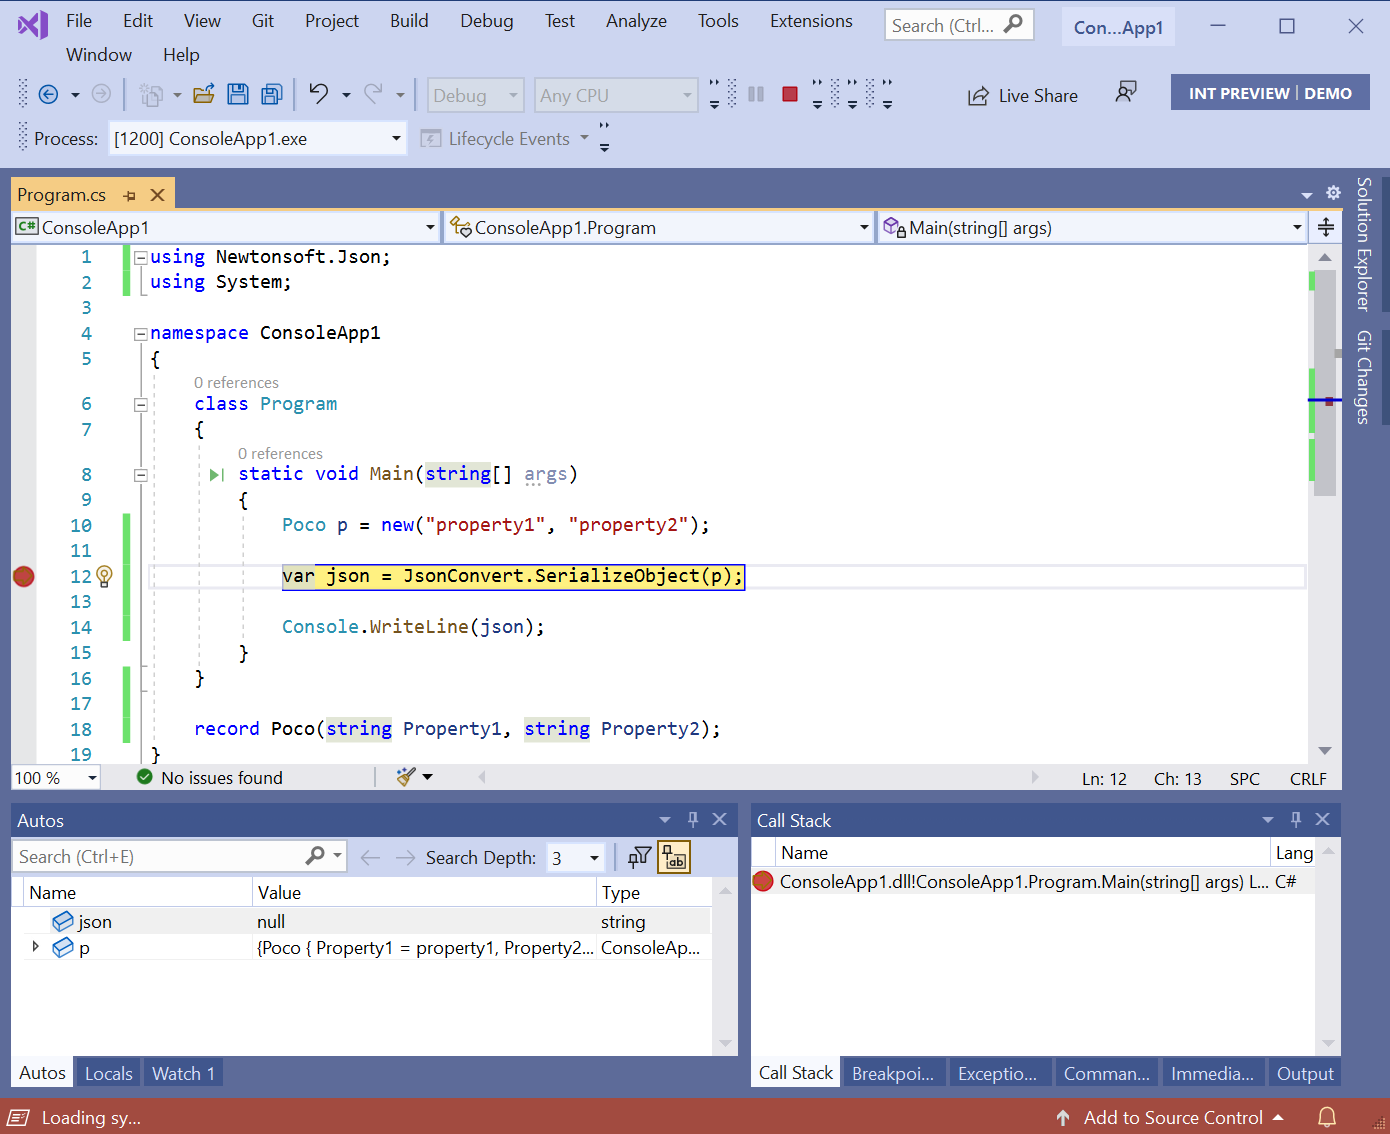
Often, the issue you’re trying to solve is in a dependency. Wouldn’t it be great if you could step into the source for your dependencies too? If the dependency added Source Link information during its build, you can! Here’s an example with Newtonsoft.Json. Because Newtonsoft.Json was built with Source Link information, you can step into its code:
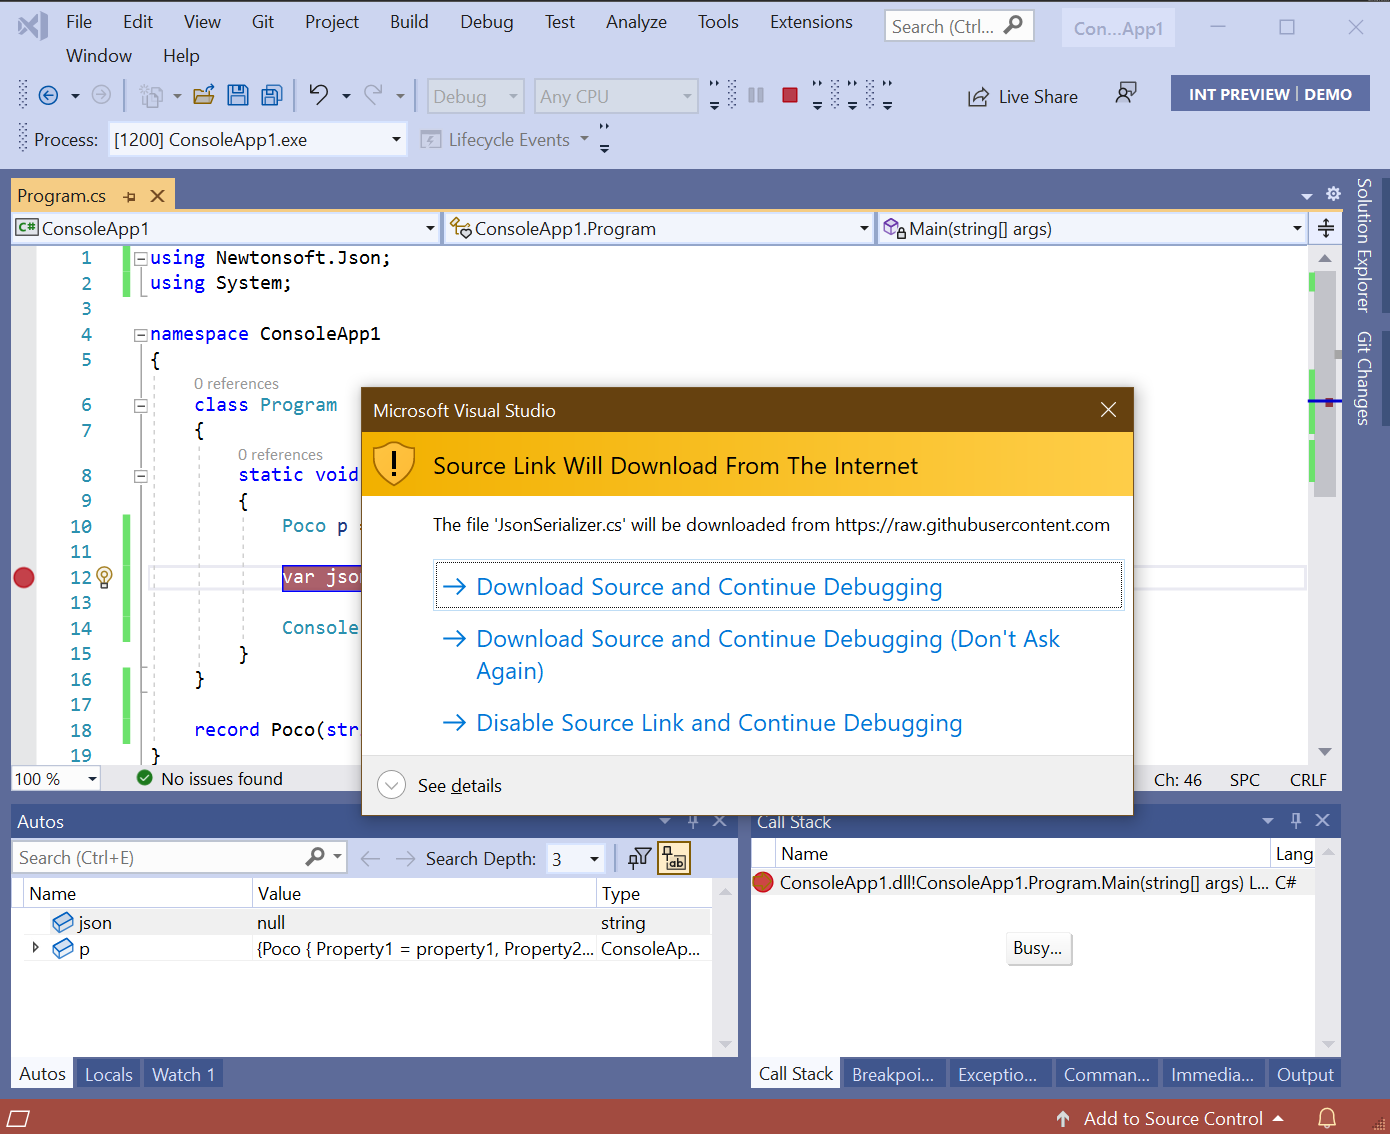
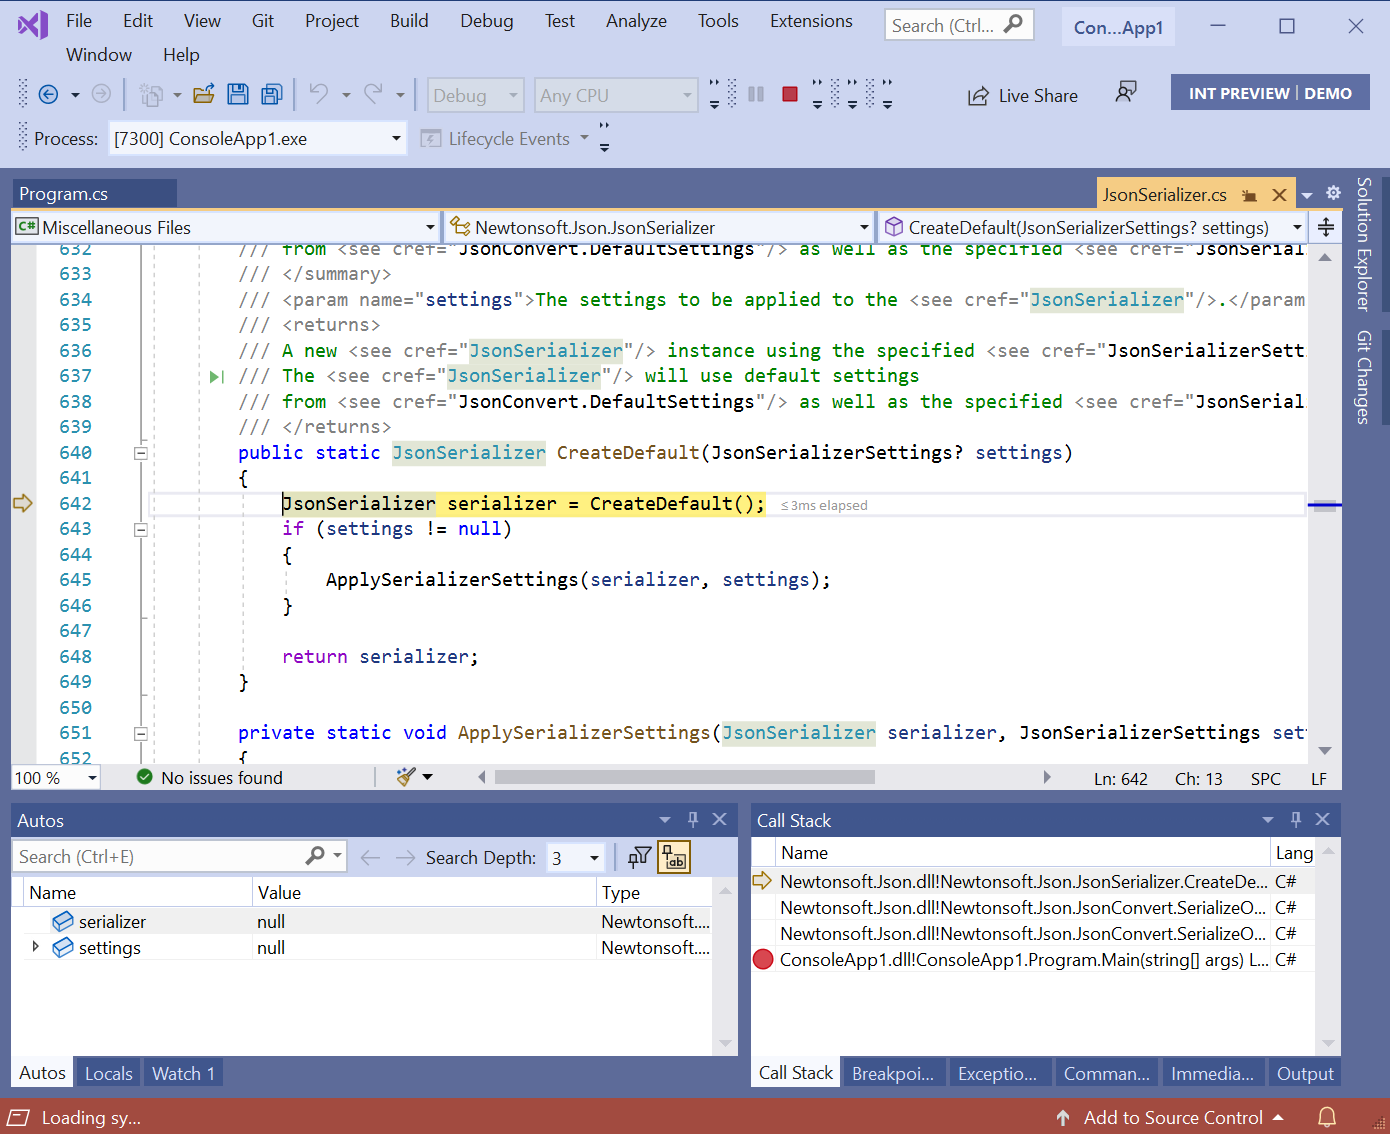
When I stepped in, the debugger skipped a couple of methods that were marked with DebuggerStepThrough and stopped on the next statement in the CreateDefault method. Since the source comes from the internet (GitHub, in this case), you’re prompted to allow it, either for just a single file or for all files.
Exceptions
Source Link helps you with exceptions that come from the framework or dependencies. How many times have you seen this message and what you really want is to examine the variables?
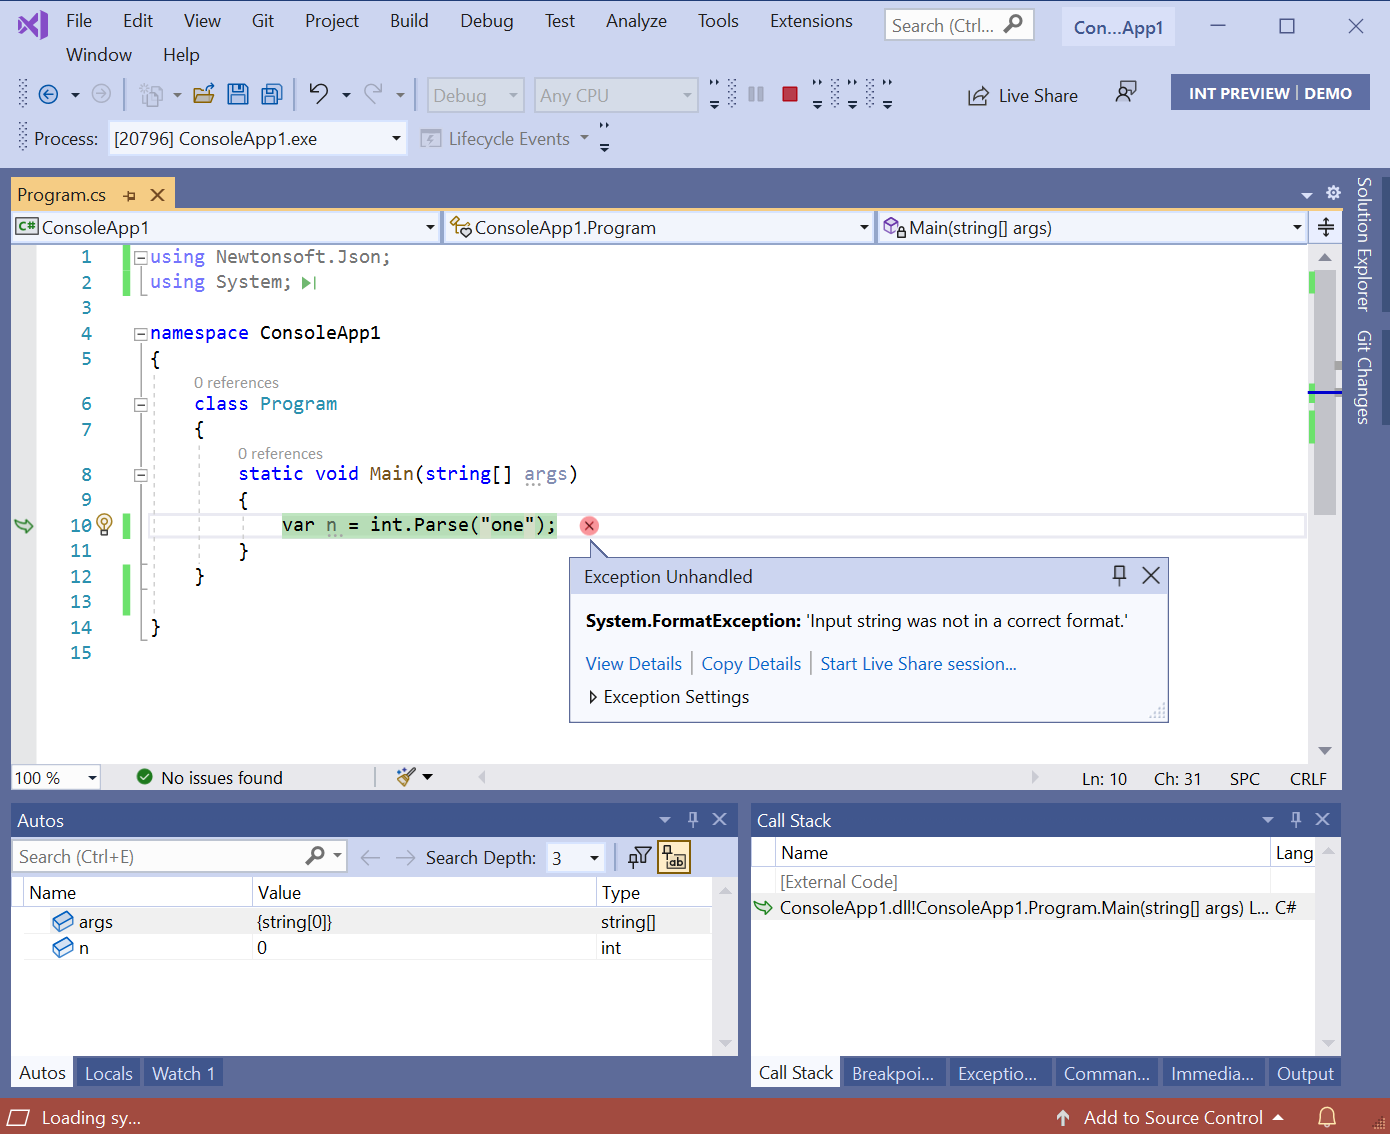
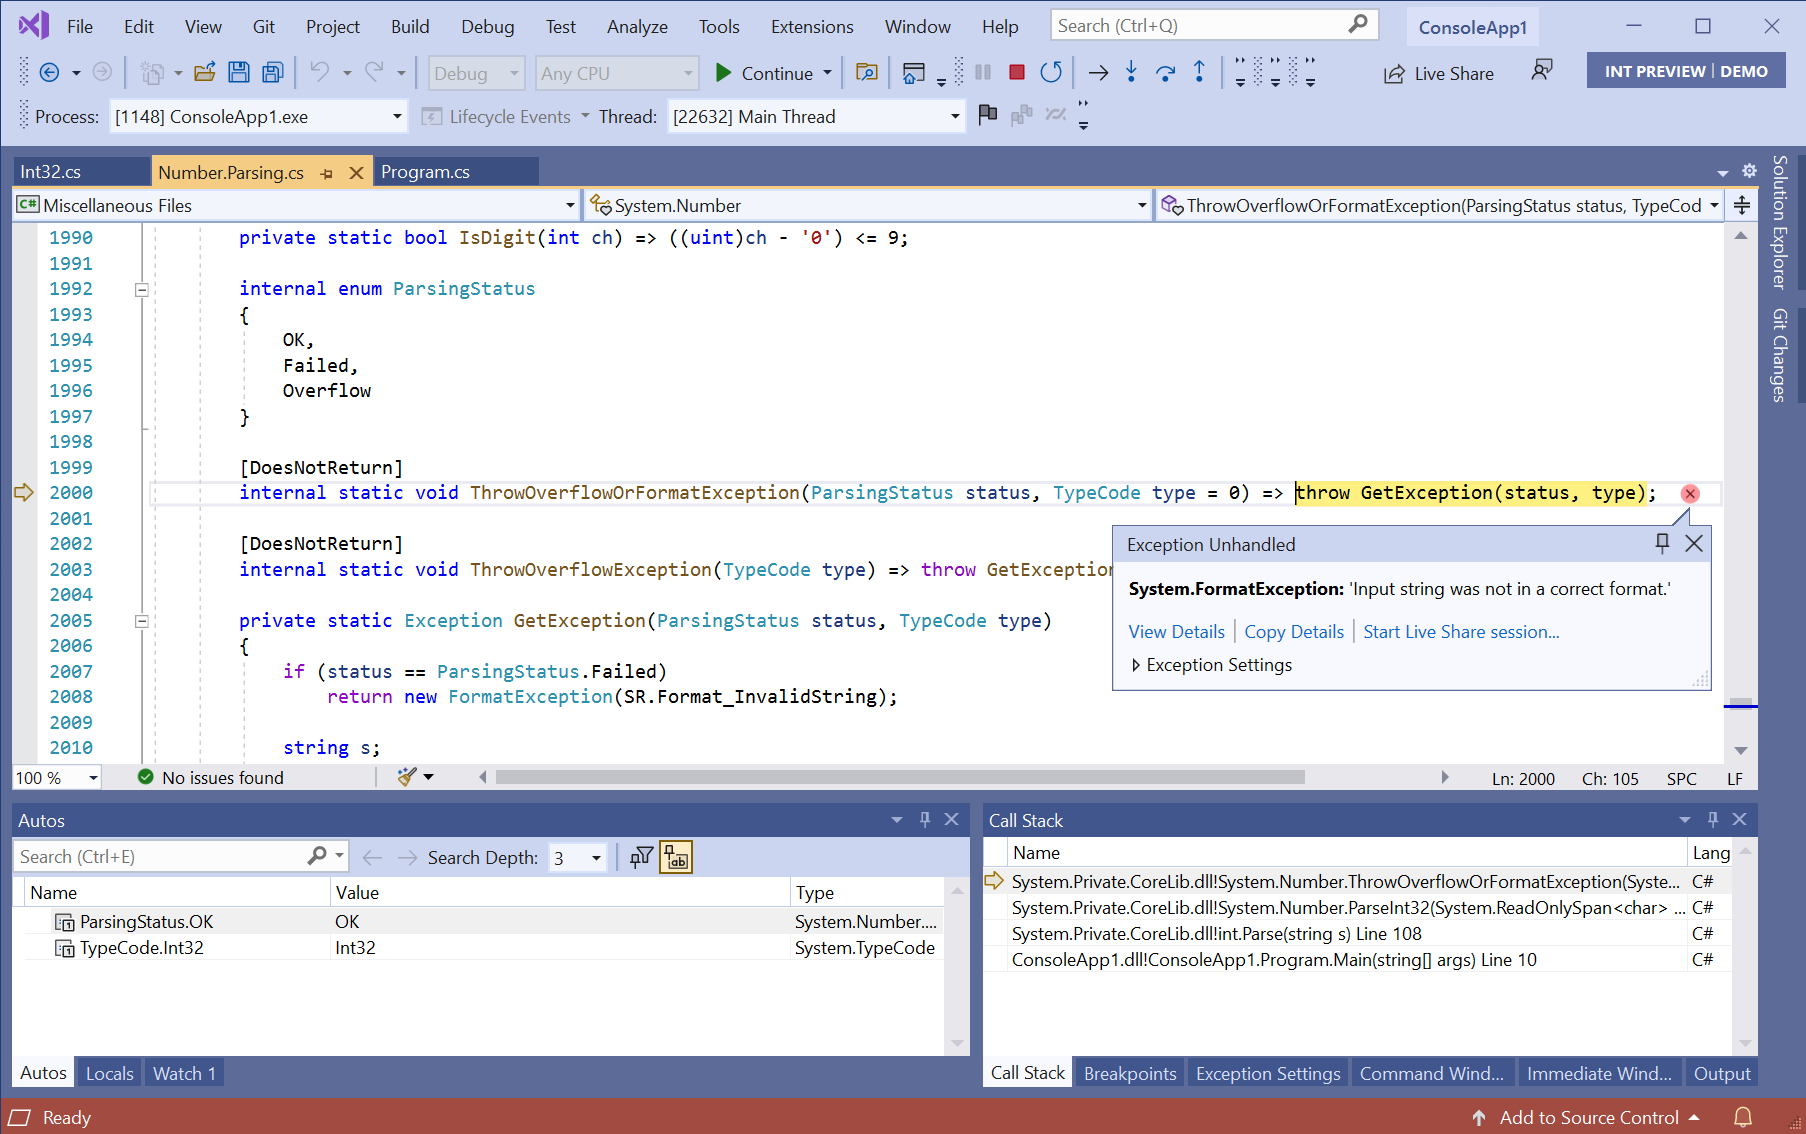
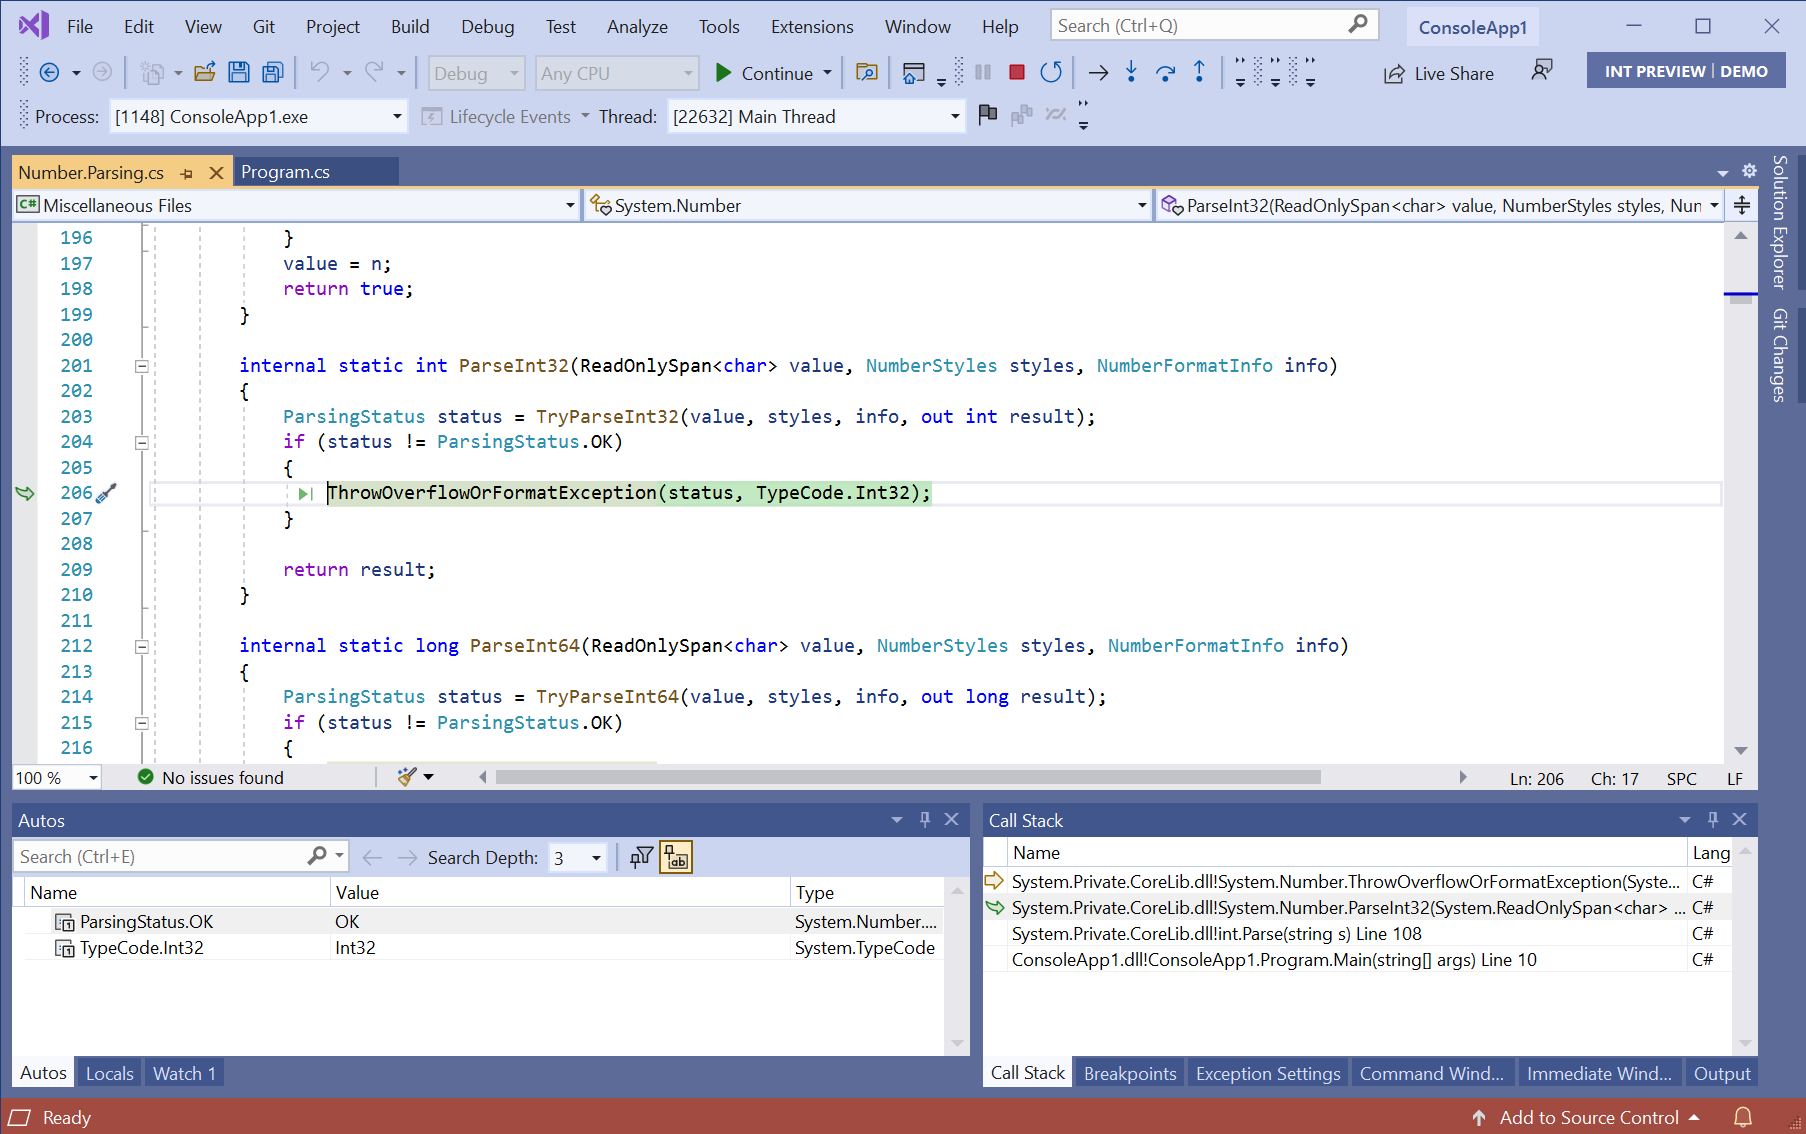
With Source Link, the debugger will take you to the spot where the exception is thrown where you can then navigate the call stack and investigate.
Enabling Source Link
As Source Link downloads source files from the internet, it’s not enabled by default. Here’s how to enable it:
Visual Studio
There are a couple steps to enable it:
- Go to Tools > Options > Debugging > Symbols and ensure that the ‘NuGet.org Symbol Server’ option is checked. Specifying a directory for the symbol cache is a good idea to avoid downloading the same symbols again.
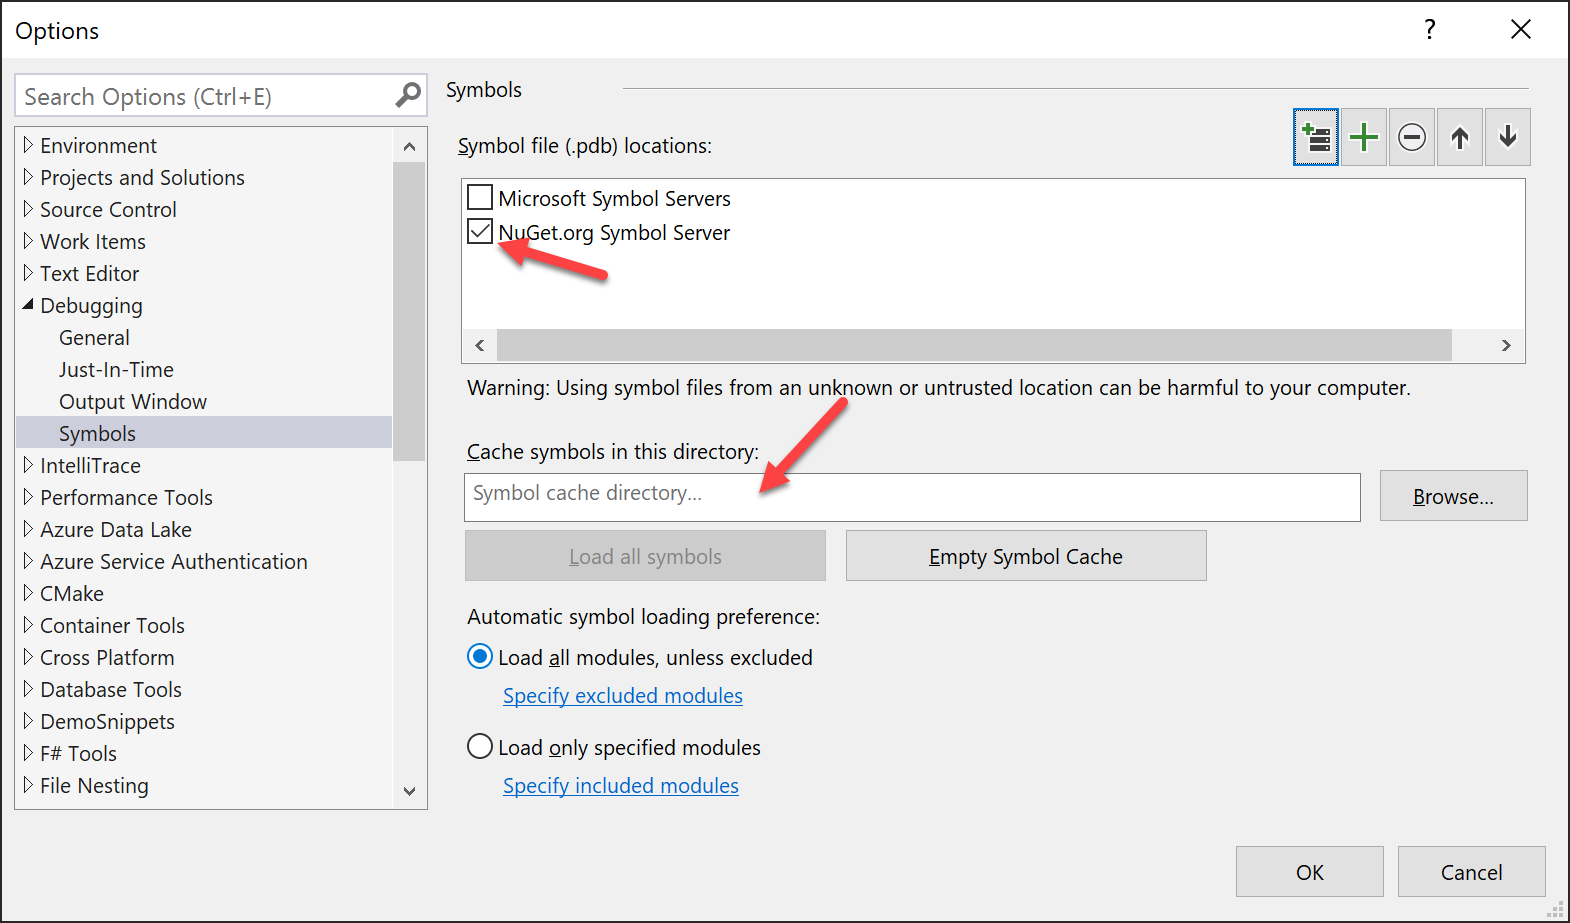 If you’d like to step into the .NET framework code, you’ll also need check the ‘Microsoft Symbol Servers’ option.
 - Disable
Just My Codein Tools > Options > Debugging > General since we want the debugger to attempt to locate symbols for code outside your solution.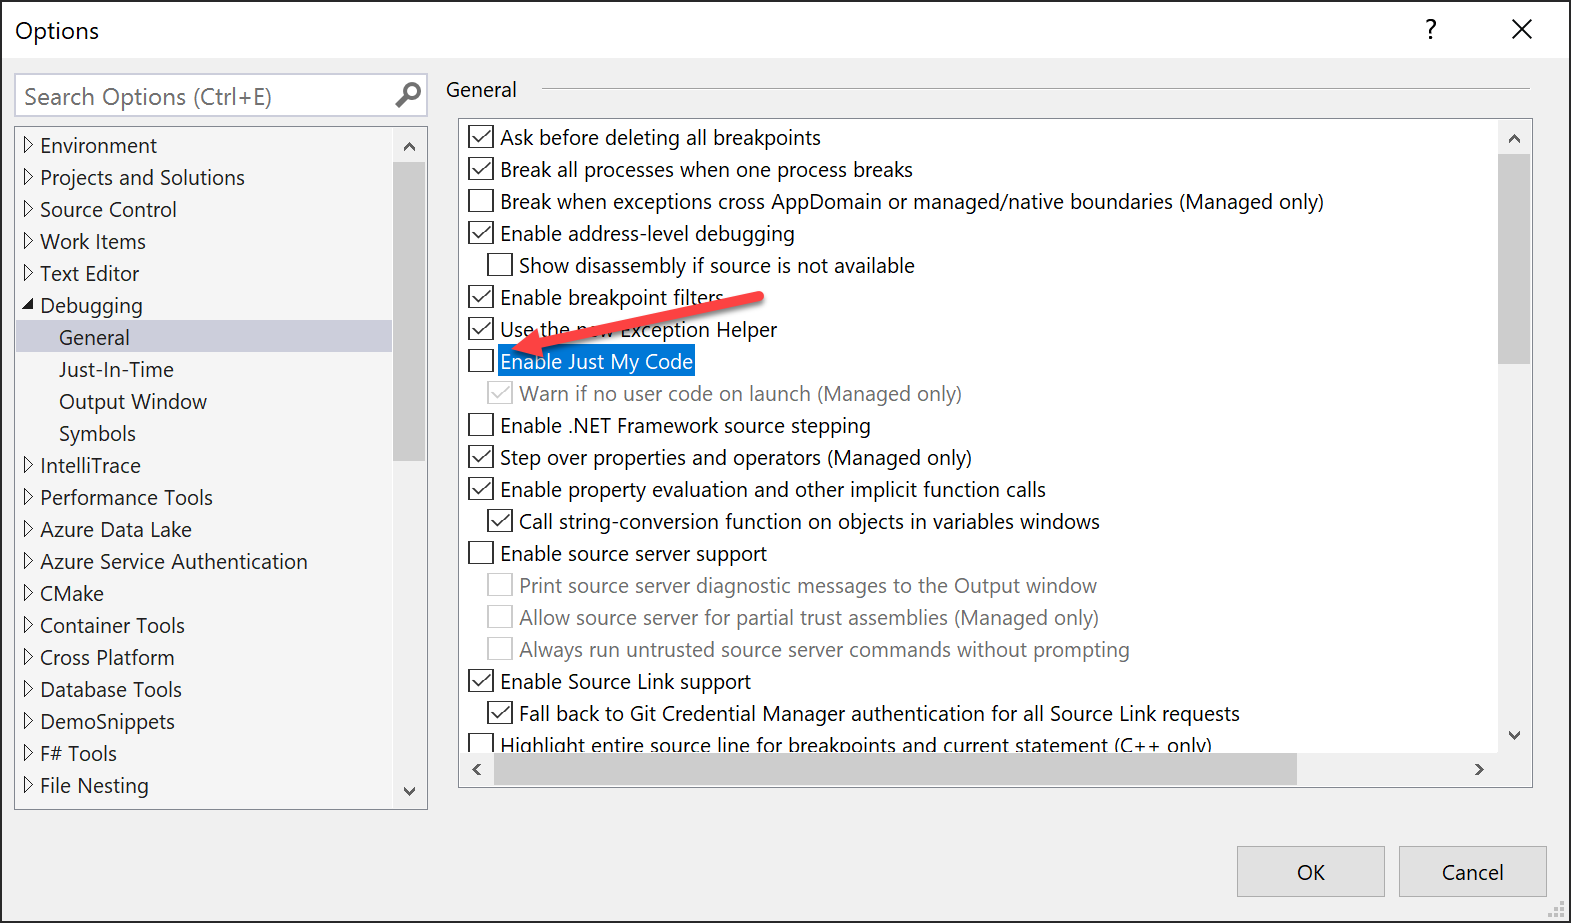 Verify that
 Enable Source Link supportis checked (it is by default). If you’d like to step into .NET Framework code, you’ll also need to checkEnable .NET Framework source stepping. This is not required for .NET Core.
Visual Studio Code
Visual Studio Code has debugger settings configured per project in the launch.json:
"justMyCode": false,
"symbolOptions": {
    "searchMicrosoftSymbolServer": true,
    "searchNuGetOrgSymbolServer": true
},
"suppressJITOptimizations": true,
"env": {
    "COMPlus_ZapDisable": "1",
    "COMPlus_ReadyToRun": "0"
}
Visual Studio for Mac
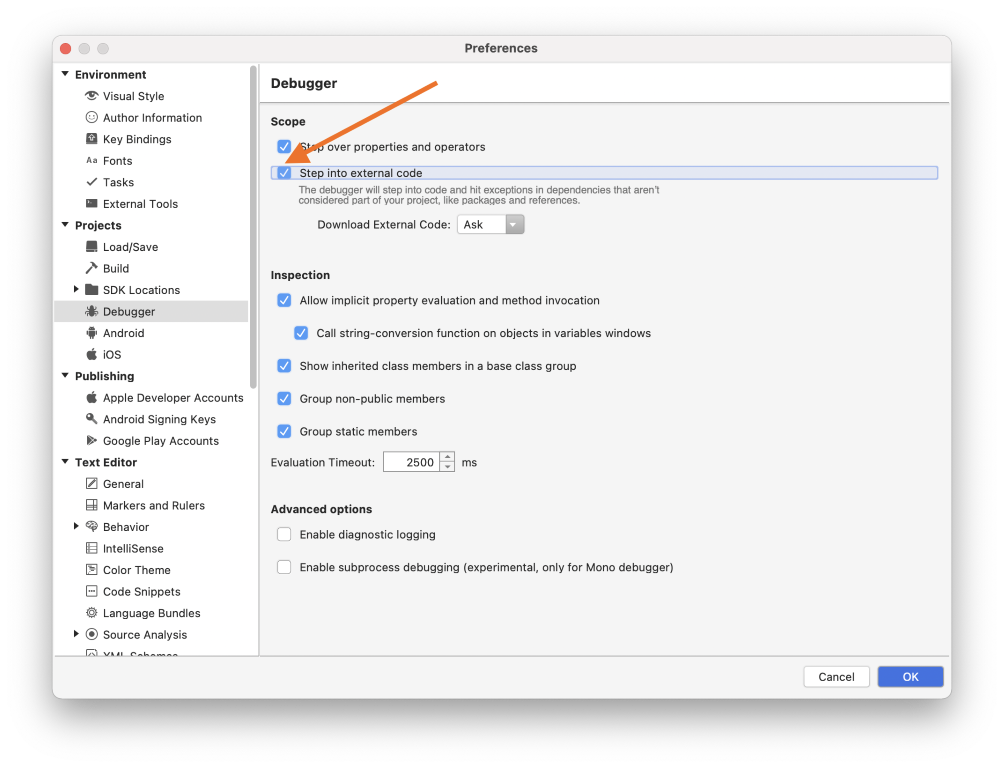
To enable Source Link in Visual Studio for Mac, go to Visual Studio > Preferences… > Projects > Debugger and ensure that the Step into external code option is checked. Click OK to save your changes.
In Visual Studio for Mac, support for symbol servers doesn’t exist yet, so Source Link only works with NuGet packages that contain their own debug symbols. If you’re interested in symbol server support, please add your vote to the symbol server suggestion on the Visual Studio Developer Community site.
Notes
A few notes:
- Not every library on nuget.org will have their .pdb files indexed. If you find that the debugger cannot find a PDB file for an open-source library you are using, please encourage the open-source library to upload their PDBs (see here for instructions).
- Most libraries on nuget.org are not ahead-of-time compiled, so if you are only trying to debug into this library and not the .NET Framework itself, you can likely omit the env section from above. Using an optimized .NET Framework will significantly improve performance in some cases.
- Only Microsoft provided libraries will have their .pdb files on the Microsoft symbol server, so you can disable that option if you are only interested in an OSS library.
In a future post we’ll show you how to create libraries and applications with Source Link enabled so your users can benefit.
 Light
Light Dark
Dark
20 comments
Hi Claire,
I’ve been using SourceLink for a few years, and it’s great. I enabled it on most of my OSS projects. However, I feel Visual Studio doesn’t fully take advantage of it: why just use it for debugging? It could also be used for code navigation.
When I use “Go to definition”, Visual Studio shows either just the signature, or decompiled sources (which, for .NET Core / .NET 5.0, typically just decompiles reference assemblies, so the implementation isn’t visible). Why not use SourceLink to download the actual source code instead? IIRC, ReSharper and Rider do this, and I’ve always been frustrated that Visual Studio doesn’t.
Hi Thomas,
There’s an issue tracking this request here: https://github.com/dotnet/roslyn/issues/24349. It looks like it’s being worked on currently based on its location in the task boards.
Thanks Claire!
Hi Claire,
I’m really looking forward to full support for Azure Dev Ops (on prem) using its native (non-git) source control to produce source link compatible pdb files. It remains unsupported and is a rather large hole in the Microsoft ecosystem. Do you have some advice as to the roadmap here? A migration to git is not in the short-term cards for us. Thanks!
This would be nice. A lot.
I wonder if this is supported on private nuget galleries or things like myget. As sometimes we would like to use source level debugging within our own private packages.
Hi Onur,
As the debugger requires symbols to be available, the way to do that in this case would be to either ensure the PDB’s are in the main NuPkg alongside the DLL’s or, better yet, use embedded pdb’s so they’re in the DLL directly. Other galleries may offer a symbol server as well and index your symbols; if they do, you’d need to follow their directions to add their symbol server to your IDE.
How do you embed pdbs in your DLL? The situation Onur describes is exactly the pain point I have in VS debugger — loading symbols for my own packages. I build much of my stuff on AppVeyor, and haven’t found a straightforward way to deal with PDBs — because of a combo of complexity on the NuGet.org side, a lot of runaround in AppVeyor’s many settings, and the “source not found” message that VS displays if some hidden build hash mismatches some other hidden value somewhere. It sounds like embedding symbols would be the best thing, but that option is not jumping out at me. I would expect to see something for that on the project properties window in VS where you indicate that you want to create package on build, the checkbox at very top of that page.
You can embed your PDB / debug symbols in your DLL by putting this code in the project file.
Maybe the second line implies the first, but both lines are definitely sufficient. I first figured this out here.
i live and die by the https://marketplace.visualstudio.com/items?itemName=SamHarwell.JustMyCodeToggle extension so i don’t have to dive through dozens of menus to toggle just my code.
also i occasionally find that the source doesnt “line up” with the execution, methods are skipped or lines are off. This is often with azure code libs produced by MS…what are we supposed to do to fix that?
The post is talking about .NET Framework a lot, while the tags are referencing .NET Core.
Is this supported both in .NET Framework and .NET Core/NET 5?
I proofed that it works with a .net core console app referencing a .net standard 2.0/.net 5 nuget package.
Hi Claire,
the source link feature is a really nice thing that nuget.org offers!
But I really wonder why Azure artifacts is so much behind that experience for debug symbols hosting!
I know that TFS server always had its own (highly proprietary) way of hosting debug symbols. Several years after nuget.org, It still lacks snuget package symbols support entirely. This is disappointing and seems to be contractory to microsofts advertised ‘open source’ approach.
Do you know if there is a plan to change that?
Here are the docs, for the curious:
https://docs.microsoft.com/de-de/nuget/create-packages/symbol-packages-snupkg
Yes, this. I’d love to use Source Link for internal packages, but Microsoft’s own Azure DevOps NuGet feeds don’t support it and the documentation is confusing.
I would love to see how to use sourcelink to split up my application into separate nuget packages but still be able to debug.
Hi Claire,
Awesome stuff! Does this work for UWP as well?
Suggest that just enable symbols automatically load just for the modules you wanna debug with, or it’ll be quite slow when application startup
Hello Claire,
I think SourceLink is a great feature. At the same time, I unsure which use cases it best solves and which uses cases are better solved in other ways. The other solution I know of (which is related to your response to Onur) is to embed the source in the DLL. This can be achieved with this code in the project file.
I first figured this out here.
What are the tradeoffs between these two solutions? I am most interested in the biggest advantage of Source Link over embedding the source for an open source project.
Here is my best understanding of the tradeoffs, but I could be wrong, so please correct me if am mistaken. Embedding the source is simpler. It doesn’t require a network or internet connection. It doesn’t require any configuration to specify the location of the source code repository and symbol server. One advantage of Source Link is that you can give the same DLL to trusted and untrusted users and only the trusted users are able to use Source Link to obtain the source. This advantage doesn’t exist for an open source project, which definitely includes .NET Core and maybe even .NET Framework since reference source exists. Another disadvantage is larger DLLs, but I don’t know how much larger. I don’t expect that I would notice the difference in size. A possible disadvantage of embedding the source causes slower execution, but I am not sure about that. I certainly have never proved with benchmark tests that embedding the source causes slower execution.
I am very interested to hear your thoughts on this Claire.