IL Stub Diagnostic Tool
The IL Stub Diagnostic Tool enables real-time inspection of the contents of IL stubs. Developers now have a powerful tool to troubleshoot issues in interop marshalling,
Introduction
Jesse posted a great blog talking about the concept, history, and improvements of Intermediate Language (IL) stubs for CLR v4. He mentions
The remainder of this post continues the discussion that Jesse started in the “Easier Debugging” section of his blog.
Get the tool
You are encouraged to download the tool from CodePlex.
Usage of the IL Stubs Diagnostics Tool
To begin using the tool, follow these basic steps:
1) Launch the IL Stub Diagnostic tool. Note: you need to be an administrator of the machine because the tool utilizes the Event Tracing for Windows (ETW) feature to receive ETW events.
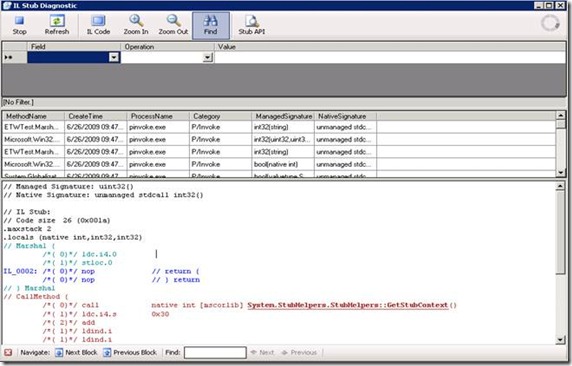
There are three key features of the tool:
· Starting and Controlling the IL stubs monitoring session
The upper-left button, Start, is the most important aspect of starting a session. After clicking the Start button, the tool begins monitoring all the stubs generated by CLR on the machine. It will keep monitoring the IL stubs until you click it again (i.e., Start button will turn to Stop after it is clicked).
· Filtering to find a specific IL Stub
The IL Stub List section shows all the IL stubs collected by the tool. Sometimes you will receive a huge number of stubs. In this case, you can set several filters using the Filters feature to find the exact stub.
· Navigating and Inspecting the contents of an IL Stub
Once you find the IL Stub, the contents of it (the IL code) will be shown in the IL Code section. We provide some features like navigation to help you read and understand the IL code.
2) Start monitoring IL stubs by clicking the Start button.
3) Run a program involving interop. For example, the sample program samplepinvoke.exe, which is included with the tool on CodePlex, generates a p/invoke from managed code to native code. Running this sample from the command line will generate several entries in the IL Stub List section. We will use this for illustration purposes below.
In this example, each item represents an IL Stub. Select an entry and notice its corresponding IL code shown in the IL Code Section.
Features which Enable Inspection and Navigation of IL Stubs
IL Stubs are generated on the fly by the CLR for Interop, and bridge the gap between managed and native methods. Since they are dynamically generated, it is difficult for developers to investigate or troubleshoot issues because the stubs are further JIT-compiled into machine code. The IL Stub Diagnostic tool eases the interop debugging experience by enabling the inspection of every stub. Let’s take a look at some of the key features which enable the inspection and navigation of IL stubs.
Detailed information of IL Stub
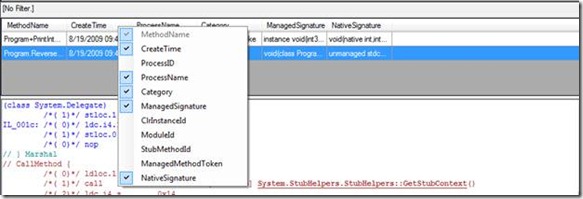
By default, the tool shows the following categories for each IL stub: MethodName, CreateTime, ProcessName, Category, ManagedSignature and NativeSignature. These categories are important for developers to identify an IL stub. In special cases (e.g., debugging with windbg), developers may also be interested in information like ModuleId and ManagedMethodToken. These are available by right clicking the table header of the IL Stub list.
IL Stub Filters
You may find that the CLR generates a lot of IL Stubs during the execution of a managed program. To quickly locate the stub we’re seeking, filters can be set to reduce the number of IL stub entries in the IL Stub list. Using the pinvoke.exe sample (included with the tool on CodePlex), you can use the following filter:
Once the filter has been entered, click the Refresh button to obtain the filtered list.
To remove a filter, you can right click on the row header of the first filter condition and select Delete Filter. It will take effect after clicking Refresh button.
Navigation buttons for IL Stub code
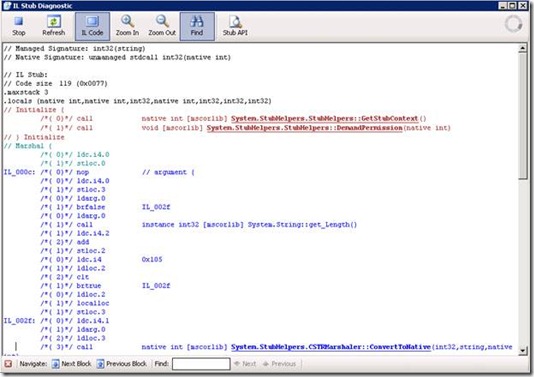
The code may not be well-formatted for first time display. To make the code more reader-friendly, the tool provides navigation buttons that allow you to view the code block by block. As you can see, each IL stub contains the following color-coded blocks: Initialize, Marshal, the calling method, and Unmarshal blocks. In the IL code, StubHelpers are used to do some complex work. Most of the functionality of each stub helper can be figured out by its name. The tool also provides a Stub API button to look up its usage.
Please note that stub helpers are internal to the runtime and their names/signatures/description should only be used for informational purposes. We may change any of these in the next version of the CLR so no one should establish any dependencies on them.
Troubleshooting marshalling issues with IL Stub Diagnostic tool
As mentioned earlier, developers can use the tool to investigate and debug marshalling issues. Here is an example.
Case description
There is an issue with the following p/invoke scenario. The signature of the native method is:
void DumpString(WCHAR *pStr)
{
printf(“%ws”, pStr);
}
In managed code, we declare it as:
[DllImport(“testNative.dll”)]
public static extern void DumpString(string str);
When invoking from managed side with the following code, it shows nothing on the console.
DumpString(“Hello World”);
Our job is to discover what happens during the p/invoke call.
Troubleshooting
Since the native code simply dumps the string, the problem must be occuring during the marshaling phase.
First, locate the stub by following these steps:
1. Launch IL Stub Diagnostic tool.
2. Click Start Button.
3. Run the program again.
4. Set the following filter as shown below and click the Refresh button.
Next, navigate to the block of code which handles the marshaling by following these steps:
1. Click the “IL Code” button to get a bigger view.
2. Click the “Next Block” and navigate to the Marshal block.
3. Usually, StubHelpers APIs are the most informational code here. Move the mouse over it to see the explanation of the method (shown in the green box below):
4. The description tells us that the StubHelpers method is used to convert an Ansi string. However, our native method expects a WCHAR string, which results in the marshaling issue. The fix is to specify Unicode, as the highlighted code below.
[DllImport(“testNative.dll”, CharSet=CharSet.Unicode)]
public static extern void DumpString(string str);
Summary
As you can see, the IL Stubs Diagnostic Tool provides a window into what used to be a black box, and allows you to look into the very core of interop marshaling – the IL Stub itself.
Acknowledgements
We would like to specially thank Yifeng Fu for being one of the key developers of IL Stub Diagnostic tool during his internship with us.
See Also
The MSDN topic “MSIL Stub Customization” contains detailed reference and usage information.
Yongtai Zhu,
Developer, CLR.


 Light
Light Dark
Dark
0 comments