
GC Perf Infrastructure – Part 1
We open sourced our new GC Perf Infrastructure! It’s now part of the dotnet performance repo. I’ve been meaning to write about it ‘cause some curious minds had been asking when they could use it after I blogged about it last time but didn’t get around to it till now.
First of all, let me point out that the target audience of this infra, aside from the obvious (ie, those who make performance changes to the GC), are folks need to do in-depth analysis of GC/managed memory performance and/or to build automation around it. So it assumes you already have a fair amount of knowledge what to look for with the analysis.
Secondly, there are a lot of moving parts in the infra and since it’s still under development I wouldn’t be surprised if you hit problems when you try to use it. Please be patient with us as we work through the issues! We don’t have a whole lot of resources so we may not be able to get to them right away. And of course if you want to contribute it would be most appreciated. I know many people who are reading this are passionate about perf analysis and have done a ton of work to build/improve perf analysis for .NET, whether in your own tooling or other people’s. And contributing to perf analysis is a fantastic way to learn about GC tuning if you are looking to start somewhere. So I would strongly encourage you to contribute!
Topology
We discussed whether we wanted to open source this in its own repo and the conclusion we wouldn’t mostly just due to logistics reasons so this became part of the perf repo under the “src/benchmarks/gc” directory (which I’ll refer to as the root directory). It doesn’t depend on anything outside of this directory which means you don’t need to build anything outside of it if you just want to use the GC perf infra part.
The readme.md in the root directory describes the general workflow and basic usage. More documentation can be found in the docs directory.
There are 2 major components of the infra –
Running perf benchmarks
This runs our own perf benchmarks – this is for folks who need to actually make perf changes to the GC. It provides the following functionalities –
- Specifying different commandline args to generate different perf characteristics in the tests, eg, different surv ratios for SOH/LOH and different pinning ratios;
- Specifying builds to compare against;
- Specifying different environments, eg, different env vars to specify GC configs, running in containers or high memory load situations;
- Specifying different options to collect traces with, eg, GCCollectOnly or ThreadTime.
You specify all these in what we call a bench file (it’s a .yaml file but really could be anything – we just chose .yaml). We also provide configurations for the basic perf scenarios so when you make changes those should be run to make sure things don’t regress.
You don’t have to run our tests – you could run whatever you like as long as you can specify it as a commandline program, and still take advantage of the rest of what we provide like running in a container.
This is documented in the readme and I will be talking about this in more detail in one of the future blog entries.
Source for this is in the exec dir.
Analyzing perf
This can be used without the running part at all. If you already collected perf traces, you can use this to analyze them. I’d imagine more folks would be interested in this than the running part so I’ll devote more content to analysis. In the last GC perf infra post I already talked about things you could do using Jupyter Notebook (I’ll be showing more examples with the actual code in the upcoming blog entries). This time I’ll focus on actually setting things up and using the commands we provide. Feel free to try it out now that it’s out there.
Source for this is in the analysis dir.
Analysis setup
After you clone the dotnet performance repo, you’ll see the readme in the gc infra root dir. Setup is detailed in that doc. If you just want the analysis piece you don’t need to do all of the setup steps there. The only steps you need are –
- Install python. 3.7 is the minimal required version and recommended version. 3.8 has problems with Jupyter Notebook. I wanted to point this out because 3.8 is the latest release version on python’s page.
- Install the python libraries needed – you can install this via “py -m pip install -r src/requirements.txt” as the readme says and if no errors occur, great; but you might get errors with pythonnet which is mandatory for analysis. In fact installing pythonnet can be so troublesome that we devoted a whole doc just for it. I hope one day there are enough good c# charting libraries and c# works in Jupyter Notebook inside VSCode so we no longer need pythonnet.
- Build the c# analysis library by running “dotnet publish” in the src\analysis\managed-lib dir.
Specify what to analyze
Let’s say you’ve collected an ETW trace (this can be from .NET or .NET Core) and want to analyze it, you’ll need to tell the infra which process is of interest to you (on Linux you collect the events for the process of interest with dotnet-trace but since the infra works on both Windows and Linux this is the same step you’d perform). Specifying the process to analyze means simply writing a .yaml file that we call the “test status file”. From the readme, the test status file you write just for analysis only needs these 3 lines –
success: true
trace_file_name: x.etl # A relative path. Should generally match the name of this file.
process_id: 1234 # If you don’t know this, use the print-processes command for a list
You might wonder why you need to specify the “success: true” line at all – this is simply because the infra can also be used to analyze the results of running tests with it and when you run lots of tests and analyze their results in automation we’d look for this line and only analyze the ones that succeeded.
You may already know the PID of the process you want to analyze via other tools like PerfView but we aim to have the infra used standalone without having to run other tools so there’s a command that prints out the PIDs of processes a trace contains.
We really wanted to have the infra provide meaningful built-in help so when you wonder how to do something you could generally find it in its help. To get the list of all commands simply ask for the top level help in the root dir –
C:\perf\src\benchmarks\gc>py . help
Read README.md first. For help with an individual command, use py . command-name --help. (You can also pass --help --hidden to see hidden arguments.)
run commands
[omitted]
analysis commands
Commands for analyzing test results (trace files). To compare a small number of configs, use diff. To compare many, use chart-configs. For detailed analysis of a single trace, use analyze-single or chart-individual-gcs.
analyze-single: Given a single trace, print run metrics and optionally metrics for individual GCs.
analyze-single-gc: Print detailed info about a single GC within a single trace.
[more output omitted and did some formatting of the output]
(I apologize for the formatting – it amazes me that that we don’t seem to have a decent html editing program for blogging and writing a blog mostly consists of manually writing html ourselves which is really painful)
As the top level help says you can get help with specific commands. So we’ll follow that suggestion and do
C:\perf\src\benchmarks\gc>py . help print-processes
Print all process PIDs and names from a trace file.
| arg name | arg type | description |
|---|---|---|
| –name-regex | any string | Regular expression used to filter processes by their name |
| –hide-threads | true or false | Don’t show threads for each process |
[more output omitted; I also did some formatting to get rid of some columns so the lines are not too long]
As an example, I purposefully chose a test that I know is unsuitable to be run with Server GC ‘cause it only has one thread so I’m expecting to see some heap imbalance. I know the imbalance will occur when we mark older generation objects holding onto young gen objects so I’ll use the chart-individual-gcs command to show me how long each heap took to mark those.
C:\perf\src\benchmarks\gc>py . chart-individual-gcs C:\traces\fragment\fragment.yaml –x-single-gc-metric Index –y-single-heap-metrics MarkOlderMSec
This will show 8 heaps. Consider passing --show-n-heaps.
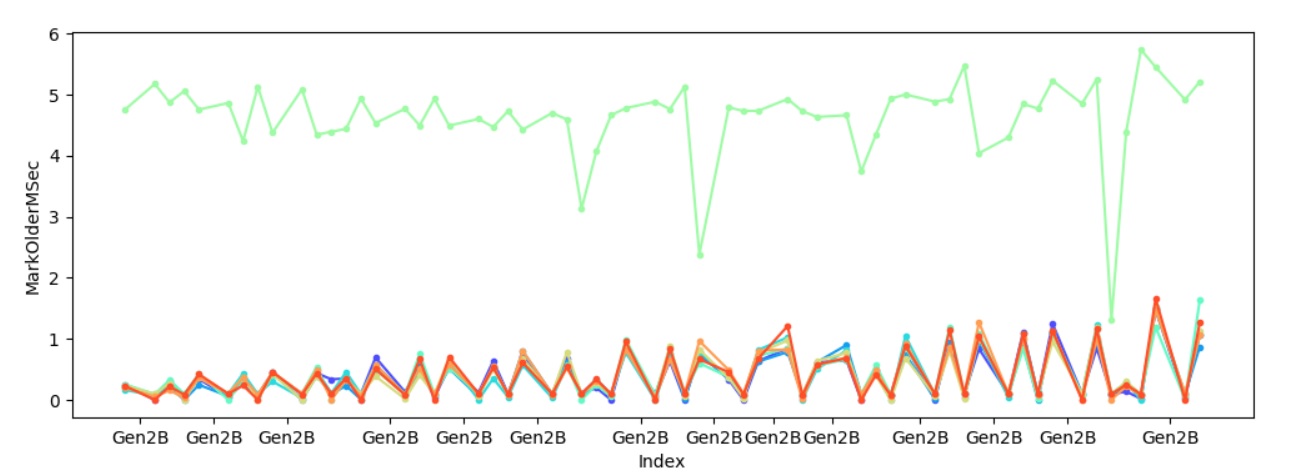
Sure enough one of the heaps always takes significantly longer to mark young gen objects referenced by older gen objects, and to make sure it’s not because of some other factors I also looked at how much is promoted per heap –
C:\perf\src\benchmarks\gc>py . chart-individual-gcs C:\traces\fragment\fragment.yaml –x-single-gc-metric Index –y-single-heap-metrics MarkOlderPromotedMB
This will show 8 heaps. Consider passing --show-n-heaps.
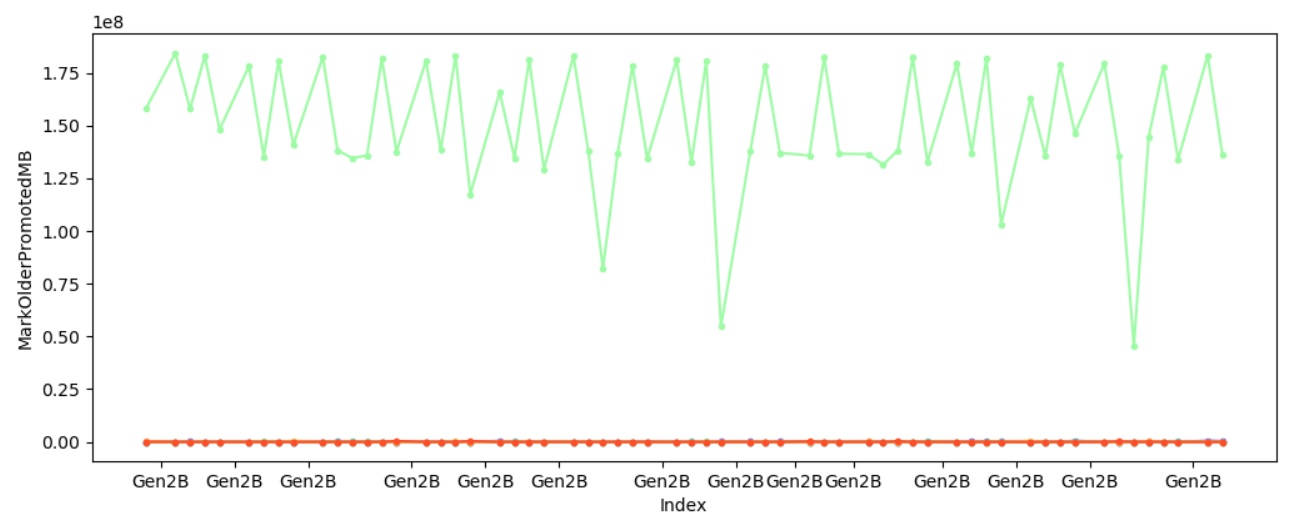 This confirms the theory – it’s because we marked significantly more with one heap which caused that heap to spend significantly longer in marking.
This trace was taken with the latest version of the desktop CLR. In the current version of coreclr we are able to handle this situation better but I’ll save that for another day since today I wanted to focus on tooling.
There’s an example.md that shows examples of using some of the commands. Note that the join analysis is not checked in just yet – the PR is out and I wanted to spend more time on the CR before merging it.
 Light
Light Dark
Dark
2 comments
Will there be any “BIG” changes to be added/introduced to GC?
Such as arena, user-defined heaps/regions, reference counting, manual memory management, new GC technologies like Java’s ZGC/Zing(Azul C4) and so on.
i agree