Just My Code for JavaScript Windows Store Apps in Visual Studio 2013
If you’ve ever debugged a JavaScript Windows Store app there’s a very good chance that you accidentally ended up in either “Function code [dynamic]” or “base.js” without knowing how you got there and with no clear way to get back out. To help address this, we’ve introduced a feature called “Just My Code” (JMC) for JavaScript in Windows Store apps which is now available in Visual Studio 2013.
Those who have debugged C# or Visual Basic code in Visual Studio have likely already benefitted from this debugger feature that helps you focus on your code and abstracts the implementation details of the underlying framework. To better understand how JMC works we’ll walk through a very simple example, then discuss some of the finer points of how it behaves, and finally I’ll show you how you can customize the behavior.
Why Just My Code
To start, I’ll demonstrate the behavior when Just My Code is disabled. To this I’ll create a new JavaScript Windows Store Blank app called App1. Then inside the activated event handler I’ll add the following code snippet to try to open a file from the pictures folder (also adding the “Pictures Folder” capability to the app’s manifest)
// TODO: This application has been newly launched. Initialize
// your application here.
Windows.Storage.KnownFolders.picturesLibrary.getFileAsync("doesNotExist.png").then(
    function (file) {  //handle the success case
        return file.name + " was opened successfully";;
    },
    function (e) {  //handle the error case
        return e.message;
    }).done(function (message) {   // run after either success or error
        var result = message;
    });
Next I put breakpoints inside the success and error functions, and when I start debugging I’ll hit the breakpoint in the error function.

Now what I want do to is step to the “var result = message;” line in the .done() function. So I press F10 (Step Over) twice and all of the sudden I’m in code I don’t recognize in a document titled “Function code [dynamic]”
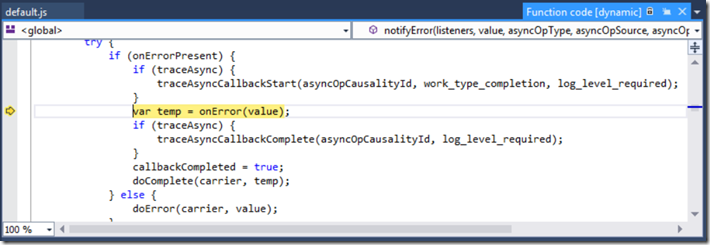
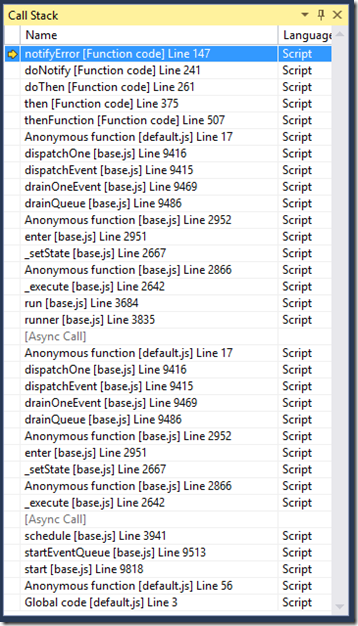
In an effort to get back where I came from and just put a breakpoint on the line I intended to get to, I look at the Call Stack window. Here I see an incredibly long call stack with code that is mostly framework code.
Just My Code at Work
Now let’s try the same scenario only this time with Just My Code enabled (which it is by default in VS2013). I’ll start debugging again and I hit the same breakpoint in the error handling function and press F10 twice, this takes me out of the error handling function instead of into “Function code [dynamic]”

A single press of F11 (Step Into) then lands me in the .done() function as I would expect

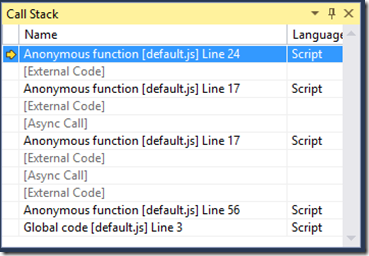
Also when I look at the Call Stack window I can see that all of the frames in “Function code” and base.js have been collapsed into the “[External Code]” meta-frame so I only see frames for code that I control.
Just My Code Details
As we saw in the simple example above, Just My Code helps developers focus on their code while debugging. Now let’s dig into some of the details of how exactly Just My Code will behave when debugging.
What is My Code?
The first important thing to understand about Just My Code is what exactly is considered my code (also referred to as “user code”). When JMC is enabled, code is classified into three categories:
- **My Code: **Code that you own and control****
- **Libraries: **Is intended for libraries that you use regularly and your application relies on to function correctly (for example WinJS or jQuery). ****
- **Unrelated: **Is intended for code that that may be running in your application, but you don’t own and your application doesn’t directly rely on it to function correctly (e.g. an advertising SDK that displays ads)****
By default in Windows Store apps, the following code is considered to be “Library” code:
- Any file that is in a framework reference, for example files from the WinJS library
- Any file that matches “*.min.js” as part of the name
- Code created by passing a string into the “Function() constructor()
Finally in Windows Store apps, any code that is loaded into your app from an HTTP or HTTPS URI is considered “Unrelated”. All other code is considered user code. Later we’ll look at how to configure this behavior.
Debugging Behavior Details
In the example above, we saw how JMC affects debugger stepping by keeping it in my code and the call stack filtering. Now we’ll discuss how JMC will affect other debugging behaviors.
Stepping
Just My Code has the following effects on stepping behavior:
- “Step Into” will be treated as “Step Over” if tried on a function that isn’t my code
- If a step begins in non-user code, this could occur for example if you set and hit a breakpoint in Library code, then stepping temporarily behaves as if JMC is not enabled. As soon as you are back in user code, stepping will behave like JMC is enabled once again
-
When a step results in leaving the current execution context (e.g. doing a step on the last line of an event handler) the next time the debugger stops is the next time a line of use code executes (i.e. if a callback executes in Library code the debugger will not stop).
-
The exception to this as described above is if the step was performed in non-user code then the debugger will stop on the next line of code executed regardless of its JMC classification
-
“Step Out” will stop on the next line of user code. If no user code is encountered then this becomes equivalent to a continue operation.
Exceptions
Just My Code also affects how the debugger will behave when an exception is thrown.
-
If an unhandled exception occurs in:
-
User or Library code the debugger will break
-
Unrelated code and:
-
User or Library code is on the call stack, the debugger will break
-
No User or library code is on the call stack. The debugger will not break.
-
If first chance exceptions are enabled, and an exception is thrown in:
- Library or Unrelated code and handled the debugger will not break (e.g. jQuery will throw and handle exceptions when doing browser detection logic)
- Library or Unrelated code but not handled before propagating back to user code, the debugger will break.
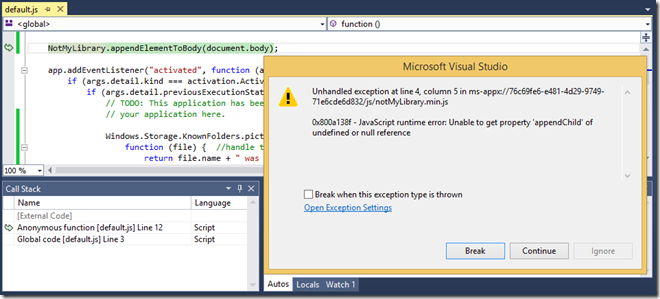
To see this in practice let’s look at an example. For the purpose of this example I placed the following code in a file called “notMyLibrary.min.js” so it will be considered library code by default.
var NotMyLibrary = function () { }
NotMyLibrary.appendElementToBody = function (element){
    document.body.appendChild(element);
}
Now in in my default.js file I’ll call
NotMyLibrary.appendElementToBody(document.body);
When I start debugging, the debugger breaks in default.js where I made this call but this time it highlights the line green instead of yellow. The green indicates that it has taken me to the last place in my code that is on the call stack which caused the exception even though the exception was not thrown in my code. The Call Stack window shows me the same thing. I can see that external code is on the call stack above my code, but the green arrow points to my code that called into the external code that resulted in the unhandled exception.
Breakpoints
Finally breakpoint behavior is as follows:
- Breakpoints that have been set in any code will always be hit regardless of the JMC classification of that code
-
If the debugger keyword is encountered in:
-
Library code. The debugger stops in that library code.
- Unrelated code The debugger will not stop
Call Stack
The example in the beginning of the post showed how Just My Code collapses non-user code on the call stack into [External Code]. If I want to temporarily see the full call stack without the need to disable Just My Code, I can right click in the call stack window and choose “Show External Code”
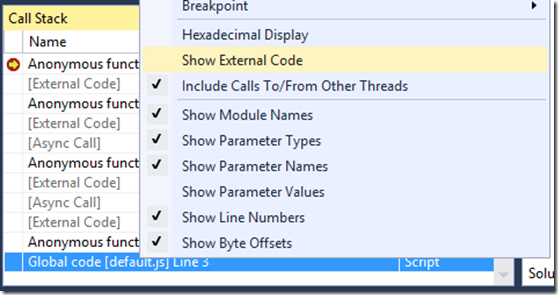
- This setting remains set on the call stack window until I manually change it
- It won’t disable Just My Code, meaning none of the stepping, exception, or breakpoint behaviors will be affected.
Turning Just My Code On or Off
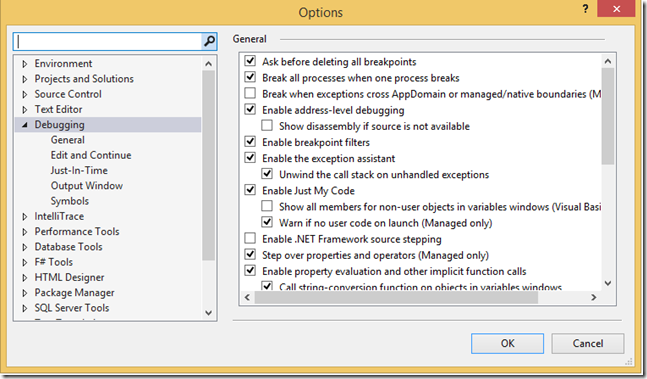
The good news is that JMC is on by default, but it can be turned on or off by going to Tools -> Options -> Debugging and checking or unchecking the “Enable Just My Code” checkbox (this checkbox governs the behavior for .NET and C++ Just My Code as well).
Customizing Just My Code
You may have noticed that when describing what is considered my code, I used the term “by default” several times. This is because we have included the ability to customize what is considered my code and what is not. This can be done by adding a file named “mycode.json” to the root of the project.
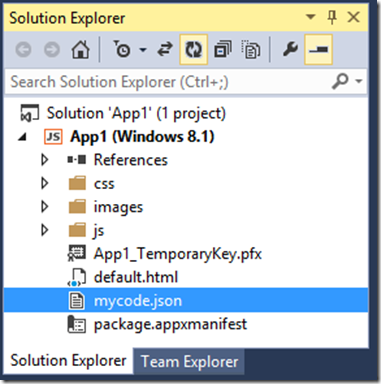
This .json file has three sections, (MyCode, Libraries, and Unrelated) that allow you to override the default behavior by manually categorizing code for that project. If you are interested the default file is located at %ProgramFiles(X86)%Microsoft Visual Studio 12.0JavaScriptJustMyCodemycode.default.wwa.json and has the following contents:
{
    "Eval" : "MyCode",
    "Function" : "Library",
    "ScriptBlock" : "Unrelated",
    "MyCode" : [
    ],
    "Libraries" : [
        "*.min.js"
    ],
    "Unrelated" : [
    ]
}
In the above file, the top three properties “Eval”, “Function”, and “ScriptBlock” are how you want that type of code to be classified, where the options are “MyCode”, “Library”, or “Unrelated”
- Eval is code created using “eval()”
- Function represents dynamic functions
- **ScriptBlock **is code defined in

 Light
Light Dark
Dark