JSON Debugger Visualizer in Visual Studio 2013
We are proud to announce the addition of JSON Visualizer to Visual Studio debugger in the Update 2 for Visual Studio 2013. JavaScript Object Notation or JSON is a popular format for transmitting data between server and client applications. The new debugger string visualizer displays JSON encoded strings in a treeview control and allows meaningful user interaction like search and highlight, copy key value pairs and copy path.
Getting to the JSON Visualizer
The new JSON visualizer will appear alongside other string visualizers currently available in Visual Studio. These visualizers are accessible through the various places where you can inspect variables, e.g. magnifying glass icon in a DataTip, in a debugger variables window (Autos, Locals, or Watch), or in a QuickWatch dialog box.
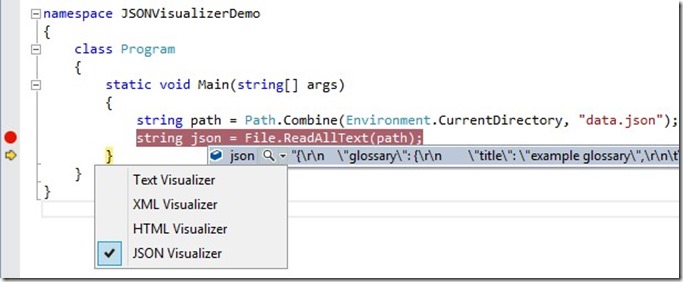
Figure 1 shows how to get to the JSON Visualizer through DataTips.
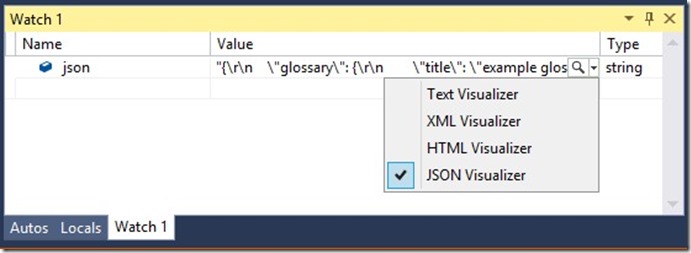
Figure 2 shows how to get to the JSON Visualizer through Watch window.
Using the JSON Visualizer
Currently, an inconvenient way to investigate JSON is to copy the JSON text from the Text visualizer and paste it in Notepad and then use Ctrl+F to search through and make structural sense. Now with the JSON visualizer you will not need to leave Visual Studio to inspect any JSON payload.
Here is the sample JSON visualized by the Visual Studio JSON Visualizer with all the nodes manually expanded by the user.
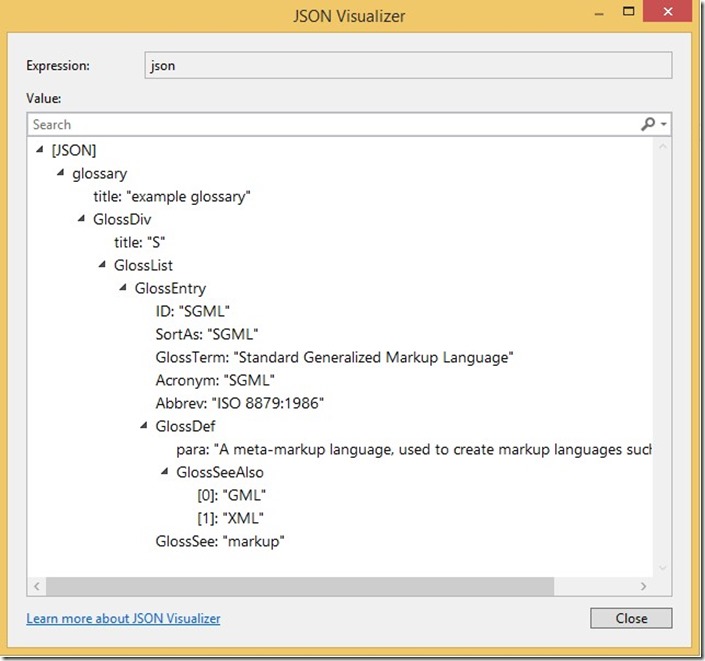
Figure 3 shows the sample JSON viewed in the JSON Visualizer.
In the default view of the JSON visualizer, the parent object node labeled [JSON] is always expanded and all other nodes are collapsed. You can expand and collapse all the nodes at your will.
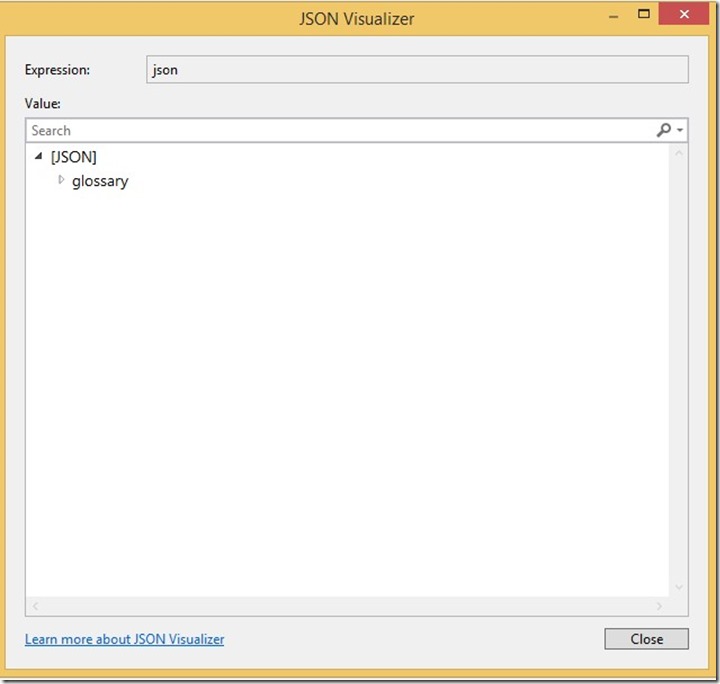
Figure 4 shows the default view of a JSON string being visualized in the JSON Visualizer.
In case the string is not in valid JSON format the visualizer shows an error message and displays the string in plain text.
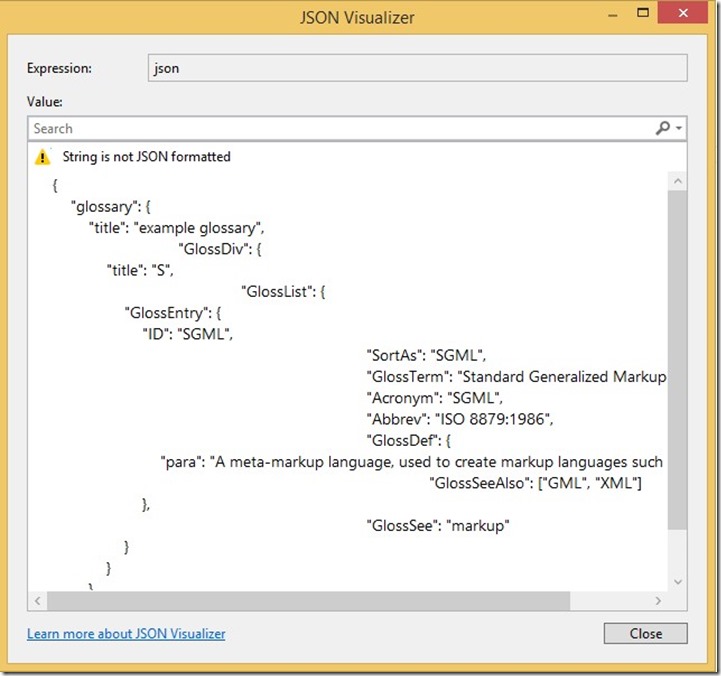
Figure 5 shows a string with an invalid JSON format being visualized with the JSON Visualizer.
You can simply start typing in the search box to filter the nodes to the ones that contain the search text. The match cases will be highlighted in the filtered view. The search works on every JSON value and hence will match the search string in either the key or the value for a JSON object.
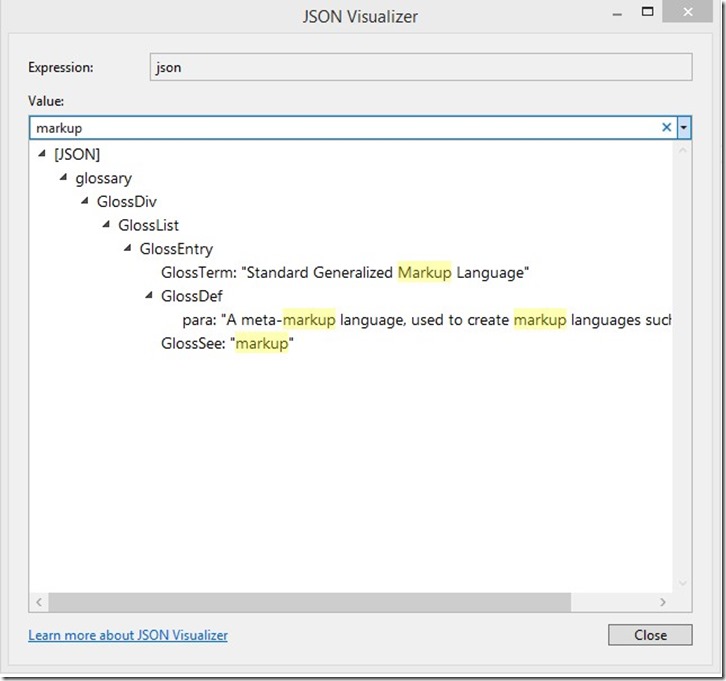
Figure 6 shows the filtered view of the JSON Visualizer after search has been performed.
In addition to the search feature the JSON visualizer comes with four useful commands packed in the context menu. These commands let you copy the complete object or just the key/value of the object to the clipboard. The Copy Path command copies the path of the current object relative to the parent JSON object. For instance, the path for the JSON object that has been right clicked in Figure 7 below will be:
[JSON].glossary.GlossDiv.GlossList.GlossEntry.GlossDef.GlossSeeAlso.[0]
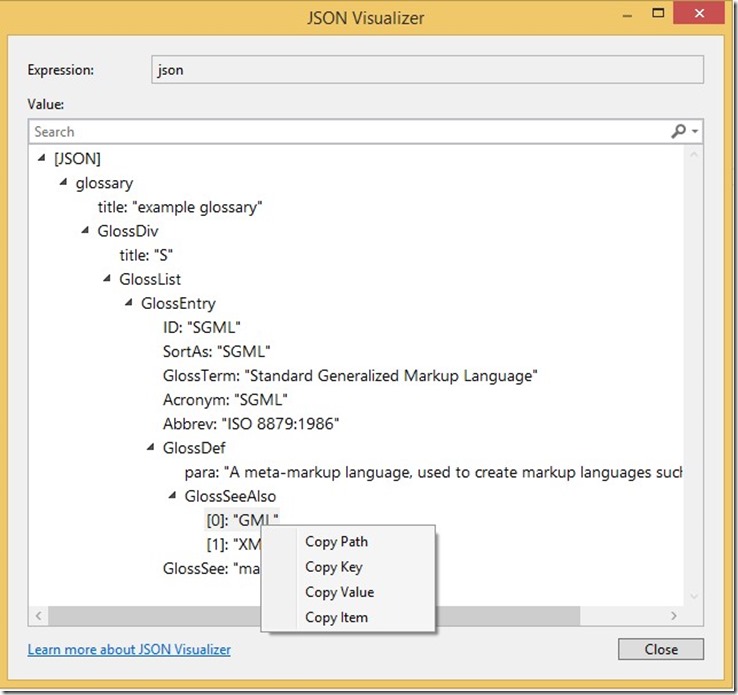
Figure 7 shows context menu commands on a node.
The attached project contains sample JSON and demonstrates the capabilities of the new JSON visualizer. The C# console app in the attached project simply reads from a file that contains the sample JSON. The JSON visualizer however works across all languages and project types currently supported by Visual Studio debugger (C#, VB, C++, JavaScript, etc.).
In Closing
In summary, in this post we looked at the new JSON visualizer added to Visual Studio 2013. I hope that you find this feature valuable and if you have any comments/questions I’d love to hear them in the comments below or our MSDN forum.

 Light
Light Dark
Dark
0 comments