Finding swallowed and async exceptions using IntelliTrace in VS2015
In this blog post I am going to walk you through using IntelliTrace in Visual Studio 2015 to deal with two exception-related scenarios:
- Finding swallowed exceptions and fixing the bad exception handling
- Finding the source of exceptions in async code
If you haven’t done so already, check out the announcement of IntelliTrace in Visual Studio 2015 which gives you an overview of IntelliTrace and its improved UI. You can see this walkthrough as a video here (demo start at 43m55s).
The application I am going to be working with is a contact manger written in ASP.NET (I have included the source code in case you want to follow along):

Finding swallowed exceptions
Users report that occasionally clicking on the “Edit” button doesn’t do anything. The first thing I check is that firing up the application and hitting “Edit” with just the one test record works, and it does, so I create a few more test records:

Now I will remove a couple of them just to exercise the system a bit, because it’s the easiest way for me to simulate a bit of usage:

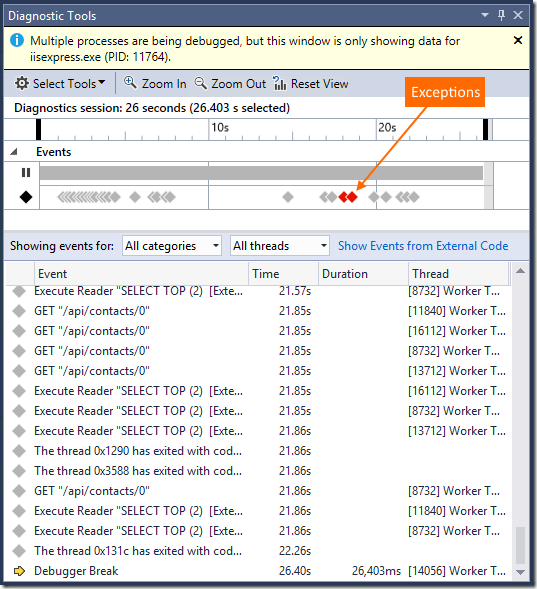
Now I hit “Edit” on the new test record named “as” and nothing happens. I have successfully reproduced the bug and since I have IntelliTrace my first thought is to take a look at the events collected so far:

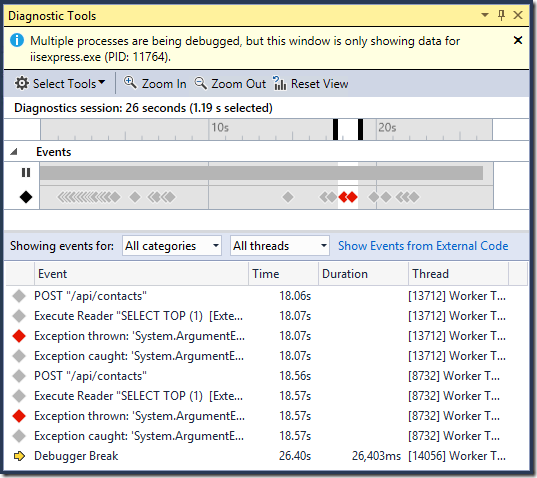
My eye is immediately drawn to the red exception events on the IntelliTrace timeline because I am not expecting my code to throw any exceptions. Dragging my mouse on the timeline, I filter the time range around the exceptions so I can look at their details in the tabular view below:

Clicking on one of them shows the details:

The exception details tell me that when I entered the additional test records, I was lazy and re-used the same test data for all three of them, so two failed to be entered into the system because they used an email address that already existed. This root cause fits well with the description of the “Edit” functionality occasionally not working: it’s not working for records which failed to be inserted in the first place due to using an existing email address. Success! IntelliTrace quickly pointed me to the root cause, now let’s transition to fixing the issue.
Fixing bad exception handling
Now I have two tasks as part of the fix:
- Add validation to the UI so that it stops me from adding two contacts with the same email
- Find out why the exception was swallowed instead of bubbling up to the UI as an error
The first one is not very interesting as far as IntelliTrace and Historical Debugging are concerned. The second one is interesting and can be tricky. Let’s take a quick look at the code where the exception is thrown. I click Activate Historical Debugging on the exception:

and navigate to the line of code that was responsible for generating the exception:

The exception is thrown from within the AddContact method and there is no try/catch statement in the AddContact method. How do I find where the exception was caught? Usually I am lucky enough that when I go up a level or two on the call stack I find the try/catch statement that is the culprit, but sometimes it’s not so easy, especially when dealing with layers and tiers and wrapping exceptions and so on. IntelliTrace can tell me exactly where the exception was caught by activating Historical Debugging on the corresponding “Exception caught”:

Which takes me here:

And now I know where the exception is being swallowed – fixing the issue from here is easy and is left as an exercise for the reader.
This was a demonstration of how IntelliTrace and Historical Debugging can help you find swallowed exceptions and fix the bad exception handling in your code.
Finding exceptions in async code
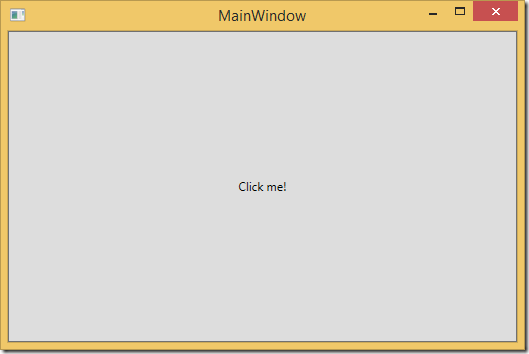
Let’s use a very simple WPF demo application that throws an exception in async code (it’s part of the same download).

The entire application is a button that, when clicked, starts an asynchronous operation that eventually throws an exception, causing Visual Studio to break on the unhandled exception:

Visual Studio is pointing at the line of code “await manager.ManageSomething();”, but I can see that the variable manager is being initialized right above it. So the issue is not with this line itself, it’s with the async operation that is being kicked off, and yet the Visual Studio debugger has taken me here.
This is something we are looking into improving, but until then you need a workaround to help you find the source of exceptions in async code and with IntelliTrace you have just that. Just take a look at the Diagnostic Tools window, find the exception events collected by IntelliTrace and click “Activate Historical Debugging”:


Now you are taken to the real location where the exception is thrown, problem solved (if you don’t have IntelliTrace the way to diagnose these issues is to configure the debugger to break when the exception is thrown).
Wrapping up
We are always looking for feedback and comments, especially if there is a feature you find useful. You can leave general comments & questions at the end of this blog post or via Send-a-Smile, and submit feature requests to our IntelliTrace UserVoice. You can also send us a tweet or visit the MSDN Diagnostics forums.

 Light
Light Dark
Dark
0 comments