
Transforming Financial Planning with Power Platform: A Journey through Data Modeling on Dataverse
Transforming Financial Planning with Power Platform: A Journey through Data Modeling on Dataverse
Background
In a recent project, we worked with a customer to help them digitally transform their end-to-end financial planning and control management processes and systems.
The foundation for the new solution was adopting a low-code no-code approach, which utilized out-of-the-box features to their fullest extent to create applications with minimal custom code, making it easier for both citizen and professional developers to build and maintain. The solution was predominantly based on Power Platform, leveraging Power Apps, Power Automate, and Dataverse.
The financial planning process was data-intensive with multi-level hierarchical relationships, where users would need to navigate between data at different hierarchical levels. The user base was primarily finance personnel who relied heavily on excel files to perform financial planning. It was important for the customer that the solution retain a familiar excel-like user experience. Power Apps model-driven app was the best candidate for the presentation layer, since it is particularly useful in scenarios where data relationships are complex and require the ability to navigate between related records. It also provides a tabular experience which was aligned to the customer’s needs.
All data required for financial planning was housed in Dataverse. Model-driven apps are built on top of Dataverse tables. Creating a robust data model on Dataverse was a crucial part of the solution, since model-driven apps are essentially driven by the underlying tables. Once an efficient data model is created and relationships are established, the build process for model-driven app is relatively rapid.
In this article, we will talk about our journey through data modeling on Dataverse with real-world customer scenarios, focusing on the following themes:
- Moving from a traditional database modeling mindset to data modeling on Dataverse
- Modeling for least-code mindset
- Adapting data model to functional requirements
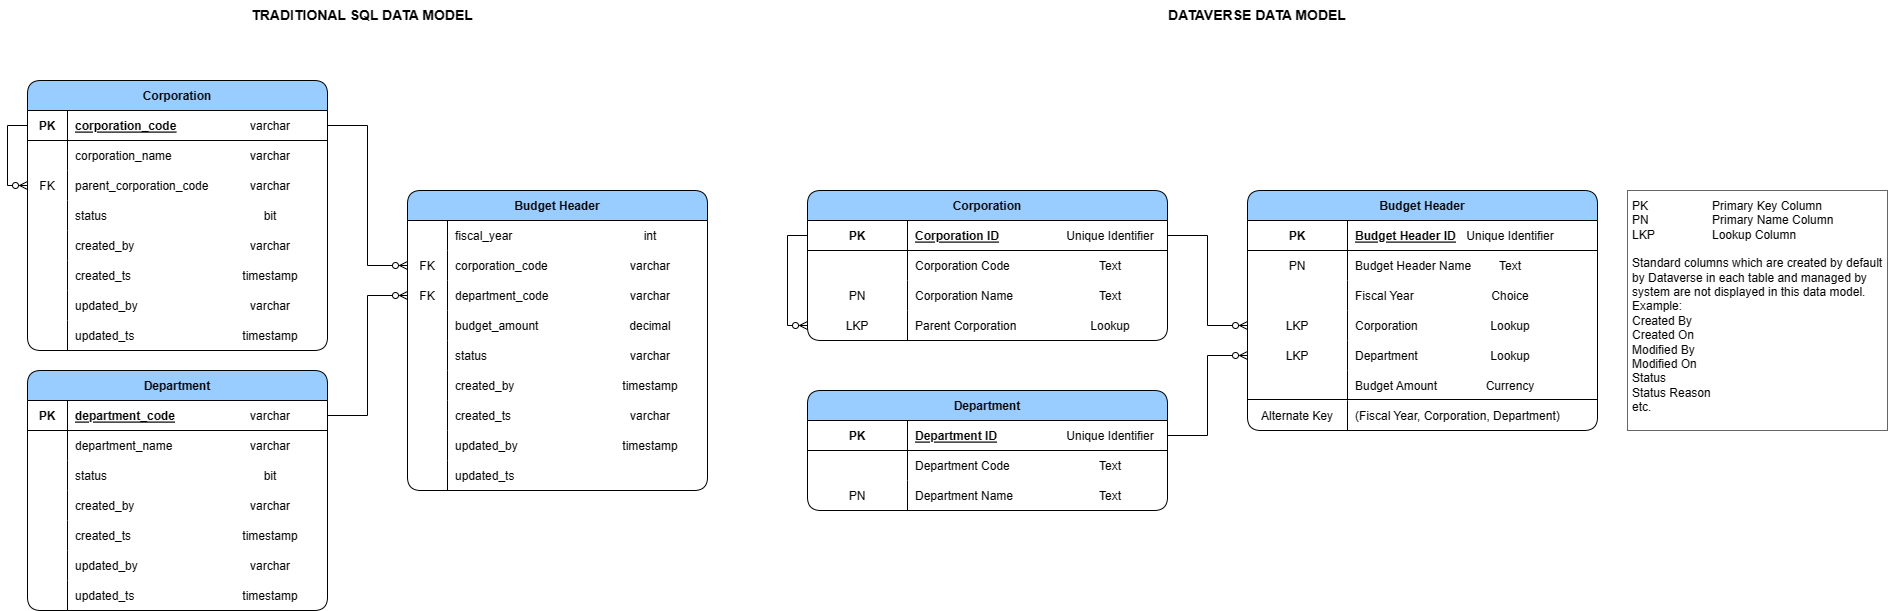
Moving from a traditional database modeling mindset to data modeling on Dataverse
Designing a primary name column in Dataverse
Primary Key While both traditional databases and Dataverse have the concept of a “Primary Key” that identifies a record uniquely, there are subtle differences when it comes to Dataverse. Primary key in Dataverse is a GUID column named {table logical name}Id which is created by default on creation of a table. The unique identifier value is system generated when a record is created (though it is possible to specify a value for the unique identifier when creating a record programmatically).
Primary Name Dataverse additionally has a concept of “Primary Name” column. A primary name column stores the string value that identifies the table record. This is the value that will be displayed using a hyperlink in views to open the record. Whenever you add a lookup reference from one table to another (N:1 relationship), this value is shown as the reference to that record. Designing what to store in the primary name column goes a long way when it comes to user experience, since this is the value that is visible to the user to click and navigate between related records. Hence, it is important to store values that are easily identifiable by a user in a primary name column.
Though it is not a requirement for the primary name column to be unique, we found that storing data containing duplicate values created ambiguity when searching in lookup dropdowns since multiple options with same value are displayed.
Modeling for least-code mindset
Our functional use case required us to track forecasted budget and other financial transactions such as actual spend, purchase requests, purchase orders etc. for each management unit in the organization at a monthly level and further break the monthly values across different spend categories such people and non-people expenses. Designing a table horizontally for such a use case would mean a large number of columns, one for each month, financial transaction and spend category.
An intuitive data model would normalize the model and store monthly amounts as rows in different tables. However, this would pose a challenge to utilize the out-of-the box import from and export to excel feature in model-driven app, because you can use a single excel source against one table only. This also meant additional effort to build a view that would transpose the monthly rows into monthly columns. The customer wanted to view the monthly data horizontally. Hence, to adhere to low-code no-code design principles and leverage out-of-the-box features, we improvised the data model to store the amounts as columns.
How many columns is too many?
With the above approach, there were close to 200 amount columns in one table and even though we were well within the maximum limit of 1024 columns that can be created per table, we exceeded the maximum allowed table row size of 8060 bytes.

Hitting table row size limits
So, how did we hit the table row size limit?
- Currency columns – The amount values were being stored as currency columns. For each currency column created, Dataverse creates a corresponding “_Base” column that stores the amount value in base currency. This means each amount column would require double the minimum allocated bytes (which is 8 bytes for a Currency column) in a row. Additionally, a single decimal column for Exchange Rate is created to provide the exchange rate for a selected currency with respect to the base currency.
- Lookup columns – The table also contained lookup columns which store a unique identifier value requiring 16 bytes. Additionally, for each lookup column Dataverse creates two additional Text columns (each column requiring default length 100 * 2 bytes) to store details of the referenced entity and attribute.
- Dataverse system columns which are created by default in each table also add to the number of minimum bytes that must be allocated.
- Space allocated for internal overhead (refer error message in image above).
All these factors led to us exceed the maximum row size allowed for a table. Since there were no requirements for multiple currencies in financial planning, we weighed our options and worked around this issue by switching to decimal column for storing amounts, which does not create any additional columns internally and requires 5 bytes of space for each column for a precision between 1 to 9.
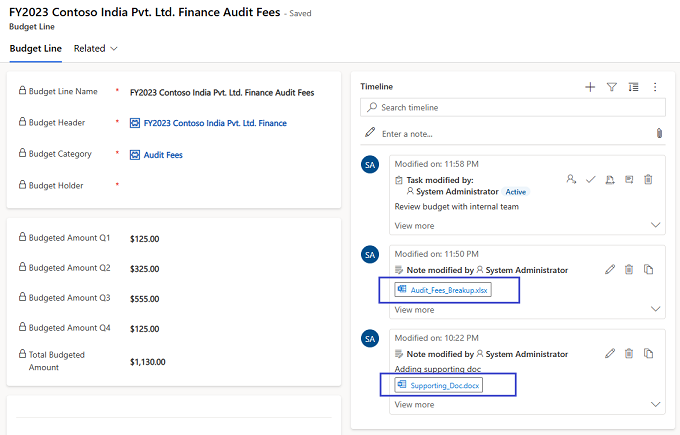
Storing file attachments
Timeline Control One of the requirements from customer was to be able to attach supporting documents, screenshots etc. at the level of each financial planning record on the app. We used the Timeline control of model-driven app to enable users to add attachments to an individual record. Timeline is a feature-packed component that allows you to also capture notes, appointments, emails, phone calls, tasks etc. for a record. You can add multiple attachments to a single record as well. With all information related to a record, including attachments, streamlined in a single location, Timeline proved to be a great choice to improve user experience for the said requirement. Eventually, we used timeline to display approval/rejection activities as well, which we will talk about in the next section.
File Columns File columns can also be used to store files. However, the primary purpose of these columns is to store binary data. You can only store one file in its binary form in a File column. In our use case, we used a File column where we needed to programmatically access the file data using custom code, since the APIs are optimized for binary usage. For example, download and parse the contents of a file or generate a file and upload it’s content. It is possible to expose the File columns to user via forms and views in model-driven app to say, upload import files or download error files.
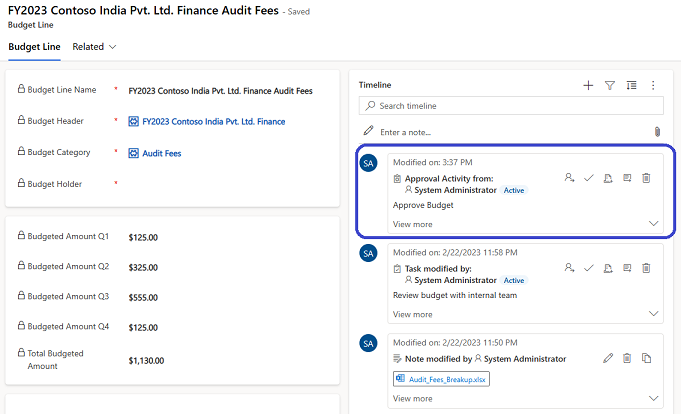
Leveraging Common Data Model
Every financial planning record created by a finance team member had to go through an approval process. We created a custom Activity table to track approval requests at each record level. An activity table is an out-of-the-box Dataverse table which is part of the Common Data Model schema. It represents an action that can be scheduled; it comes with fields that help track state of the activity such as open, cancelled or completed, track due date for the activity, assign activity to a specific user etc. Custom approval activities are added to the timeline, where user can view approval request for a record and take necessary action.
Adapting data model to functional requirements
Normalize until it hurts, then denormalize until it works
The customer had a multi-level management unit hierarchy that required financial planning at each level. To accommodate this, the data model consisted of multiple tables that stored budget data for each level of the hierarchy, along with a lookup reference to the parent hierarchy. This approach ensured that budget amounts at child hierarchy levels could be tallied up to the budget amount at the parent level without data duplication.
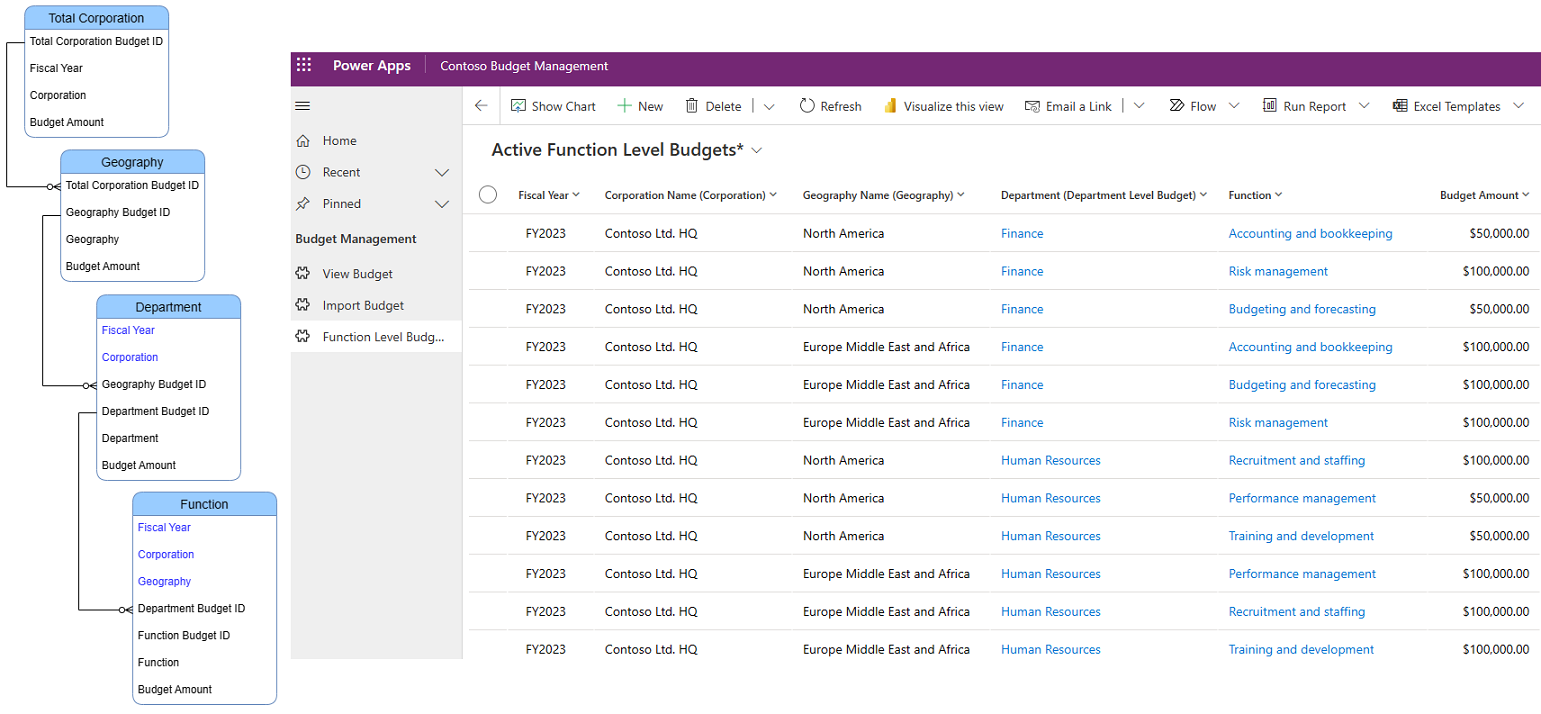
While this normalization resulted in a clean data model with no data redundancy, building a view that displayed the entire hierarchy of management units became challenging. This view was a key requirement for the user experience, since there can be certain management units for example Sales or Marketing that can repeat across different parent management units in the same organization. Without a full view of the hierarchy it would be very difficult to distinguish one from another. Though it is possible to display related table records in a model-driven app view, you can only traverse to a table one level up in the hierarchy. To address this issue, we denormalized the data by storing the parent hierarchy information in each table as necessary. This modification allowed us to create a view that displayed the entire hierarchy of management units to the user with ease.
Before – A highly normalized data model
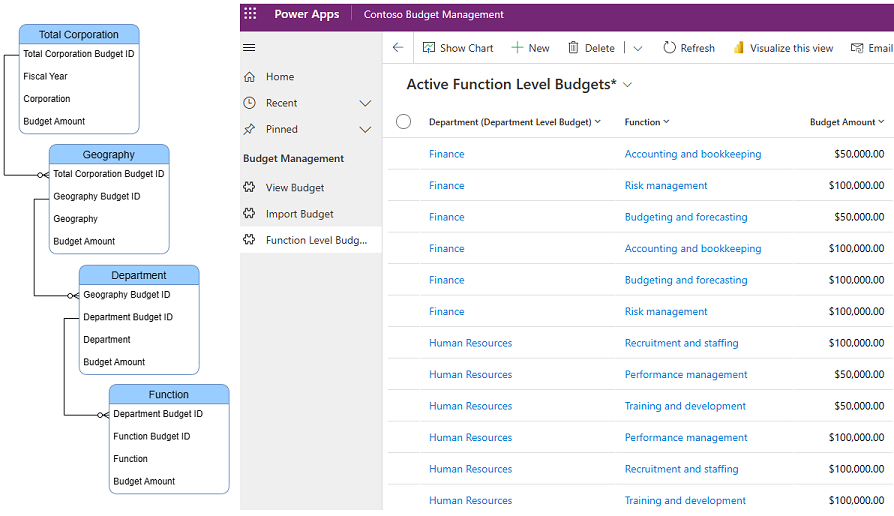
After – A denormalized data model
Conclusion
In conclusion, building a strong data model on Dataverse is crucial for the success of a low-code no-code Power Platform solution. Pro developers with a SQL background may find that the transition to Dataverse data modeling can be quite different and can come with a few surprises. It is strongly recommended to first familiarize oneself with the recommended best practices for data modeling on Dataverse. In addition, this blog aims to provide developers with valuable insights and approaches through real-world customer scenarios to help build even more robust data models on Dataverse. By following best practices and learning from real-world experiences, developers can create highly effective data model on Dataverse.
References
- What are model-driven apps in Power Apps?
- Data modeling for Dataverse
- Best practices for data modeling for Dataverse
- Blog article on field limits in Dataverse
- Field limits in Dynamic 365
 Light
Light Dark
Dark