
Stock Market Predictions with Natural Language Deep Learning
Overview
 We recently worked with a financial services partner to develop a model to predict the future stock market performance of public companies in categories where they invest. The goal was to use select text narrative sections from publicly available earnings release documents to predict and alert their analysts to investment opportunities and risks. We developed a deep learning model using a one-dimensional convolutional neural network (a 1D CNN) based on text extracted from public financial statements from these companies to make these predictions. We used Azure Machine Learning Workbench to explore the data and develop the model. We modeled our solution using the Keras deep learning Python framework with a Theano backend. Our results demonstrate how a deep learning model trained on text in earnings releases and other sources could provide a valuable signal to an investment decision maker.
The Challenge
When reviewing investment decisions, a firm needs to utilize all possible information, starting with publicly available documents like 10-K reports. However, reviewing public earnings release documents is time-intensive and the resulting analysis can be subjective. Moreover, the written sections of an earnings release require the most review time and are often the most subjective to interpretation. A thorough analysis of the investment opportunity of a business would also include a review of other companies in the industry to understand relative performance. Our challenge was to build a predictive model that could do a preliminary review of these documents more consistently and economically, allowing investment analysts to focus their follow-up analysis time more efficiently and resulting in better investment decisions.
For this project, we sought to prototype a predictive model to render consistent judgments on a company’s future prospects, based on the written textual sections of public earnings releases extracted from 10k releases and actual stock market performance. We leveraged natural language processing (NLP) pre-processing and deep learning against this source text. In the end, we sought a model that was easy to operationalize, use and maintain over time. While there are broader potential applications of processing public earnings release narratives to predict future stock value, for the purposes of this project we focused just on generating predictions that could better inform further human analysis by our partner.
Our Approach
Tooling, Pre-Processing and Initial NLP Exploration
We began our work in Python with Azure Machine Learning Workbench, exploring our data with the aid of the integrated Jupyter Notebook. We used the base AML Workbench Python libraries, including NLTK, and added some additional packages and NLP tools including the Gensim library. All scripts and sample data are available in this GitHub repo, including Jupyter Notebooks for each of the steps, from filtering source data to pre-processing, running and evaluating the model. To make things easier, you’ll find a list of the Python packages and utilities to install on top of the base Azure Machine Learning Workbench Python installation listed in the readme.
As input, we gathered a text corpus of two years of earnings release information for thousands of public companies worldwide. We extracted as source the sections 1, 1A, 7 and 7A from each company’s 10k — the business discussion, management overview, and disclosure of risks and market risks. We also gathered the stock price of each of the companies on the day of the earnings release and the stock price four weeks later. We categorized the public companies by industry category.
We pre-processed the text, converting to UTF-8, removing punctuation, stop words, and any character strings less than 2 characters. The pre-processing Jupyter Notebooks are on GitHub (Source Text Filtering and Text Cleaning). Many of the techniques we used are described in detail in the NLTK in Python book. Below is an example of cleaned text, which in this case is a sample of a management overview from one earnings release. A number of text document samples are available on GitHub.
business overview acad overview we are biopharmaceutical company focused discovery development commercialization small molecule drugs treatment central nervous system disorders we currently have six clinical programs several additional programs discovery development our most advanced program we are conducting phase iii studies pimavanserin treatment parkinson disease psychosis we have reported positive results phase ii trial our program pimavanserin co therapy schizophrenia we also have completed enrollment phase iib trial our program acp stand alone treatment schizophrenia addition we have completed proof concept clinical study pimavanserin treatment sleep maintenance insomnia healthy older adults we have retained worldwide
An important consideration in our approach was our limited data sample of less than 35,000 individual text document samples across industries, with much smaller sample sizes within an industry. Within biotechnology, we had 943 text document samples. As a result of the sample limitations, our project results should be viewed as simply a proof of concept to be validated and improved with additional samples.
Another factor was the large amounts of industry-specific vocabularies contained in each of the text documents. To better understand the variation within the corpus, we cleaned the text the help of NLP methods and libraries including NLTK and Gensim. When inspecting the source text from public company releases with an LDA topic model analysis, we found that there was a large amount of vocabulary variation between industry vocabularies, and much less variability within industries. This finding led us to prototype our performance classification model based on single industries, rather than across them, in order to reduce the amount of less meaningful variation noise. The Jupyter Notebook details the initial text exploration in the Jupyter Notebooks folder.
Representing Documents as Word Vectors
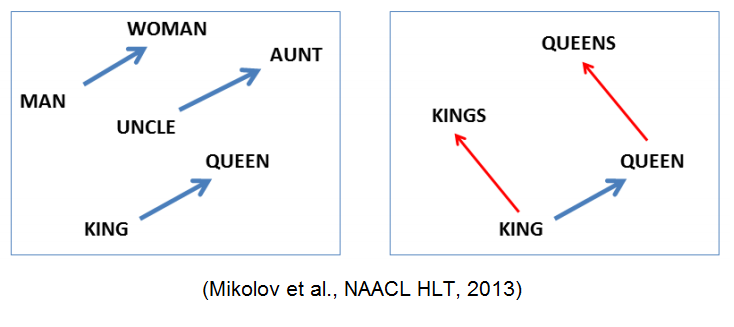
In order to take advantage of NLP deep learning, we needed to obtain numerical representation for our text. Specifically, we needed vector representations for each of our documents. Natural language, by its nature, has localized spatial correlations between words. For example, if you find the word ‘sunny’, you may be more likely to find the word ‘weather’ in the same sentence than another less closely related word. Word vector models represent these relationships numerically. In particular, word embedding is a technique wherein word pairs can be represented based on the Euclidian distance between them which can encode the semantic differences and similarities. These distances can be represented by vector differences.
There were two options for creating word embeddings. We could create custom embeddings based on our corpus of source texts, or we could leverage a pre-trained model based on a much larger corpus of text. Given the limited size of our sample, we looked to leveraged pre-trained word vectors. In our case, we used GloVe pre-trained models. These pre-trained models were trained on aggregate global word-word co-occurrence from a variety of very large datasets. The result is a vector that represents the linear substructure of the word vector space. We used the GloVe pre-trained model of all of Wikipedia’s 2014 data, a six billion token, 400,000-word vocabulary vector model, chosen for its broad domain coverage and less colloquial nature. This pre-trained set of word vectors allowed us to vectorize our document set and prepare it for deep learning toolkits.
Although this pre-trained model has a vast 400,000-word vocabulary, it still has limitations as it relates to our text corpus. For example, in technology-driven industries, there is a highly specialized, domain-specific vocabulary which may not be represented in the pre-trained word model. These vocabulary terms might be predictive of performance, but when we used these pre-trained word models, out-of-vocabulary words would all get the same word vector values which reduce their predictive value. For some industries, this vocabulary changes over time as new technologies, compounds or products are developed. As a result, the word vector of these changing words might need to be different at different periods of time. The presence of the newest technology vocabulary might also have predictive value. In addition, the corporate earnings release statements are rendered with a particular subtle patois not fully reflected in the Glove model pre-trained on Wikipedia articles.
Research is emerging on new methods for dealing with out of vocabulary words for small vocabularies, and the temporal dimension of vocabulary words. This post sums up important recent NLP research which promises to solve these issues in the future.
Classification Labels and Prediction Goal
We created three equally sized classification bins of high, medium and low performance based on the performance of the stock between the date of the release and four weeks later. The performance was calculated as the percentage change in the stock value in that time and applied some normalization for overall stock market changes. These low, medium and high 4-week performance classifications were the labels in our model. We modeled our prototype on just one industry, the biotechnology industry, which had the most abundant within-industry sample. Our project goal was to discern whether we could outperform chance accuracy of 33.33%.
Convolutional Neural Net Model with Keras
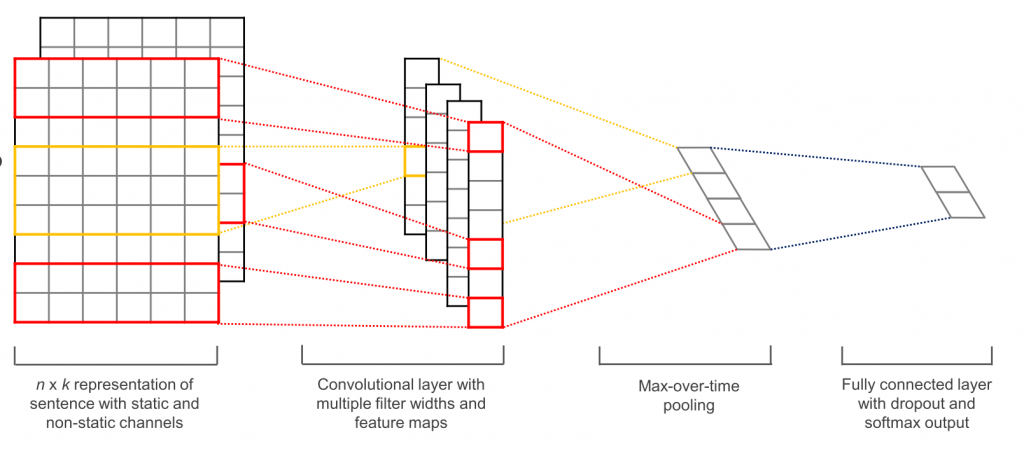
With our documents represented by a series of embeddings, we were able to take advantage of a convolutional neural network (CNN) model to learn the classifications. CNNs can be well suited to document modeling, as they can find small (and then large) syntactic structures across the training set through convolutional and max pooling steps, building a fuller model of the source corpus (read more about CNNs with NLP). Below is a depiction of a one layer CNN. With our limited sample of source documents and very limited timespan of our data points, we chose the simpler 1D CNN, rather than using an LSTM model for this project.
We used a 1D CNN in Keras using our custom word embeddings. See this excellent Keras example for a 1D CNN architecture using custom word embeddings, like those pre-trained Glove model word vectors. In our model design, we started from the Keras reference as our architectural base and refined from there.
We chose a 10,000-word sequence as the maximum. For those documents with more than 10,000 words, we truncated the remaining text. For those documents with fewer than 10,000 words, we padded the sequence at the end with zeroes. We mapped each of our words in each sequence to one of the Glove embedding vocabulary items and used its 300 value numerical representation. For each document sample, we had a 10,000 x 300 sequence representation. Below is an excerpt of building the embedding matrix from this script.
#################################
#Build the embedding matrix
#################################

print('Building Embedding Matrix...')
embedding_matrix = np.zeros((len(word_index) + 1, EMBEDDING_DIM))
for word, i in word_index.items():
    embedding_vector = embeddings_index.get(word)
    if embedding_vector is not None:
        # words not found in embedding index will be all-zeros.
        embedding_matrix[i] = embedding_vector

embedding_layer = Embedding(len(word_index) + 1,
                            EMBEDDING_DIM,
                            weights=[embedding_matrix],
                            input_length=MAX_SEQUENCE_LENGTH,
                            trainable=False)
For the model itself, we employed the ADAM optimizer, the Lecun initializer, and we used exponential linear unit (‘elu’) activation function. We applied dropout in training (15% to inner layers, and 45% to the final layer), and the Keras early stopping feature to prevent over-fitting. Also, we stepped down the learning rate from the initial model to improve the test results to .00011. We discovered the model was very sensitive to initializer choices, with the Lecun model offering much better learning than other all other initializers available in Keras. After testing all the optimizer options in Keras, we found that both ADAM and RMSprop optimizers performed much better than other optimizers, with ADAM performing slightly better. When we used the ‘elu’ function, the model trained less erratically than with the Relu, Prelu or Leaky Relu activation functions, and reached higher accuracy. We stepped down batch size to a modest size of 33 to improve learning.
In order to improve the model, we augmented the data in the original text with the title of the section from the 10-K report. We appended this text to the start of the document sample. Thesaurus-based data augmentation in NLP is discussed in more depth in this forum discussion.
Some of the hyperparameter choices and the model architecture are detailed below. Also, see the complete Jupyter Notebook and this practical guide to troubleshooting and tuning your neural network.
########################
#Select Model Parameters
########################
MAX_SEQUENCE_LENGTH = 10000 #Max sequence of 10k words from each sample
MAX_NB_WORDS = 400000 #Using the full Glove Vocabulary
EMBEDDING_DIM = 300 #Each word in the sequence represented by 300 values
VALIDATION_SPLIT = 0.2  #Train/Test Split
LEARNING_RATE = .00011
BATCH_SIZE = 33
DROPOUT_RATE = 0.45  #Dropout applied to last layer
INNERLAYER_DROPOUT_RATE = 0.15  #Dropout applied to inner layers

##############
#1D CNN DESIGN
##############
sequence_input = Input(shape=(MAX_SEQUENCE_LENGTH,), dtype='int32')

embedded_sequences = embedding_layer(sequence_input)

x = Conv1D(128, 5, activation='elu', kernel_initializer='lecun_uniform')(embedded_sequences)
x = MaxPooling1D(5)(x)
x = Dropout(INNERLAYER_DROPOUT_RATE)(x)

x = Conv1D(128, 5, activation='elu', kernel_initializer='lecun_uniform')(x)
x = MaxPooling1D(5)(x)
x = Dropout(INNERLAYER_DROPOUT_RATE)(x)

x = Conv1D(128, 5, activation='elu', kernel_initializer='lecun_uniform')(x)
x = MaxPooling1D(35)(x)  # global max pooling

x = Flatten()(x)
x = Dense(100, activation='elu', kernel_initializer='lecun_uniform')(x) # best initializers: #glorot_normal #VarianceScaling #lecun_uniform
x = Dropout(DROPOUT_RATE)(x)

preds = Dense(len(labels_index), activation='softmax')(x) #no initialization in output layer

model = Model(sequence_input, preds)

The Result
Our prototype model results, while modest, suggest there is a useful signal available on future performance classification in at least the biotechnology industry based on the target text from the 10-K. The resulting statistics are listed below, including the statistics by class. For our model, ‘0’ represents low performance, ‘1’ represents middle performance and ‘2’ represents high performance (see model evaluation notebook).
Overall Statistics:

Accuracy: 0.502732240437
95% CI: (0.42803368164557776, 0.57734086516071881)
P-Value [Acc > NIR]: 0.133021698692
Kappa: 0.25479930192


Class Statistics:

Classes                                       0          1         2
Population                                  183        183       183
P: Condition positive                        61         62        60
N: Condition negative                       122        121       123
Test outcome positive                        84         39        60
Test outcome negative                        99        144       123
TP: True Positive                            38         29        25
TN: True Negative                            76        111        88
FP: False Positive                           46         10        35
FN: False Negative                           23         33        35
TPR: (Sensitivity, hit rate, recall)   0.622951   0.467742  0.416667
TNR=SPC: (Specificity)                 0.622951   0.917355  0.715447
PPV: Pos Pred Value (Precision)        0.452381    0.74359  0.416667
NPV: Neg Pred Value                    0.767677   0.770833  0.715447
FPR: False-out                         0.377049  0.0826446  0.284553
FDR: False Discovery Rate              0.547619    0.25641  0.583333
FNR: Miss Rate                         0.377049   0.532258  0.583333
ACC: Accuracy                          0.622951   0.765027  0.617486
F1 score                               0.524138   0.574257  0.416667
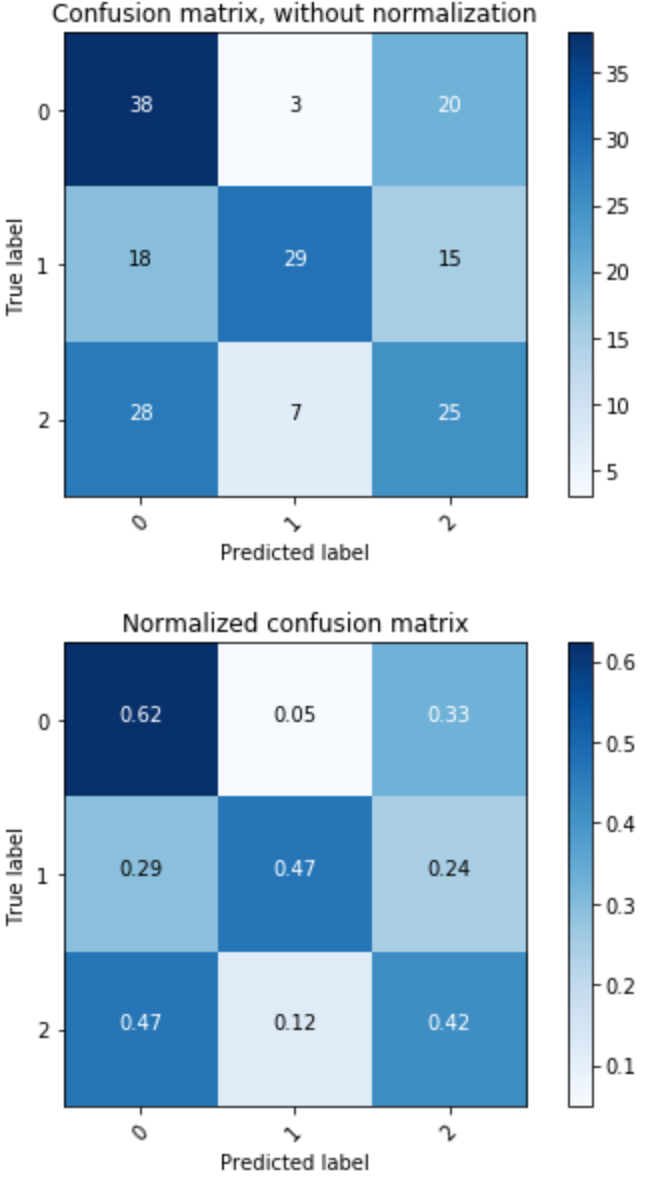
The confusion matrix below details the prediction comparing the true class of the sample, and the predicted class. The true label is on the vertical axis, and the predicted label coming from our model is on the horizontal axis. The top grid is the absolute count, and the bottom grid is the percentage. The visualization shows that our model performs best at predicting the true label of the low performing stocks, in the upper left.
For investment firms, predicting likely under-performers may be the most valuable prediction of all, allowing them to avoid losses on investments that will not fare well. Chance would have given us a 33.3% accuracy for any one classification. In this model, we are seeing 62% accuracy for predicting the under-performing company based on the sample 10-K text.
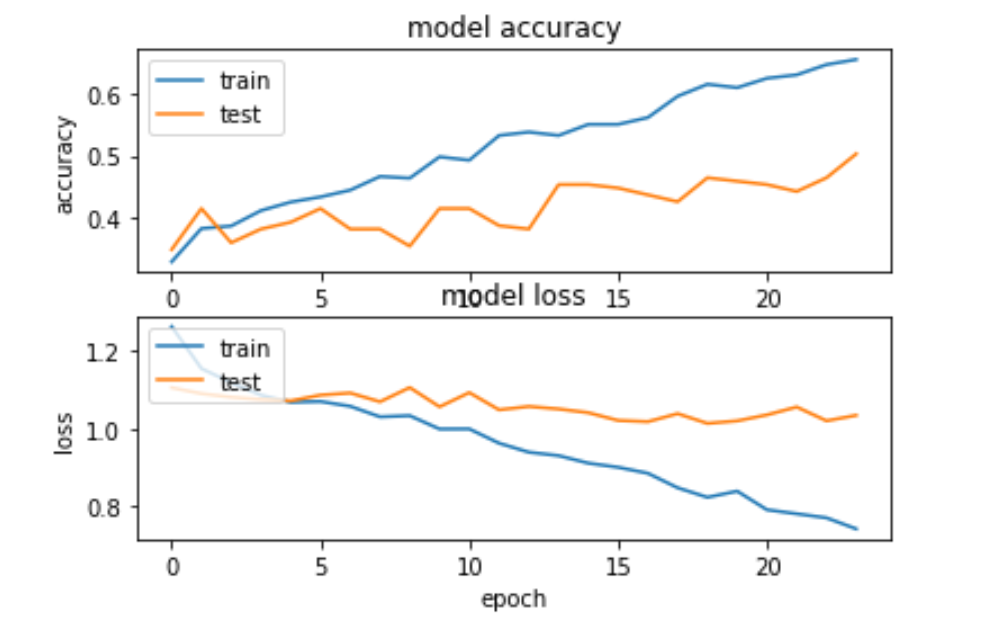
The history of model training and testing is below, trained for 24 epochs.
Next Steps
This initial result suggests that that deep learning models trained on text in earnings releases and other sources could prove a viable mechanism to improve the quality of the information available to those making investment decisions, particularly in avoiding investment losses. While the model needs to be improved with more samples, refinements of domain-specific vocabulary, and text augmentation, it suggests that providing this signal as another decision input for investment analyst would improve the efficiency of the firm’s analysis work.
Our partner will look to improve the model with more samples and to augment them with additional information taken from the earnings releases and additional publications and a larger sample of companies. They will also explore alternative model architectures including LSTM to better understand the sequential nature of the publication and performance information. In addition, they will look to replicate this model for different industries and operationalize the model with Azure Machine Learning Workbench, allowing auto-scaling and custom model management for many clients.
Overall, this prototype validated additional investment by our partner in natural language based deep learning to improve efficiency, consistency, and effectiveness of human reviews of textual reports and information. Please feel free to reach out in comments below or directly via Twitter @SingingData.
Featured Image by pixabay.com
 Light
Light Dark
Dark
0 comments