
Creating a Data Visualization GraphQL Server with a Loosely Coupled Schema
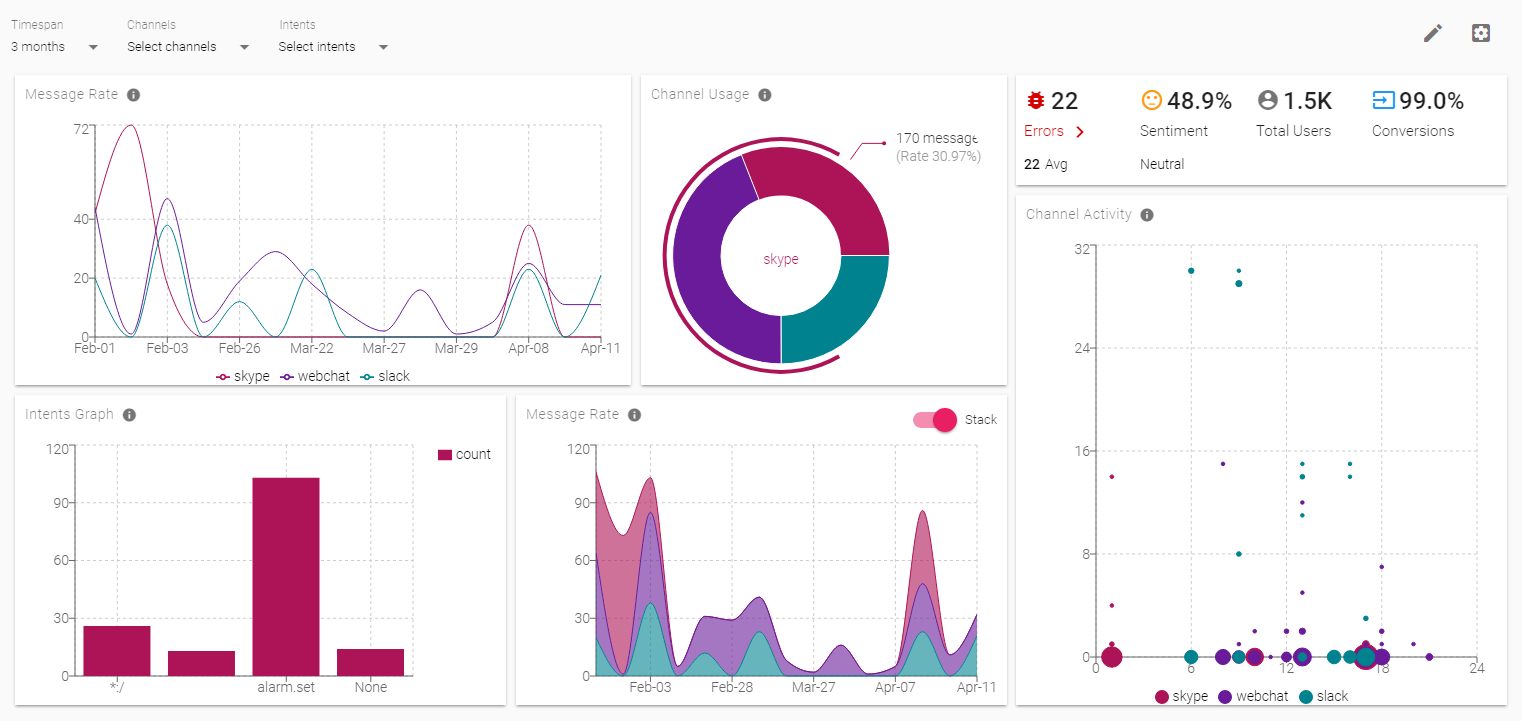
We recently built a dashboard for visualizing data from Application Insights. This Azure service enables the collection of large amounts of information about an application’s business analytics and health, plus quick and efficient access to that data by using Kusto Query Language. For this purpose of building a flexible data visualization dashboard, we explored the GraphQL stack, a query language that enables abstraction of server-side API calls under a single neat wrapper instead of multiple endpoints.
The initial design of Project Ibex, our Bot Analytics dashboard, included a centralized data pipeline using a REST server as a pass-through proxy to return aggregated results from multiple services with a single JSON response. Maintaining our own data service, however, added unnecessary complexity to the Ibex project. Giving the rising popularity of GraphQL, we decided to investigate a design based on this stack. We sought to minimize the existing complexity and optionally gain performance improvement.
One of the most powerful features of Ibex is the ability for users to specify any Application Insights query when building a new dashboard, without writing a single line of code. However, to use GraphQL, users must define a common schema between their clients and server. Since GraphQL requires the client to have access to a defined schema in advance, there may be some considerations when developing with it: for instance, what happens when a project like Ibex needs to support dynamic data representations?
At first glance, it seems as there is no simple solution to support any data and any client-provided query while keeping the schema loosely coupled with the data representation. In this blog post, we will share our learnings from this challenge, including how we leveraged the GraphQL stack and came up with a smart yet simple solution.
Rethinking GraphQL schemas
While we could have worked around GraphQL’s dynamic schema limitations by supporting a predefined set of queries, this approach would have limited the reusability of Ibex and increased long-term maintenance complexity.
Another workaround would have been to declare a generic schema GraphQL, as follows:
// #### NOT recommended approach ####

type Query {
  generalQuery(query: String!): JsonResponse
}

type JsonResponse {
  body: String
}
The results contain a single field ‘JsonResponse’ and it is the client’s responsibility to parse, process and visualize it. The above solution, enables dynamic schema support at the expense of GraphQL benefits, reducing GraphQL into an expensive REST server with no additional benefits.
With a generalized schema:
- Clients are unable to specify which data they want to retrieve
- Clients suffer degraded performance as a result of redundant data transfer
The role of Ibex’s server is to provide data for dashboards. The set of UI components that a dashboard can show is naturally limited and very small (line charts, bar charts, gauge charts, etc.). Rethinking and redefining the schema based on this view model rather than on the data itself is key to this challenge.
GraphQL Server as a View Model
We learned through investigation that it is possible to define a known client schema around a Data-View model to enable support for data independent dynamic queries with GraphQL.
For specific cases when the schema is dynamically changing between calls, or unknown in advance, but at the same time the client is naturally limited, we suggest a view model-based schema. Instead of defining it based on the data, we can build it based on the consumers, and the UI components. Since we know in advance which UI components are supported, we can preprocess the data on the server and return it to the format supported by the UI components.
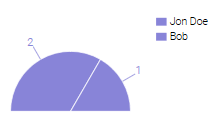
Consider the following example, Imagine we want to present a pie chart that shows how many requests to a bot each user made. One option would be to retrieve all requests for all the users, sum up the data by user and visualize it. To make this option work, the GraphQL schema should be defined based on the Application Insights requests table’s schema.
type Query {
  requests(query: String!, appId:String!, apiKey:String!): [Request]
}

type Request{
  timestamp: [String]
  id: [String]
  url: [String]
  resultCode: [Int]
  client_IP: [String]
  ...
}
This option will result in raw data and the schema is strongly coupled with the data representation. Any change to the data or query should result in a schema change.
A second option would be to return the summarized data:
{
  "data": {
    ],
    "pieCharts": [
      {
        "labels": [
          "Jon Doe <19.23.4.244>",
          "Bob <12.25.200.255>"
        ],
        "values": [
          2,
          1
        ]
      }
    ]
  }
}
When dealing with a pie chart, we expect the data to be in the form of [ {label1, value1} , {label2, value2}, …, {labelN, valueN}]. Every other information is redundant. The same goes for other UI components: a line chart graph would contain several ‘line series’ and a bar chart would consist of <label, value> pairs.
The resulting schema would look like:
type Query {
  pieCharts(query: String!, appId:String!, apiKey:String!): [PieChart]
  lineCharts(query: String!, appId:String!, apiKey:String!): [LineChart]
  barCharts(query: String!, appId:String!, apiKey:String!): [BarChart]
  ...
}

type PieChart {
  labels: [String]
  values: [Int]
}

type LineChart {
  id: String
  seriesData : [Series]
}

type BarChart {
  id: String
  seriesData : [Series]
}

type Series {
  label: String
  x_values: [String]
  y_values: [Int]
}
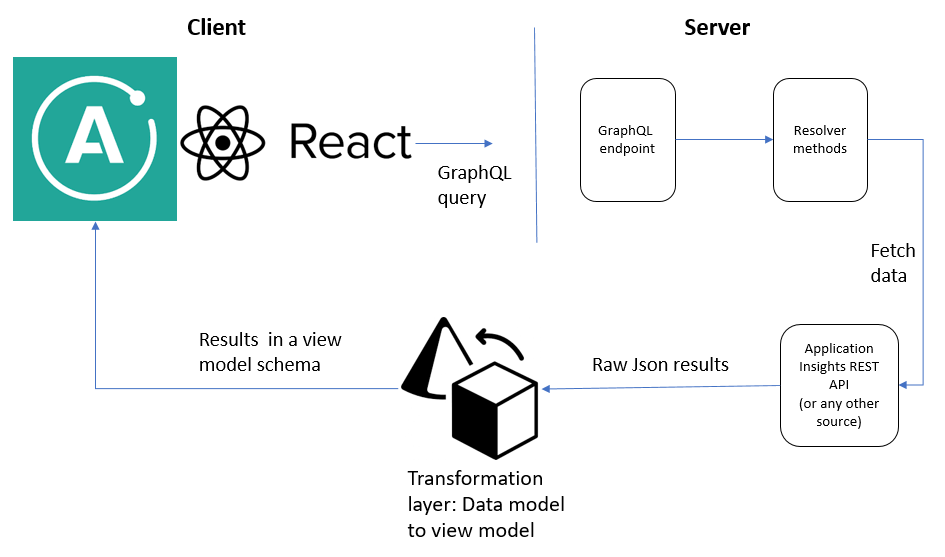
To bind the actual data to the schema, a resolver method must be defined; the resolver fetches the data. The resolver method might use REST API to call the actual data source (e.g., Application Insights). The resulting JSON would then pass through a ‘translation layer’ to transform the raw JSON into a new JSON response, in the format expected by the UI component.
Imagine that we want to generate three charts instead of just one: a line chart, a pie chart, and a bar chart.
With GraphQL a user can create a simple data independent query as follows:
{
  lineCharts(query: "some free text query for line charts") {
    seriesData {
      label
      x_values
      y_values
    }
  }

  pieCharts(query: "some free text query for pie charts") {
    labels
    values
  }

  barCharts(query: "some free text query for bar charts") {
    seriesData {
      label
      x_values
      y_values
    }
  }
}
The result of this query would be:
{
  "data": {
    "lineCharts": [
      {
        "seriesData": [
          {
            "label": "webchat",
            "x_values": [
              "2017-05-14T09:35:00Z", ..., "2017-07-10T09:10:00Z"
            ],
            "y_values": [
              1, ..., 3
            ]
          },
          {
            "label": "skype",
            "x_values": [
              "2017-05-15T10:30:00Z", ..., "2017-07-10T09:10:00Z"
            ],
            "y_values": [
              2, ..., 1
            ]
          }
        ]
      }
    ],
    "pieCharts": [
      {
        "labels": [
          "Number_Of_Inactive_Users", "Number_Of_Active_Users"
        ],
        "values": [
          19, 3
        ]
      }
    ],
    "barCharts": [
      {
        "seriesData": [
          {
            "label": "slack",
            "x_values": [
              "San Jose", ..., "Washington"
            ],
            "y_values": [
              85, ..., 67
            ]
          },
          {
            "label": "skype",
            "x_values": [
              "Dublin", ..., "Wilmington"
            ],
            "y_values": [
              25, ..., 32
            ]
          }
        ]
      }
    ]
  }
}
Notice that the data returned from the server is already processed; it is in the format expected by the UI components and is ready to be consumed. By transforming our data-driven schema into a view model-driven schema, we can now support general queries. All the client needs to do is make sure the query’s output maps to fit the transformation layer.
Code
You can find the source code for the Ibex on GraphQL prototype on GitHub. Feel free to contribute.
We have decided to keep this version as a prototype because limitations such as lack of ‘forks’ (Application Insights queries aggregation) in GraphQL would have resulted in exceeding the queries limit.
Reuse Opportunities
Since our server still needs to pull information from some REST endpoints, such as Application Insights, GraphQL does not eliminate all redundant data transfer. However, for data endpoints that are local or support partial data queries, migrating to GraphQL eliminates all redundant data transfer.
For projects with similar requirements, where the data’s structure is not known in advance and the client is limited by the number of supported query types, the server should remain as flexible as possible. To ensure server flexibility it is important to rethink the conventional schema modeling paradigm. By modeling a schema around a view model, it is possible to create data-independent GraphQL implementations.
Header Image: Social Network Analysis Visualization by Martin Grandjean, used under Creative Commons Attribution-Share Alike 3.0 Unported
 Light
Light Dark
Dark
0 comments