
Project Fortis: Accelerating UN Humanitarian Aid Planning with GraphQL
Background
The United Nations Office for the Coordination of Humanitarian Affairs (OCHA) is in charge of planning responses to emergencies and humanitarian crises around the world, between dozens of organizations. Their activities include establishing camps for refugees and reacting to events like epidemics, famines and terrorist attacks. Very often, the places that most desperately need humanitarian aid are in the most dangerous and inaccessible areas on the planet.
The Problem
In order to create and execute an accurate response plan, UN OCHA needs to understand what’s happening on the ground in these disaster areas. In locations where aid workers are present, these experts provide much of the insight and data that informs the response. In addition, for places too dangerous for aid workers to travel, response planning requires quantitative insight and analysis to understand the conditions that drive a need for humanitarian aid. OCHA actively monitors these hostile situations by reviewing social media outlets, local radio, RSS feeds, blogs, news sites and television stations on a daily basis to understand what local people are talking about. This manual data gathering process is time-consuming and imprecise, which means that humanitarian aid plans are often built from sparse and limited datasets.
Engagement
Through a collaboration between Microsoft’s Partner Catalyst Team and UN OCHA, Project Fortis started with the specific narrow goal of providing planning insight to the UN OCHA team for Libya, where the post-Gadhafi refugee and terrorist conflict makes it too dangerous to have aid workers on the ground. The project kicked off with a hackfest, in which UN OCHA field officers who monitor Libya shared their operational process and existing issues with Microsoft’s engineers. On a daily basis, UN OCHA Libya specialists monitored approximately 330 distinct data sources, including Twitter and Facebook, local radio, TV and news sources. Understanding the magnitude of this daily work enabled Microsoft’s engineers to propose a pipeline that would automate this data collection and visualize the results.
Providing a more timely and accurate humanitarian response plan helps save lives. Our goal was to accelerate UN OCHA’s ability to respond to these disasters by improving how they monitor their numerous data sources and gain insight from them.
The Solution

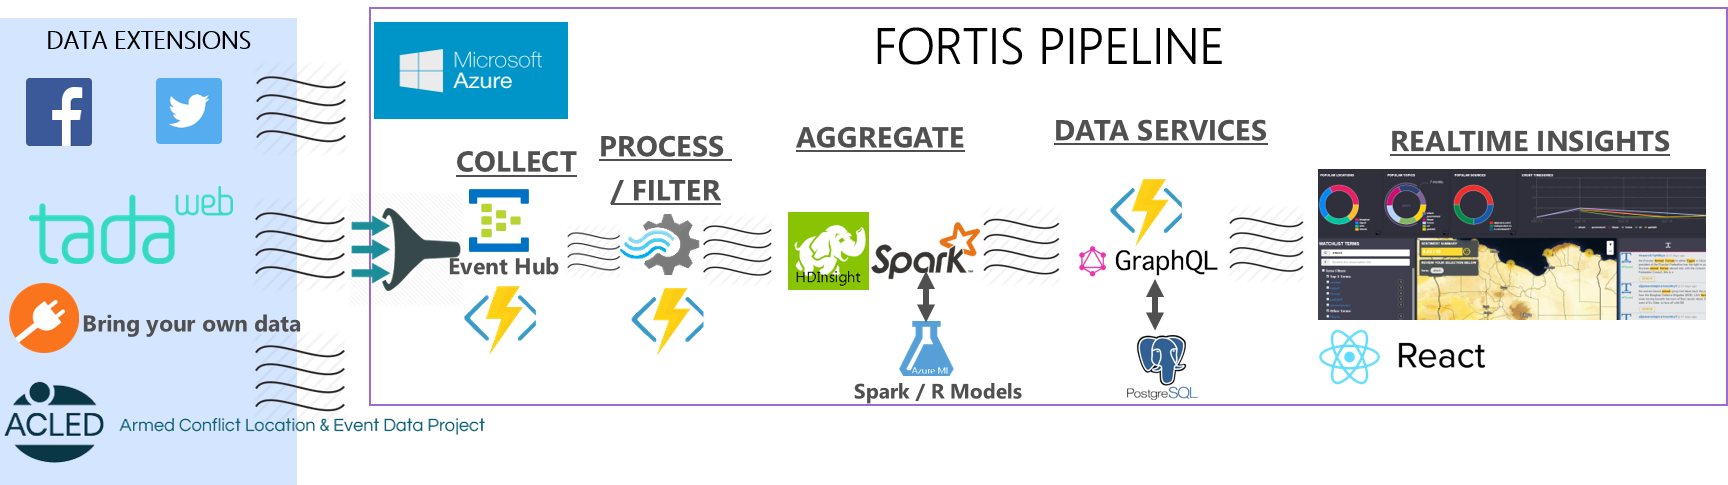
At a high level, we designed and built a data ingestion, analysis, and visualization pipeline. The pipeline collects social media conversations and postings from the public web and darknet data sources. It then performs feature extraction and infers relationships between targeted keywords in real-time. Conversational message streams are paired with sentiment analysis and mood inference modeling alongside with other machine-learning techniques to gain quantitative insight into the topics, demographics, and indicators that drive the key humanitarian conditions for a targeted set of locations. Finally, results are visualized on a dashboard so that a user can see trending topics and keywords over time and geography.
As we spoke to other organizations, we noticed a remarkable consistency in the data analysis needs across a range of industries. Based on this feedback, we generalized the pipeline we built with the United Nations and created Fortis. The Fortis solution was used to provide deeper insights into the relationships between medicines, diseases and epidemic risk zones (such as those for dengue fever or Zika virus). Fortis provides users with the ability to configure a watch list of topics, locations, and data sources. Insights can be reshaped to meet the needs of any user scenario involving deep quantitative insight into social, public or private data sources in real-time.
Additional Application: Dengue Fever Monitoring
Umeå University is one of the leading research institutes for using innovative methods to monitor outbreaks of dengue fever. We worked closely with the university to forecast areas at high-risk of dengue fever in Sri Lanka and Indonesia. The predictive dataset was generated off R-based statistical models that referenced weather forecast humidity, temperature, and precipitation data.
Similar to the UN, the university needed help visualizing trends and insights about dengue fever incidents and interventions, represented across time and space. This information had to be available in real-time and we wanted to converge data from the predictive models and social media to represent a single unified view of reported incidents and symptoms.
Data Sources
For social media sources, we used Twitter’s public filter streaming API to receive Tweets in real-time, Facebook’s Graph API, ACLED’s Rest API for armed conflict-related events across Africa and Asia, and Tadaweb to query a pre-defined list of public web and darknet sites. We also used Weather Underground for the weather forecast dataset.
High-Level Functional Architecture
In this section, we’ll provide a high-level overview of the Fortis core stack, and then dive into the use of GraphQL in the next section.
To begin the ingestion process, data from sources like Facebook or Twitter is streamed into Azure Event Hubs. Azure Functions are used across the system, in keeping with an event-driven, compute-on-demand serverless architecture. Azure Functions enable us to have a microservice code block that is triggered by Azure storage-based operations (Blob, Queue, Tables, No-SQL DBs, Event Hub Writes) or through exposed HTTP endpoints.
We use Spark to scale and distribute the feature extraction operations across an HDInsight cluster. The next version of Fortis will focus on minimizing any disk-related operations outside of the Postgres and Cassandra persistence layers. Spark is an important component of the Fortis architecture, as we have models utilizing libraries from SkLearn, R and GraphX data structures. Where possible, we leverage the native and open source Twitter4J and Facebook4J Spark streaming data connectors to minimize compute latency. Our goal is to leverage the streaming connectors available in Apache Bahir, and contribute any missing connectors (Instagram, Snapchat, Bing, etc) back to Bahir.
GraphQL
GraphQL is our service layer, and provide Fortis clients with the ability to directly query and interface with the processed data results. Our React-based web interface is fully powered by Fortis GraphQL services.
Why Facebook Created Another Framework
GraphQL came about from the Facebook newsfeed team in 2012, as a response to data retrieval latency, especially for their mobile users. The goal was to retrieve as much relevant data as possible in a single round trip to the web server, minimizing round trips and decreasing latency.
What is GraphQL?
GraphQL is a query language for microservice APIs and an alternative to REST. What makes GraphQL so great when querying data is you request the response payload that you want and you get exactly that, and it never changes. Let’s step through a simple Fortis GraphQL query.
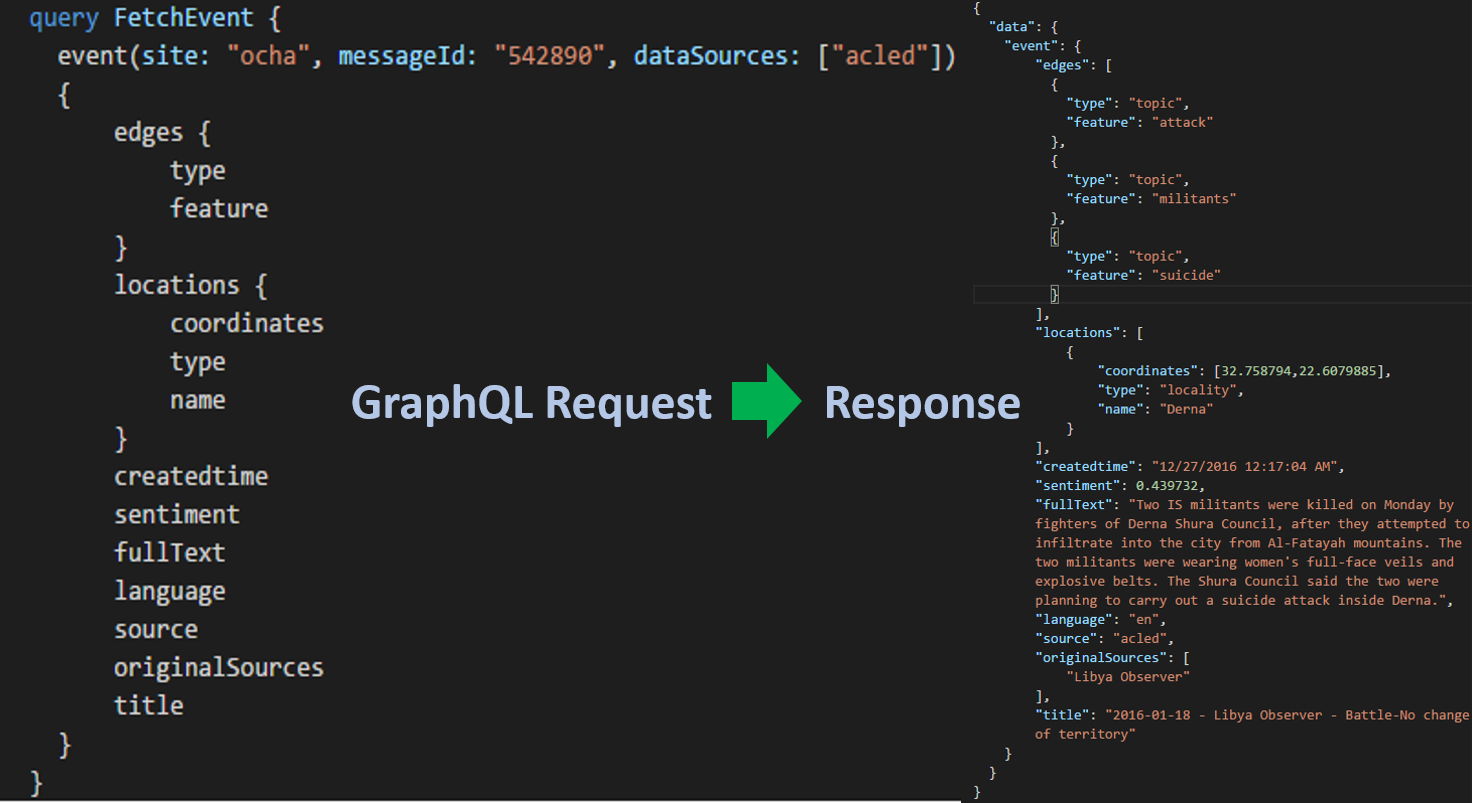
The request schema is a JSON-esque query language that returns—you guessed it—JSON. You can see that the query and the response have the same structure. The curly braces represent a JSON object which is called a selection set in GraphQL. Within a selection set, you have object keys which are called fields.
Fields can also have selection sets. This powerful feature allows you to represent deeply recursive data models and complex data structures. We see this with the edge selection set, which returns a JSON Array of edge objects. In a traditional REST approach, you’d need to chain multiple service requests, resulting in complex SQL joins. With GraphQL, you’re able to achieve complex data retrieval through a single trip to your API server. We can represent these queries at deeper levels (i.e. lists within lists, within lists). Think of it like running a recursive map operation across your entire dataset.
You can also pass arguments to selection sets, enabling front-end developers to interact directly with your query. Common scenarios include paginating datasets, complex filters, and ordering conditions.
In the spirit of minimizing ambiguity in the expected data response, GraphQL forces you to query down to the scalar leaf nodes throughout your query. So, you cannot use something like:
select * from my_rest_endpoint.
Flow: Static Type System
When a query is submitted to a GraphQL server, how does the GraphQL server know the query is valid? Because the GraphQL server is backed by the flow static type system. This type of system describes the data type, its fields and the arguments along the way. GraphQL is aware of what’s possible and what’s not through omission. Below is a snippet of the Event type schema:
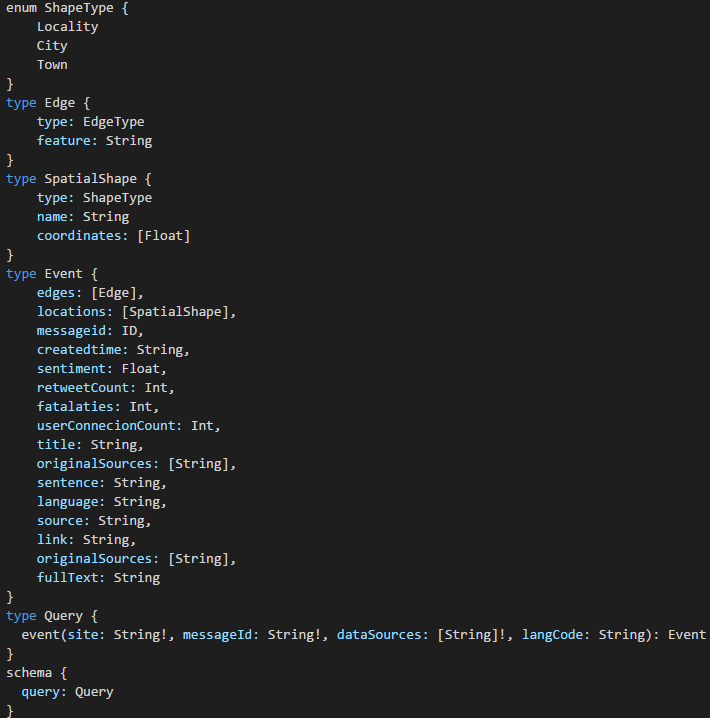
The type system determines if a query is valid or not, and returns a useful error to clients. You’ll notice in the example above, our event query returns an Object of the Event type. The square brackets represent a JSONArray, and the exclamation mark indicates that null values are not allowed (see supported scalar types for more info).
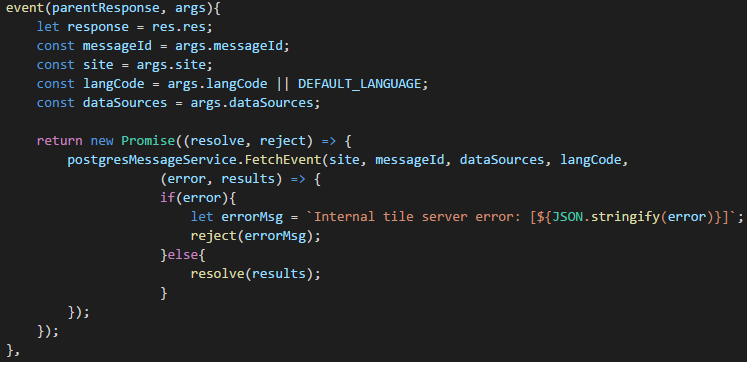
Resolver Functions
We need to tell GraphQL how it should respond to queries, which we will orchestrate through resolver functions. Every field can have its own resolver function which defines how that field should return data. The response from a field’s parent node is passed in as an argument to the resolver. This occurs recursively until all scalar leaf nodes are evaluated. Resolvers support both JSON objects and Promises as return types.
Introspection
GraphQL also supports introspection, meaning that GraphQL can query type schemas including data type documentation. This is a powerful feature and enables GraphQL to be used as a tool to build other tools. You can create rich IDEs and also interact directly with your codebase to learn how your GraphQL server works.
All GraphQL servers are shipped with GraphiQL, a browser-based IDE that enables front-end developers to write and test queries against your web server. GraphiQL supports typeahead while errors and issues are highlighted. The IDE also has an integrated documentation explorer.

Mutations
This code story has focused on fetching data, but no data platform is complete without mutating data, too. These are the equivalents to the POST, PUT, PATCH and DELETE in HTTP/REST. Similar to queries, you specify the return object type and fields once the requested mutation request has been committed and resolved by your API. This feature can be useful for retrieving the new state following the mutation.

Why did we decide to use GraphQL?
To create a more reactive front-end solution, we decided to use the React Flux paradigm. Our visualization components subscribe to GraphQL observables, then data is pushed from backend services to React components to recompute its state on the fly. When it came to which API paradigm to follow, we had faced several challenges with REST, as service clients made subtle assumptions about how the data would come back. REST-based architectures introduced data latent environments and unpredictable results to our users, too.
As we move towards a more real-time pub/sub model, social and public media postings will be running hot on client devices through GraphQL subscription streaming. Fortis users will be viewing results in both web and mobile, and also in locations with poor internet connection ranging up to 1000s of millisecond latency. As a result, minimizing the response payload is crucial.
In addition, clients can plug in their own React-based dashboard visualization components. Maintaining an acceptable developer experience requires decorating react components with higher-order querying integration into Fortis APIs. For example, imagine running a Fortis-live GraphQL query during the next US presidential election debates to gain an understanding of public opinion around foreign policy as distributed across the country. GraphQL provides front-end engineers this sort of flexibility to easily re-shape trends and insights across Fortis.
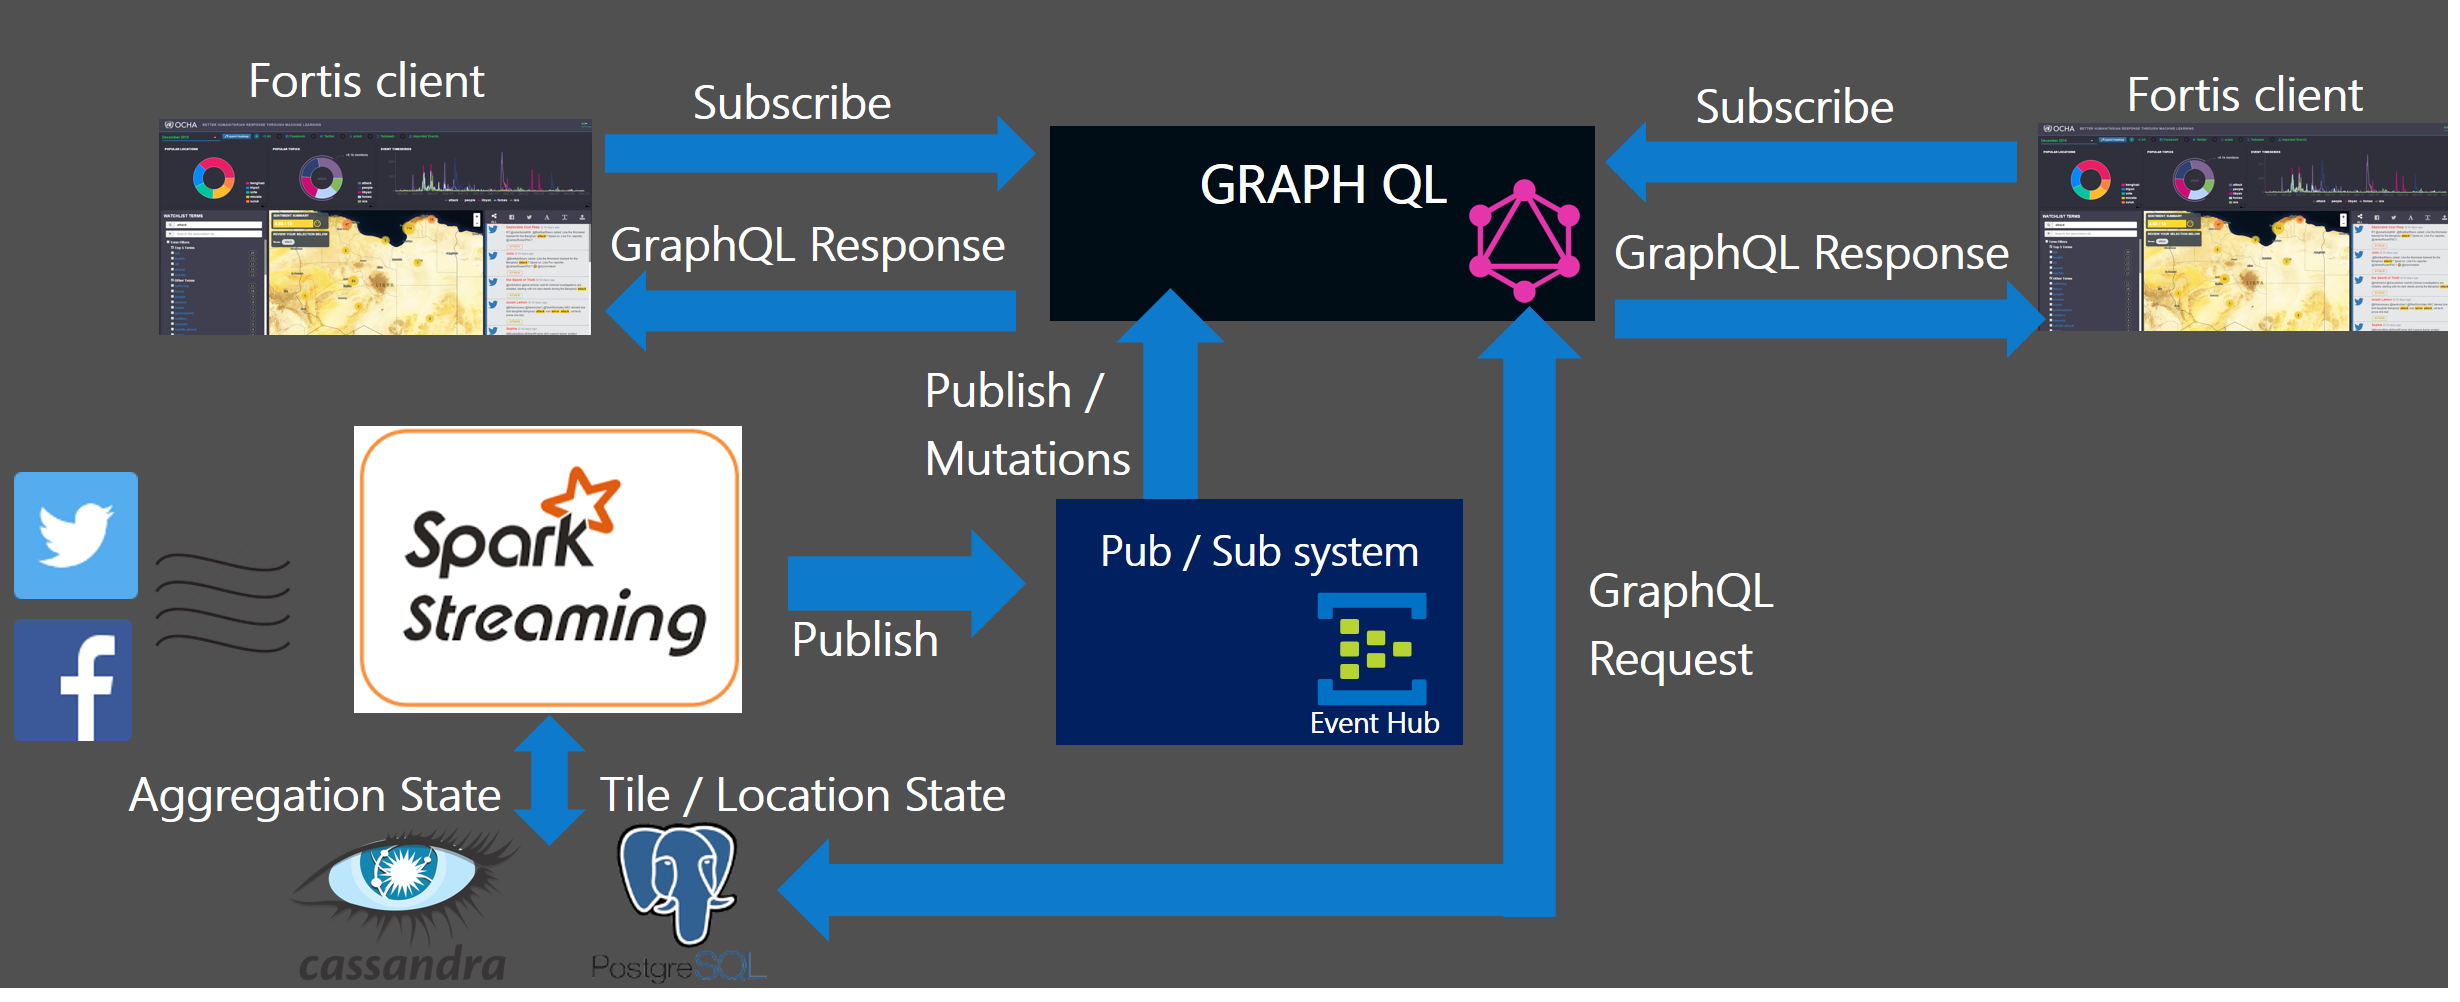
Using GraphQL Subscriptions with Spark Streaming
Feature extraction computations such as inferring discussion topics, gender, entities, mood, sentiment, etc. are all distributed across our Spark cluster. The same applies for our predictive R-based models for utilizing weather forecast data to identify high-risk zones for health-related epidemics. The resulting data is persisted to a Postgres server, as we aggregate the underlying dataset in the form of geotiles to visualize the trends on a heat map.
So, how should we write the Spark computed result to Postgres in an efficient way? GraphQL subscriptions are another action type that allows clients to wire-up GraphQL with a pub-sub system (i.e. Event Hub, Redis, Kafka). Subscriptions allow us to build more reactive backend extensions and real-time services. The general idea is that GraphQL becomes the consumer of an Event Hub or Kafka topic, while Spark acts as the message producer. The GraphQL subscription resolver handlers respond to these published messages and commit the tile data entries into Postgres.
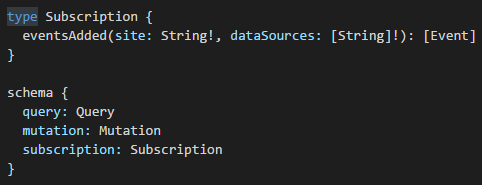
First, we create a root schema definition and resolver, similar to Query and Mutation. In this case, a JSONArray of event objects is streamed to all Fortis clients.
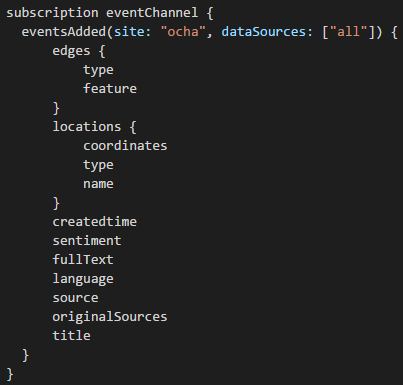
Clients subscribe to the observable eventsAdded where newly published events are pushed down to all active subscriptions. The response is described in the form of a GraphQL query.
Apollo is the production-grade GraphQL client framework, supporting platforms like Android, React, Express, React Native, Angular, C# and iOS. It’s recommended to use a client framework like Apollo or Relay to get the most out of your GraphQL server. Both Apollo and Relay support features such as query and data caching, optimistic UI updates, batching, pagination, routing, test harness and real-time subscription utilities. Check out this Apollo tutorial for instructions on setting up a GraphQL server to support subscriptions.
Does GraphQL require React?
GraphQL uses the HTTP protocol and has no dependencies on React. Apollo supports most of the popular device platforms used today.
Setting up GraphQL on Azure
Apollo helps ease the developer experience when onboarding a new GraphQL express server to Azure. We’ll start with a boilerplate Node-based express app published by Apollo.
Follow the commands below to bootstrap the baseline node app.
git clone https://github.com/apollostack/apollo-starter-kit
cd apollo-starter-kit
git checkout server-only
npm install
npm start
Once the GraphQL server is online you should be able to access the GraphiQL IDE and run a sample query at localhost:8080/grapqhl.
{
  testString
}
You should see a response in the IDE response pane. You can walk through some other setup steps following this tutorial to help get your feet wet with GraphQL.
When you’re ready to deploy to Azure, push your changes to a GitHub repo. Then create an Azure API App resource via the portal, and set up GitHub continuous integration via Kudu in the Deployment tab in Azure.
Final Thoughts
Adding GraphQL to Fortis gives Fortis clients a flexible convention for interacting directly with our data APIs. There’s a growing set of open source tools — including Graphcool, Apollo, and Relay — that make it easier to get started with GraphQL.
The goal of Fortis is to provide deeper insight and analysis across a broad range of data, geographies, and scenarios. While we started by focusing on the challenges of humanitarian aid planning in Libya, Fortis’ generalized infrastructure enabled developers to leverage the pipeline in other domains.
We accept Pull Requests of all shapes and sizes and encourage developers to check out the Fortis GitHub repository and issue list and contribute to this incredibly important effort.
 Light
Light Dark
Dark
0 comments