
Regulating Sensor Error in Wastewater Management Systems with Machine Learning
Overview
The following code story outlines a novel method for differentiating between anomalies and expected outliers using the Microsoft Anomaly Detection API and Binary Classification to assist with Time Series Filtering.
Background
Carl Data Solutions provides a suite of software tools called Flow Works, that are used by municipalities to help manage their wastewater infrastructure. Their tools pull data from various sensor channels that measure variables such as water flow, velocity, and depth.
These sensors sometimes malfunction or behave unexpectedly, causing skewed readings. Since forecasting models are built on top of these sensors, skewed data can negatively influence accuracy. Currently, to account for irregularities, municipalities that use Carl Data’s flow works solutions hire consultants to manually sift through all the sensor data and modify values believed to be caused by sensor error.
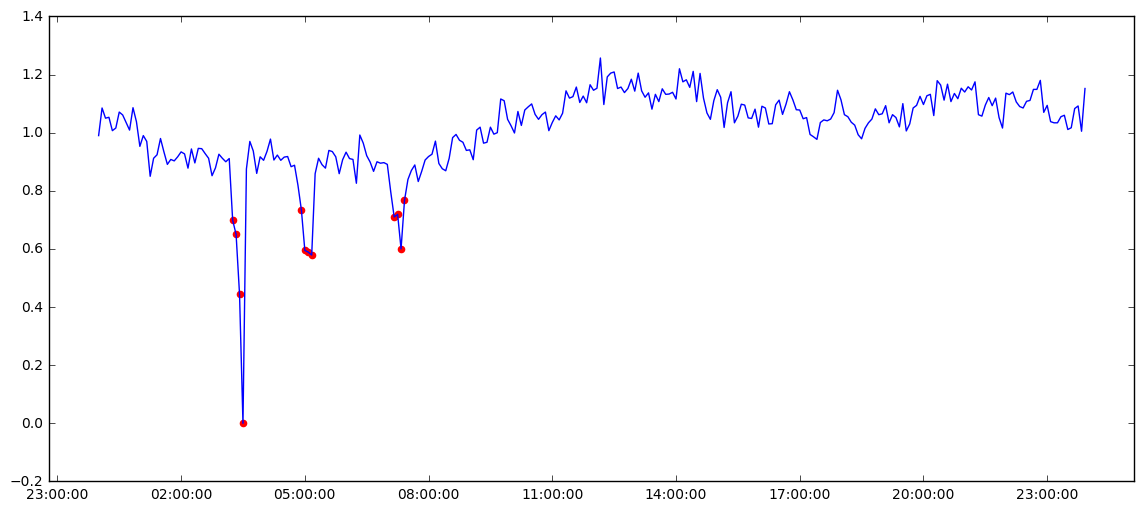
Sample Daily Sensor Readings with Tagged Anomalies.
Due to the overhead in time and cost, Carl Data was interested in building an anomaly detection model to automate the identification of these errors.
The Problem
Since sensor errors occur infrequently, the training set compiled from Carl Data’s curated logs contained many more “clean” values than “dirty” ones. When there is a highly uneven distribution of training samples, traditional binary classifiers sometimes struggle to identify sensor errors since they get overwhelmed by positive examples. Often unsupervised time series outlier detection algorithms are applied to locate irregular flow.
However, unsupervised Outlier Detection frameworks such as Twitter’s Anomaly Detection Package or Microsoft’s Anomaly Detection API, while great for detecting irregularities in flow cannot differentiate between expected irregular behavior such as a peak caused by a flood and sensor error. Additionally, these APIs only make batch classifications which are slow for real-time detection purposes.
The Engagement
Microsoft partnered with Carl Data to help investigate how to build an anomaly detection model that could differentiate between irregularities and put the model into production using Event Hubs and PowerBI.
Anomaly Detection ML Methodology
Model #1 : Outlier Detection (Unsupervised)
- Read in raw historical data from the velocity sensor channel.
- Read in the tagged anomalies from the curated velocity sensor channel data.
- Send the raw data to the Microsoft Anomaly Detection API to tag outliers.
- Score outlier model using Anomaly Detection API results against the ‘manually tagged anomalies.’
Model #2: Binary Classifier (Supervised)
- Read in raw historical data from the velocity sensor channel.
- Read in and merge the tagged anomalies from the curated velocity sensor channel data.
- Create a historical window of the previous four velocity channel readings values at each time.
- Create a train and test set from a random split on the historical windows.
- Train a random forest classifier on the train data.
- Benchmark the random forest on the test data.
Model #3: Hybrid Classifier (Differentiate Between Anomalies and Outliers)
- Read in raw historical data from the velocity sensor channel.
- Read in the tagged anomalies from the curated velocity sensor channel data.
- Send the raw data to the Microsoft Anomaly Detection API to tag outliers.
- Create a historical window of the previous four velocity channel readings values at each time using only the values marked as outliers.
- Create a train and test set from a random split on the historical windows.
- Train a random forest classifier on the train data.
- Benchmark the random forest on the test data.
- Benchmark the random forest on the entire velocity time series excluding the training set.
Integration Methodology
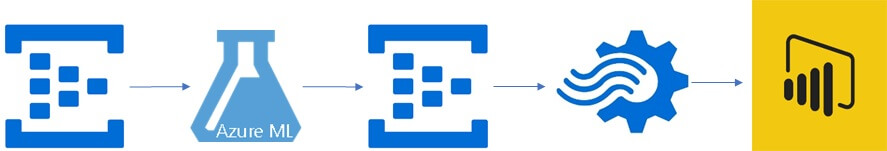
- Push the channel data to Anomaly Detection Event Hub with window size n.
- On new events, tag whether they are anomalies or not using the model built in the last section.
- Push tagged channel data to the visualization Event Hub.
- Use Stream Analytics to ingest the visualization Event Hub.
- Import Stream Analytics to PowerBI to visualize tagged anomalies.
Results
During this engagement, we successfully built three models using a combination of the Microsoft Anomaly Detection API and an ensemble of random forests and logistic regression to identify sensor error.
Though the Anomaly Detection API helped differentiate identity outliers for anomaly classification, in Carl Data’s dataset the difference between anomalies and regular flow was linearly differentiable enough that a random forest binary classifier provided just as good results as the approach combined with the Anomaly Detection API.
Sometimes, analysts might tag a couple of values around an anomalous sensor spike as anomalies, too. The Anomaly Detection API has trouble tagging these values. However, in cases where sensor error is better represented, and anomalies are not as linearly differentiable, the hybrid method can be used to yield more generalizable results than a binary classifier alone.
The model we chose performed as follows, with high precision (99%) and recall (100%):
Benchmarks on model from the SciKit learn benchmarking module 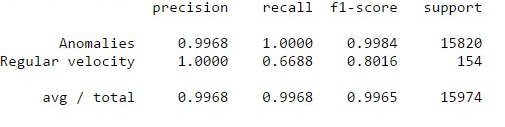
Code
You can find the notebook and code for implementing this methodology on GitHub.
Opportunities for Reuse
The methodology exhibited in this code story is important for highlighting time series machine learning applications in an underrepresented domain such as wastewater management.
Additionally, as the field of IoT matures from data aggregation to predictive intelligence, it becomes increasingly critical to be able to differentiate between anomalies that are caused by sensor error and those that are expected outliers. As a result, the approach outlined in this code story will be helpful for such use cases.
 Light
Light Dark
Dark
0 comments