
Comparing Results Delivered by Logistic Regression and a Neural Network
Emotion Detection and Recognition from text is a recent field of research that is closely related to Sentiment Analysis. Sentiment Analysis aims to detect positive, neutral, or negative feelings from text, whereas Emotion Analysis aims to detect and recognize types of feelings through the expression of text, such as anger, disgust, fear, happiness, sadness or surprise. Emotion Analysis has many useful applications such as gauging how happy our citizens are, or enabling pervasive computing to tailor responses to the individual. Using machine learning, an application could use Emotion Analysis to suggest help when anxiety is detected, or to tailor a response to how a consumer feels about a product or service.
Machine learning is a popular approach to this natural language understanding task. Sometimes, it is tempting to jump to an algorithm or approach that is popular at the time, or something that we are familiar with, or bias our choice towards a more elaborate or sophisticated method. However, is it always the case that the more sophisticated the algorithm or method, the better the results? And even if the results are better, how much does that theoretical gain translate into actual gain for a real world problem?
In this code story, we run Emotion Analysis on a set of informal short English messages (see here), and compare empirically the performance achieved by logistic regression against a fully connected neural network. Logistic regression can be thought of a single neuron in a neural network. The neural network we use here has 1 hidden layer and 125 neurons. Of course, this is a relatively simple comparison; a comprehensive comparison would provide deeper insight, and would require a great deal more effort.
The data
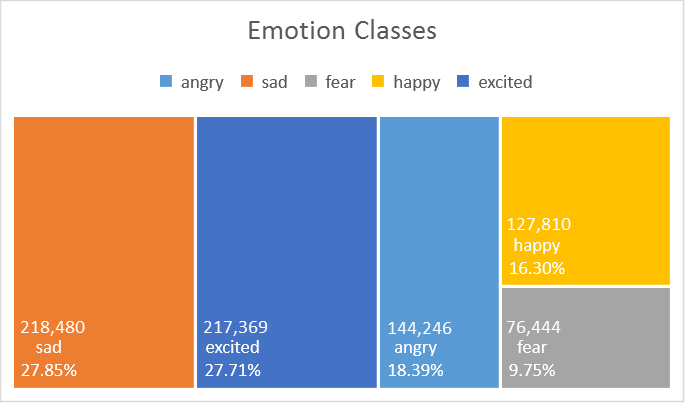
The dataset (see details here) used in this experiment consists of 784,349 sample informal short English messages (a collection of English Tweets), with 5 emotion classes: angry, sad, fear, happy, excited, where 60% is used for training, 20% for validation and 20% for testing. Bi-grams of those text messages are used as emotion features. This is currently a private dataset.
Results and Discussion
| Logistic Regression | Neural Network | |||
| Accuracy (%) | 67.20 | 65.29 | ||
| Time(s) | 631 | 6074 |
Accuracy here is defined as the total number of correctly predicted instances over the total instances in the test dataset. Time is the computational time measured in seconds required for both training and testing, where a large proportion is attributed to training. Here, recall refers to true positive rate, frac{text{true positive}}{true positive + false negative} , while precision refers to frac{text{true positive}}{true positive + false positive} .
As shown in the table above, logistic regression outperforms neural network by approximately 2% on overall accuracy in this experiment setting (see The Details section), while the computation time is approximately 10 times faster.
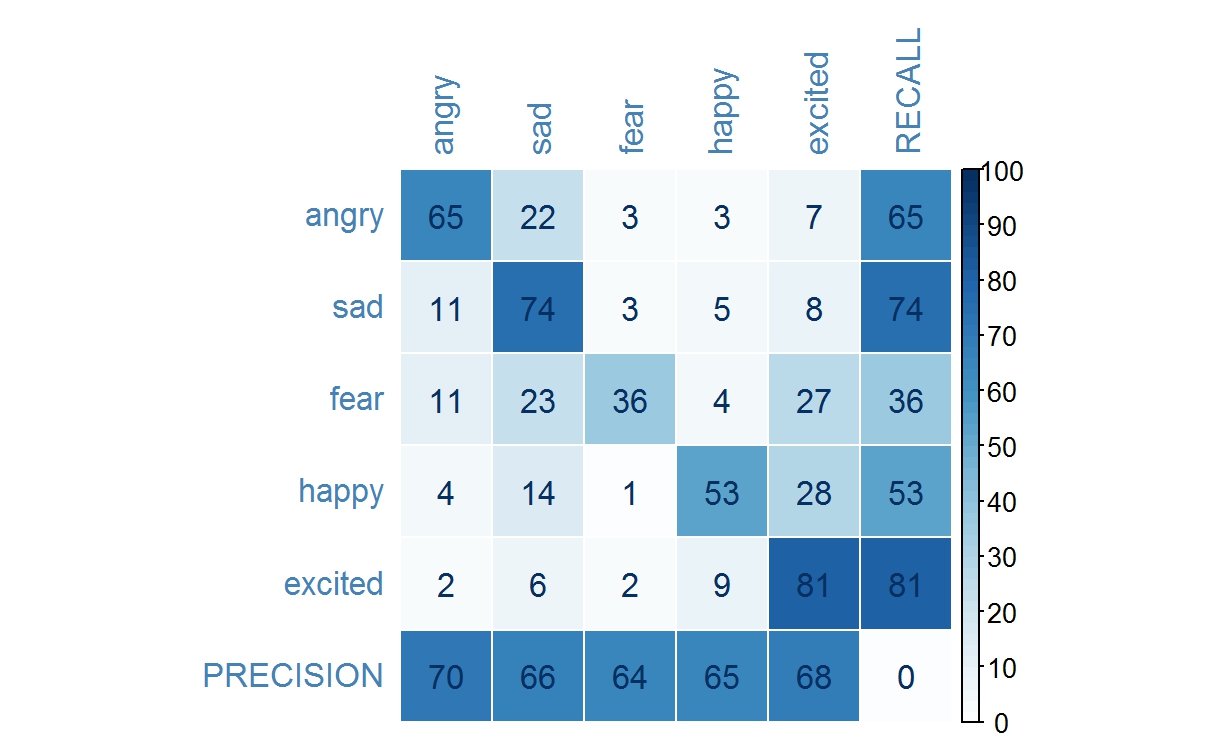
The table below shows the confusion matrix for each emotion classes, when using logistic regression and neural network of 1 hidden layer with 125 neurons, respectively. The logistic regression recall rate for emotion classes sad and excited outperforms that of neural network by approximately 5%, whereas the neural network recall rate for emotion classes angry, fear and happy outperform that of logistic regression, by approximately 2%, 5% and 1% respectively. In terms of precision, logistic regression outperforms neural network for all emotion classes, except for emotion class excited.
 Figue_2_Logistic_Regression_Confusion_Matrix.jpeg
Figure: Confusion matrix for emotion classes when using logistic regression.
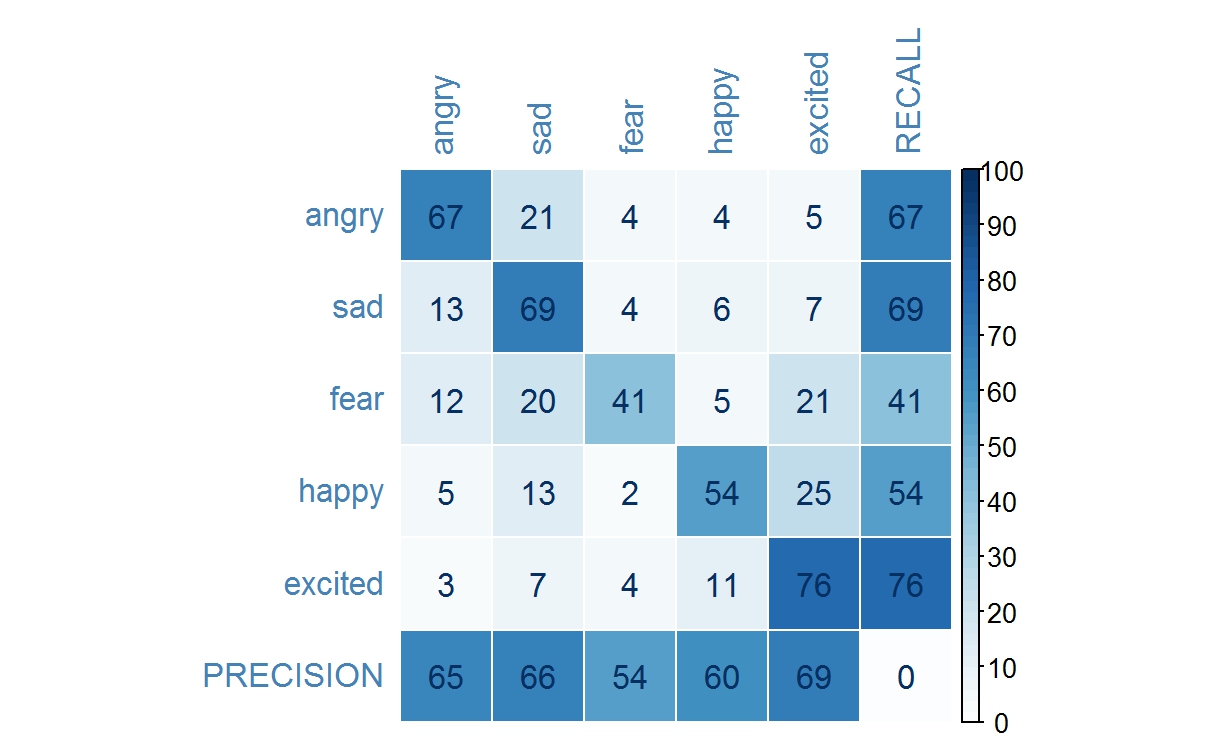
Figure: Confusion matrix for emotion classes when using neural network.
In this case, while neither algorithm handles all five emotion classes accurately, the recall rate for fear is below satisfactory, and logistic regression does outperform neural network by 2% overall. This experiment demonstrates that not only there is no performance gain using a more sophisticated algorithm, it also adds to the cost of training time.
Have you ever wondered:
- How text based feature representation, such as uni-gram, bi-gram and tri-gram can impact performance in a classification task?
- Notice that the distribution of classes in this dataset is imbalanced. How do data distribution impact performance? Some classes are naturally similar to another, for example, happy and excited, simply because the way we express those feelings are more similar as compared to say, angry. How could confusion between classes arise?
- How the number of neurons in a fully connected neural network can impact performance? How about the number of hidden layers? See here.
The Details:
Toolkit:
Microsoft internal machine learning toolkit.
Experiments settings:
| Learner Type | Multi-Class Logistic Regression | |
| Linear combination of L1 and L2 regularizations | Coefficients of 1, 1 | |
| Optimization Tolerance | 1E-07 | |
| Memory Size (L-BFGS) | 20 | |
| Feature Normalization | Min-max normalizer | |
| Initial Weights Scale | Random | |
| Max Number of Iterations | 1000 |
| Learner Type | Neural Network | |
| Number of output nodes | 5 | |
| Loss function | Cross entropy | |
| Hidden layer | See table below | |
| Number of nodes for each hidden layer | See table below | |
| Maximum number of training iterations1 | 100 | |
| Optimization Algorithm | Stochastic gradient descent | |
| Learning rate | 0.001 | |
| Early stopping rule | Loss in generality (stops when the score degraded 5 times in a row) | |
| Pre-training | True for 2 or more hidden layers | |
| Pre-trainer type | Greedy | |
| Pre-training epoch | 25 |
Full results:
Full results can be found at https://github.com/ryubidragonfire/Emotion
 Light
Light Dark
Dark
0 comments