
What’s new for C++ Debugging in Visual Studio Code
It’s been a minute since our last blog post about C++ in VS Code, but we’ve been working hard on new features and bug fixes! Today, we’re excited to fill you in on the latest and greatest C++ debugger improvements in VS Code, including support for the Apple M1 chip, data breakpoints, and a new run/debug play button!
Apple Silicon ARM64 (M1 chip)
Last year, we enabled language server support for Apple Silicon ARM64 architecture, which meant you could run the C++ extension’s language server (responsible for things like IntelliSense, code navigation, and autocomplete) natively on the Apple M1 chip. At the time, the C++ extension’s debugger binaries did not run natively on the M1 chip. Now, they do!
With this latest release of the C++ extension, you can seamlessly debug C++ programs when running VS Code on the M1 chip. Give it a try and let us know what you think! If you run into any issues, please follow up on the GitHub tracking issue (#7035).
Data breakpoints
In case you missed it, version 1.8.4 of the C++ extension brought support for data breakpoints (#1410) while debugging C++ programs with GDB in VS Code. Data breakpoints break execution when a value stored at a specified memory address changes.
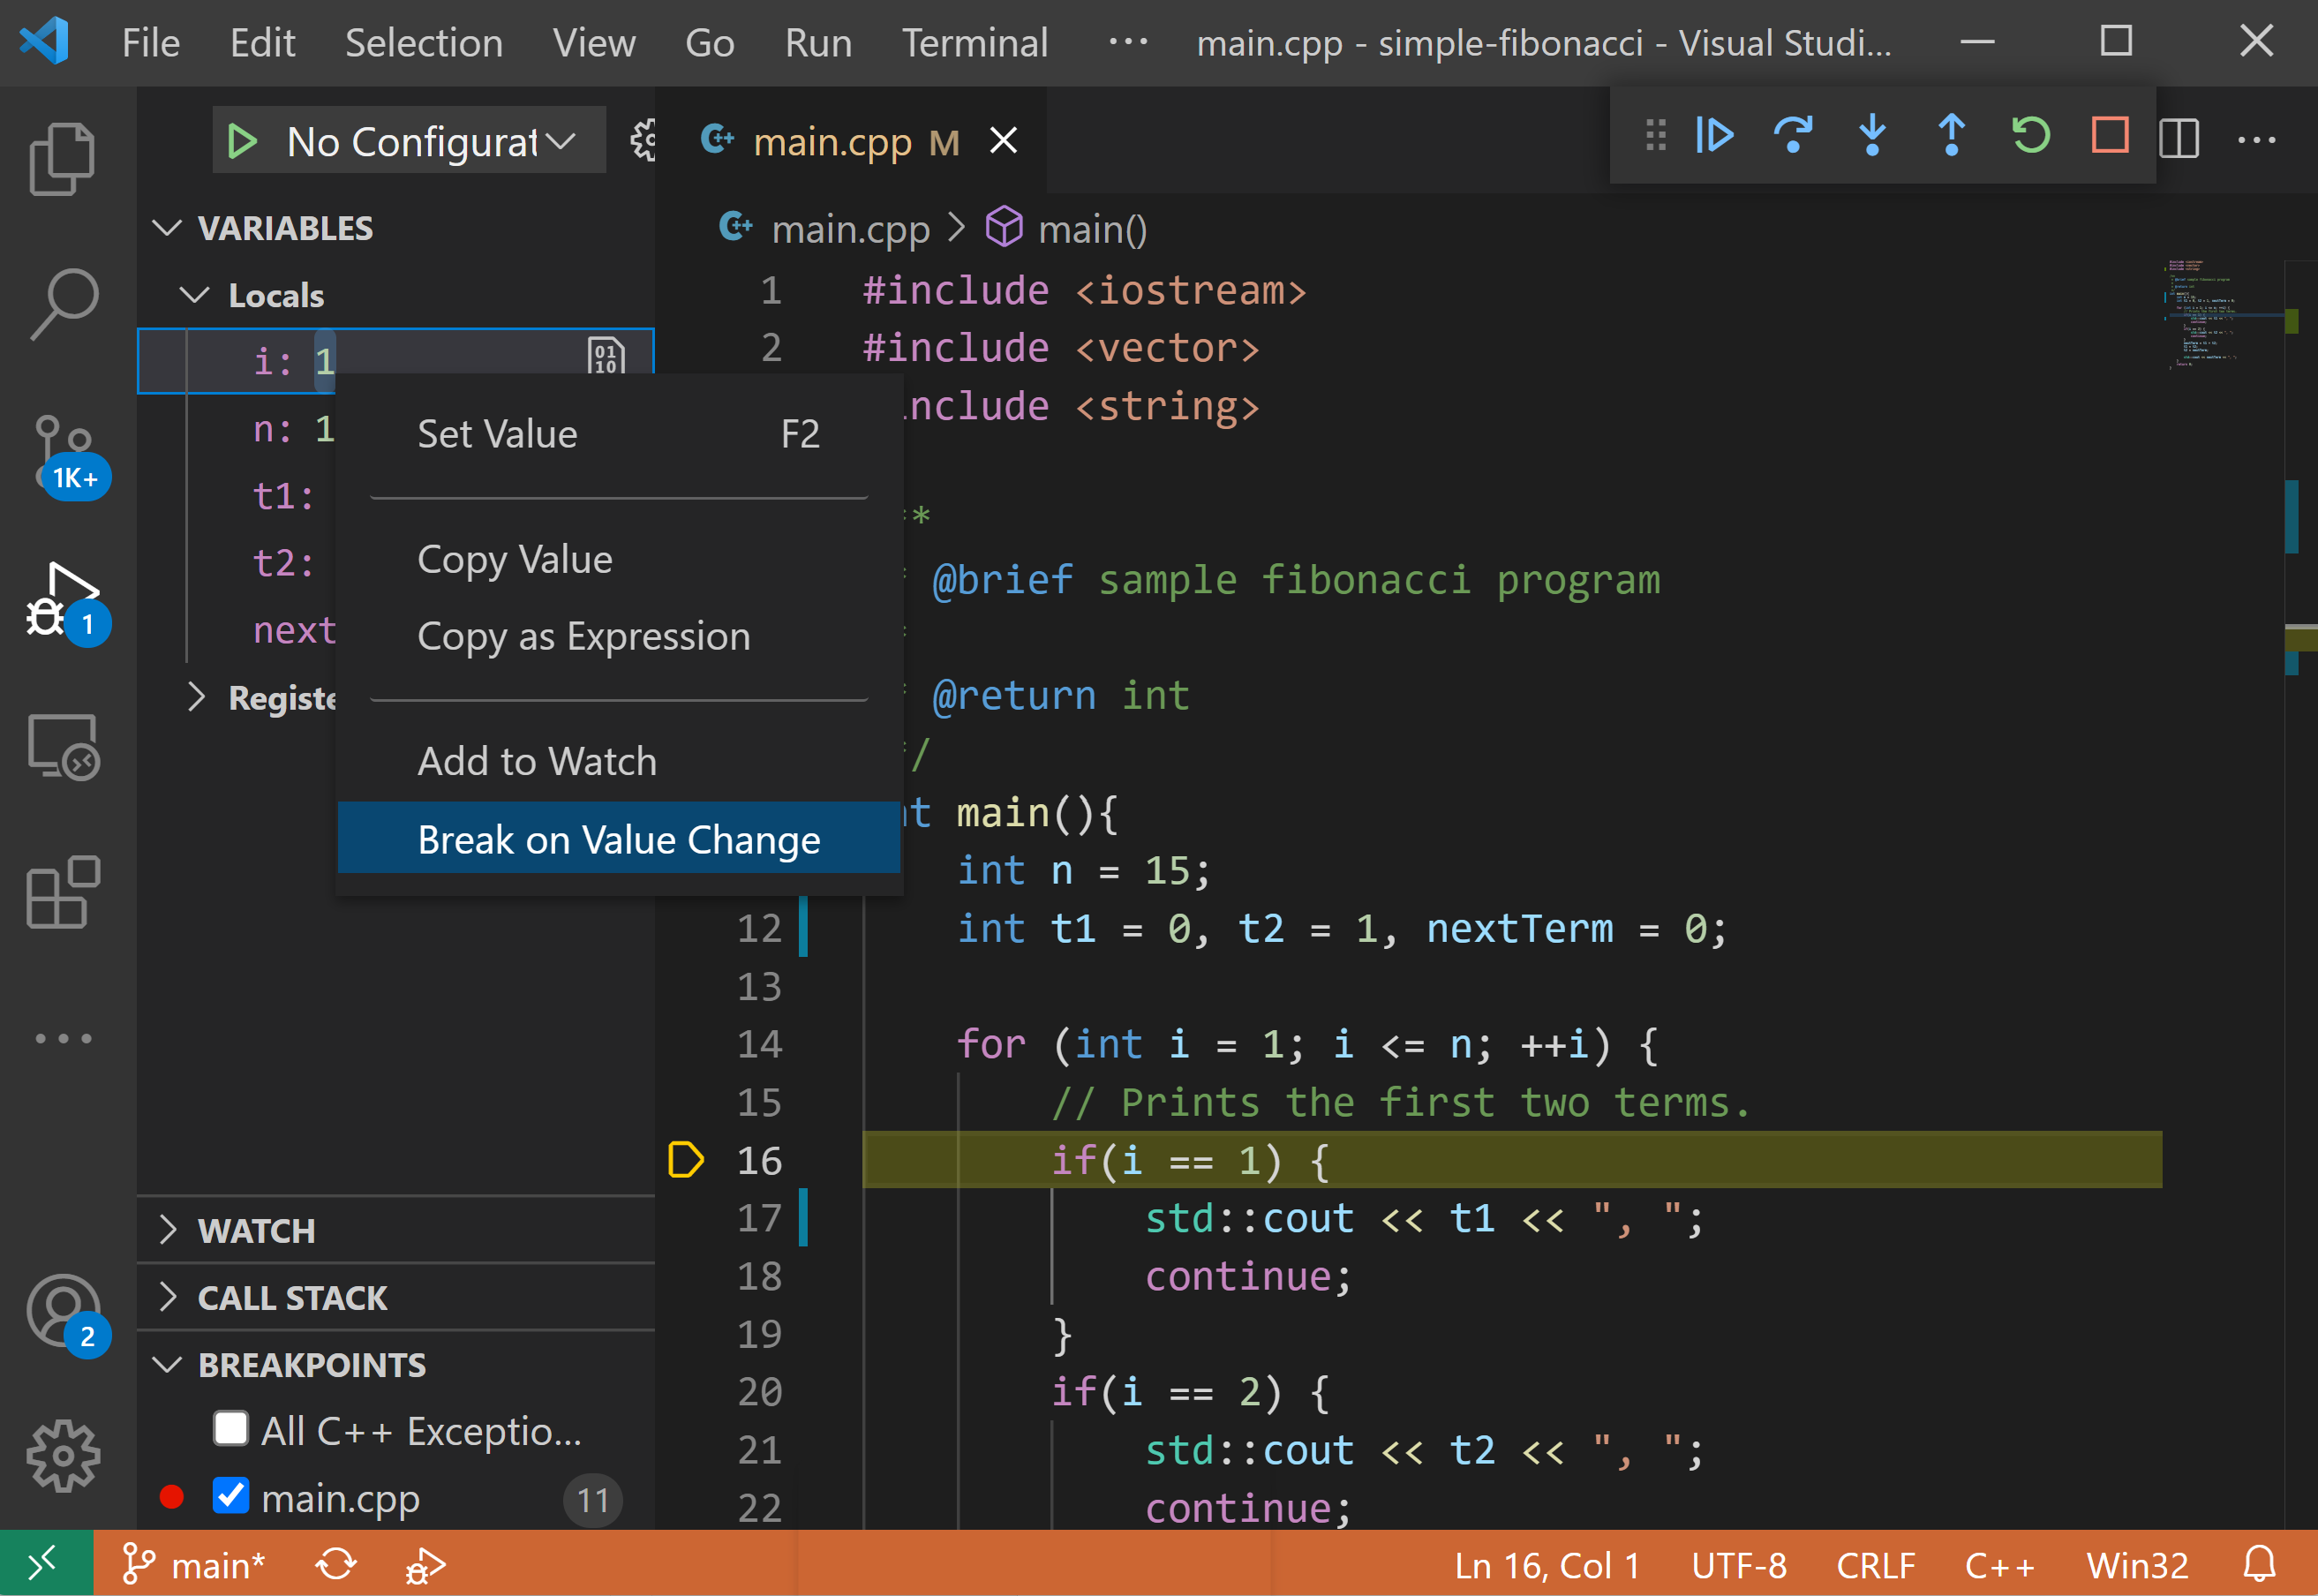
To set a data breakpoint while debugging in VS Code, right click on a variable in the debug pane and select Break on Value Change.
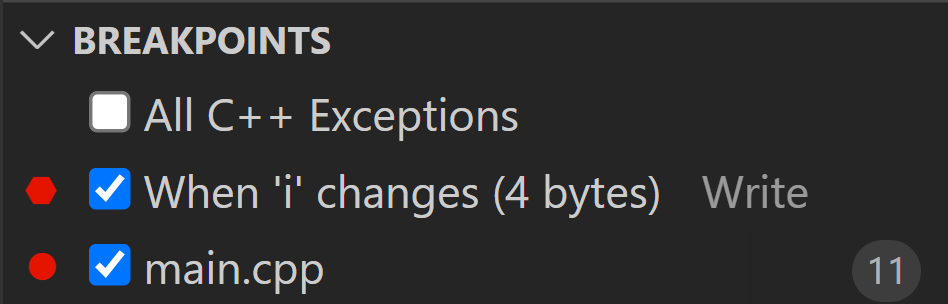
Immediately, you’ll see the data breakpoint listed in the Breakpoints section of the debug pane.
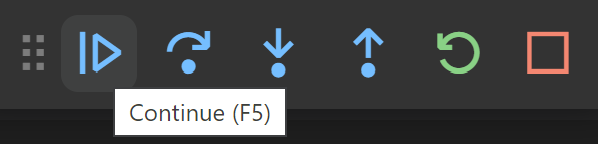
In this example, if we continue running the program, the next time it breaks will be when local variable i changes value. Use the debug control panel to continue running the program.
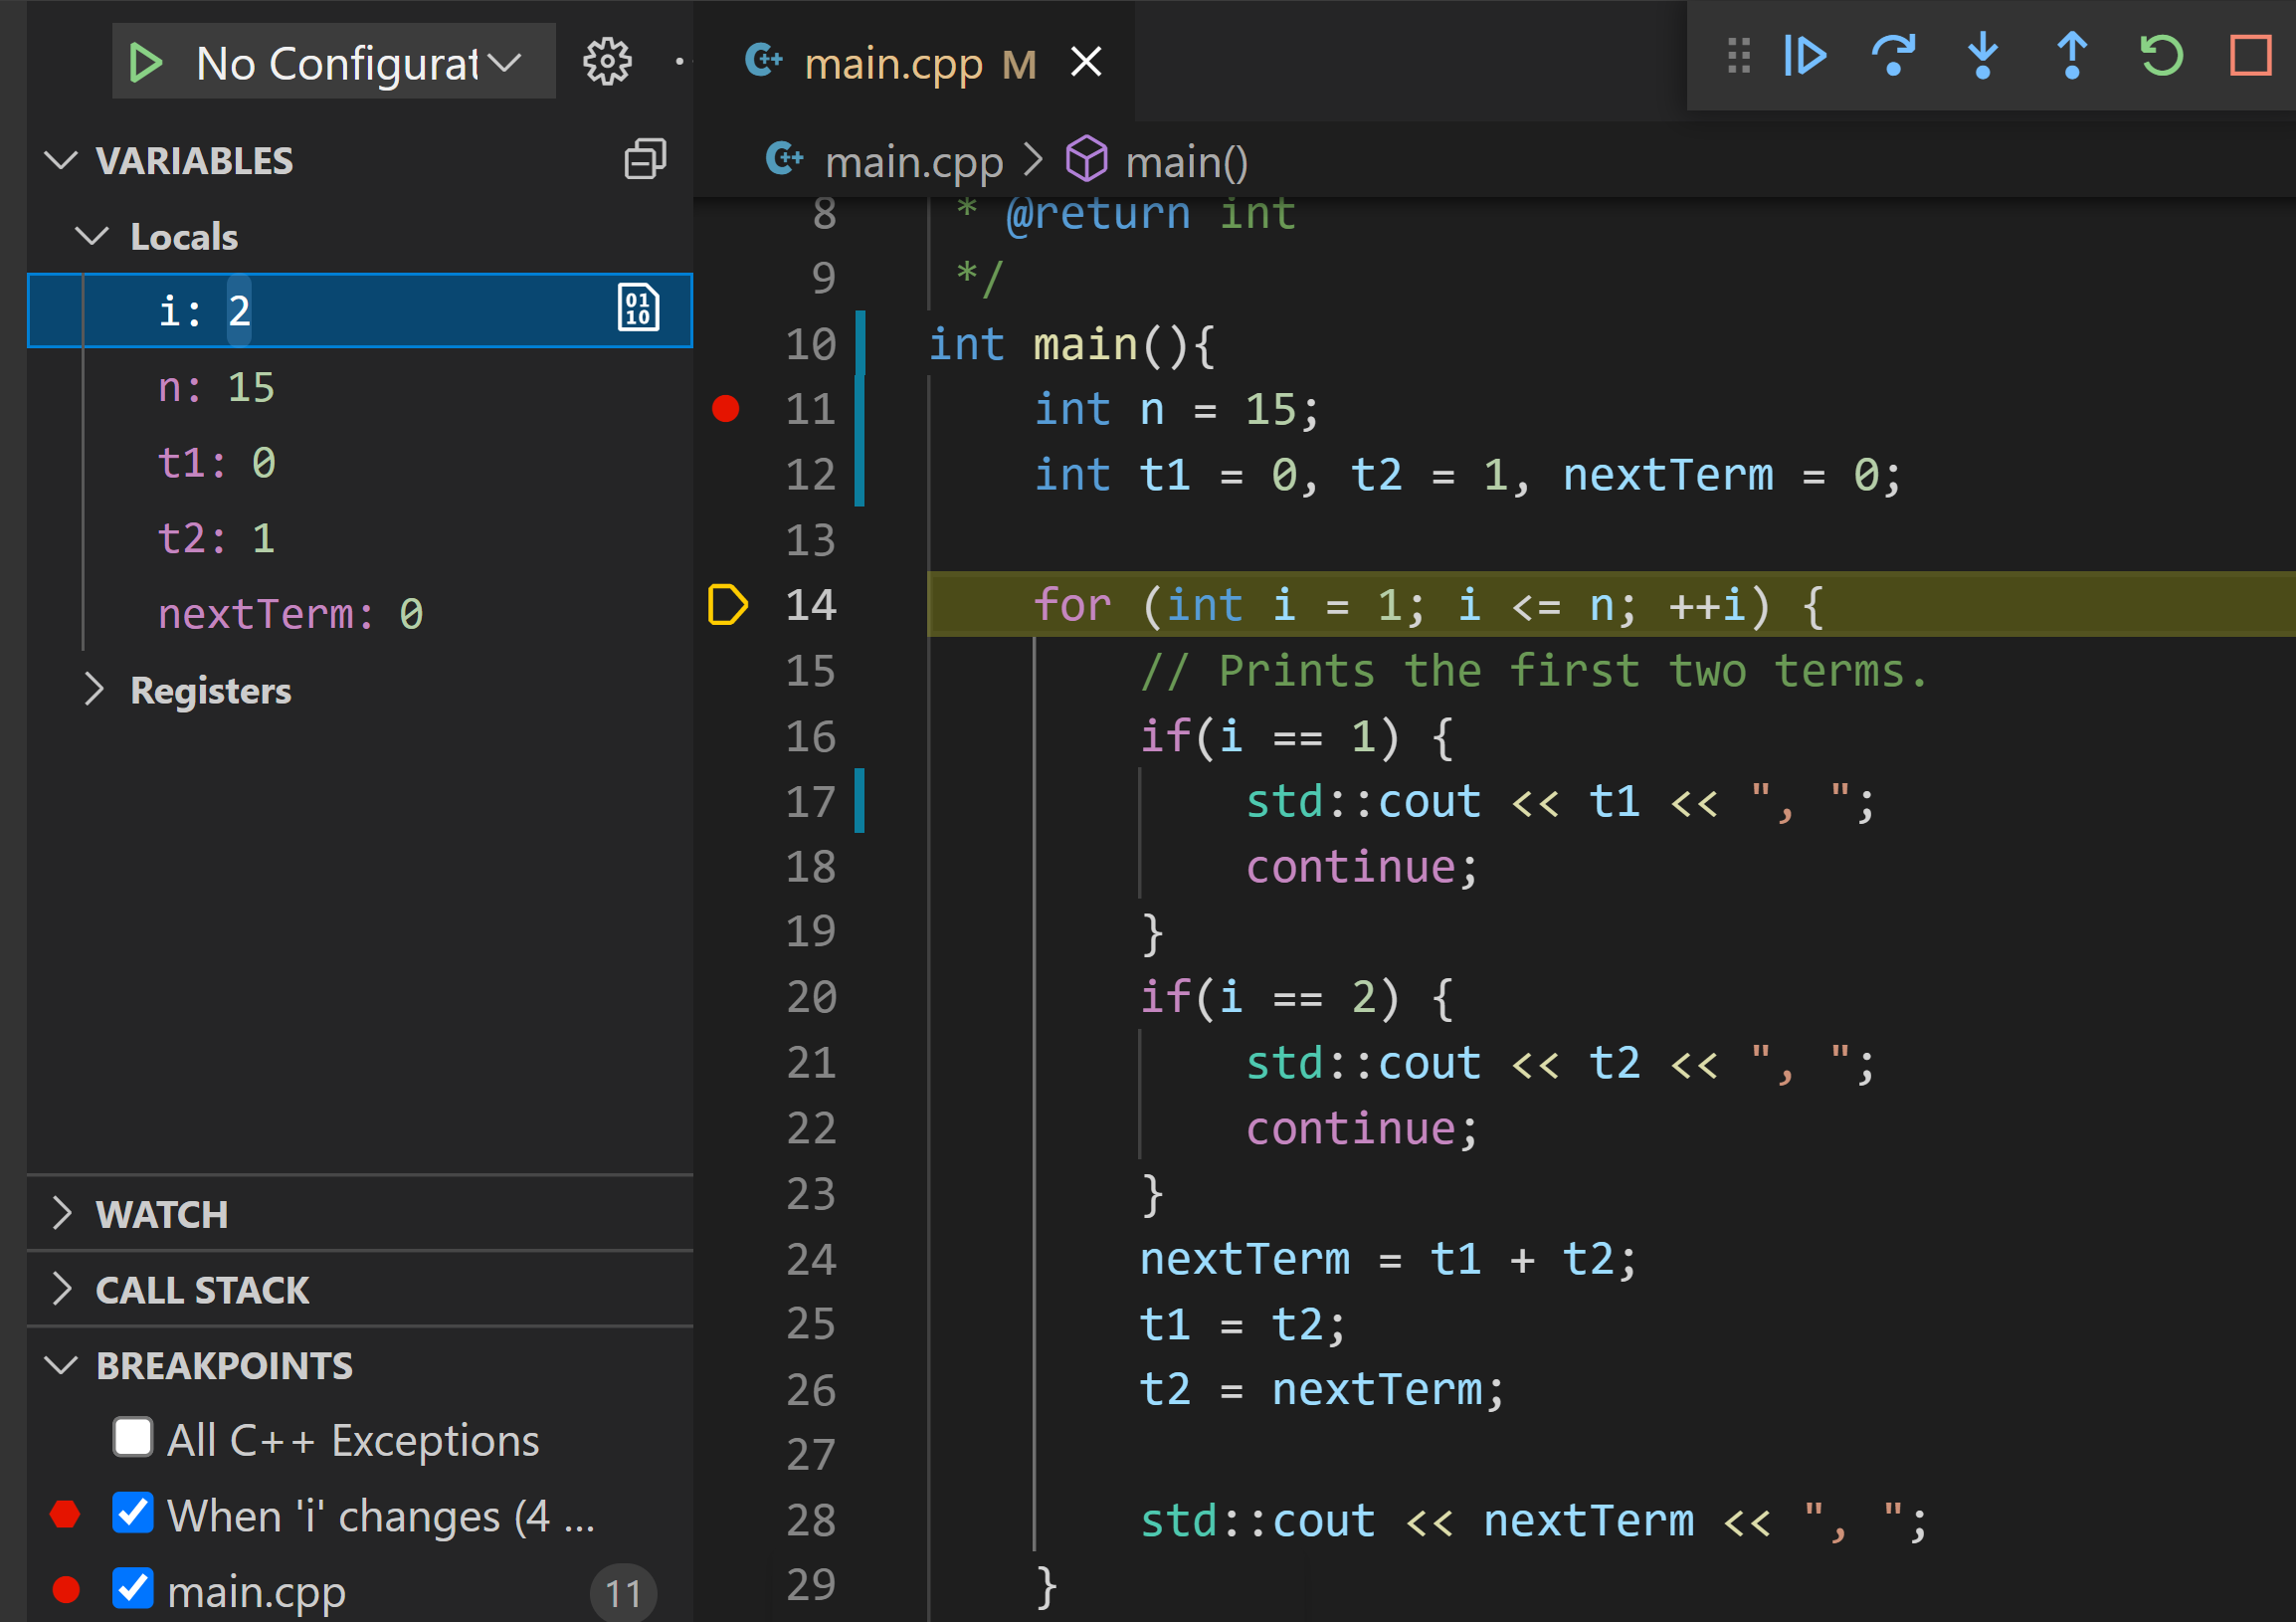
Sure enough, execution breaks when i changes value from 1 to 2.
Troubleshooting data breakpoints
In this same example program, if you set a data breakpoint on msg of type string, you might see an error message in the Debug Console that says: Unable to set data breakpoint: Value does not fall within the expected range. (Parameter ‘size’).
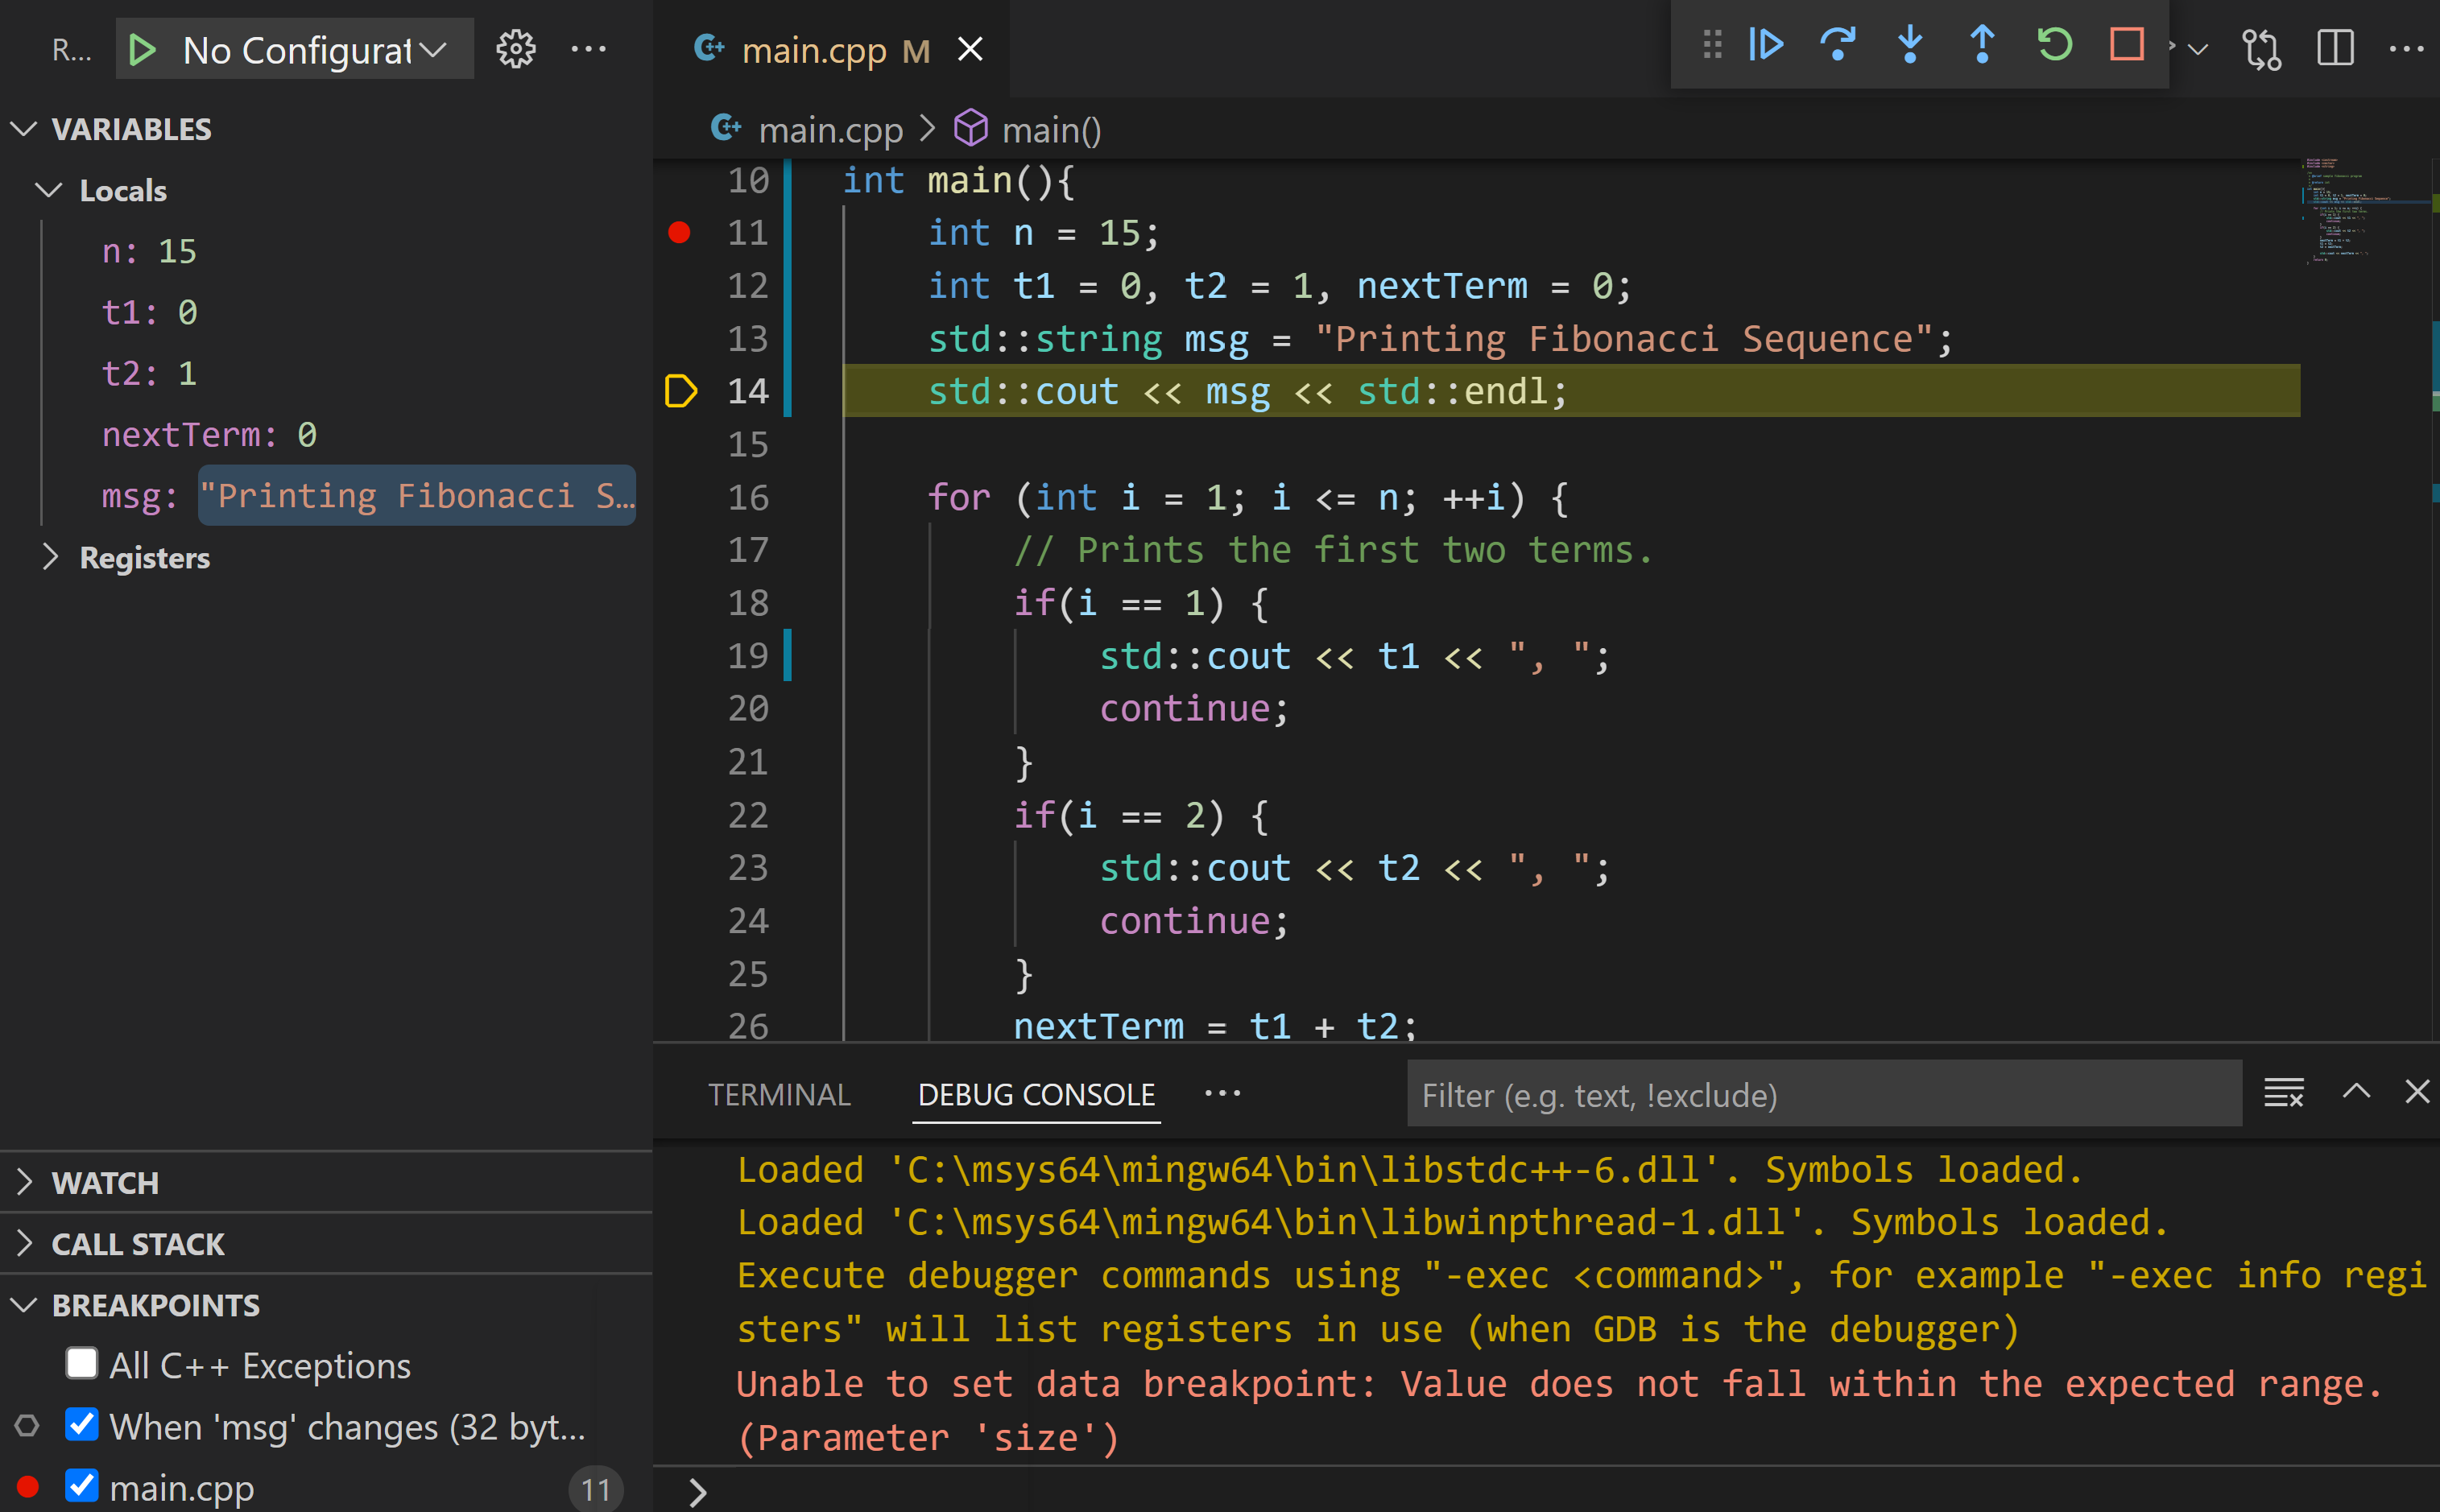
This is because the string type is 32 bytes, and there’s a limitation on the size we can set data breakpoints on. This limitation comes from the fact that the architecture that your program runs on has a limited number of hardware data breakpoints it can use. The table below shows how many registers are available to use per architecture.
| DATA BREAKPOINT HARDWARE LIMITATIONS | ||
| Architecture | Number of hardware supported data breakpoints | Max byte size |
| x86 | 4 | 4 |
| x64 | 4 | 8 |
| ARM | 1 | 4 |
| ARM64 | 2 | 8 |
Quick run/debug play button
We know that setting up tasks.json and launch.json to run and debug C++ files isn’t always fun. We’re excited to announce that, thanks to this latest release, running and debugging C++ files in VS Code has never been easier!
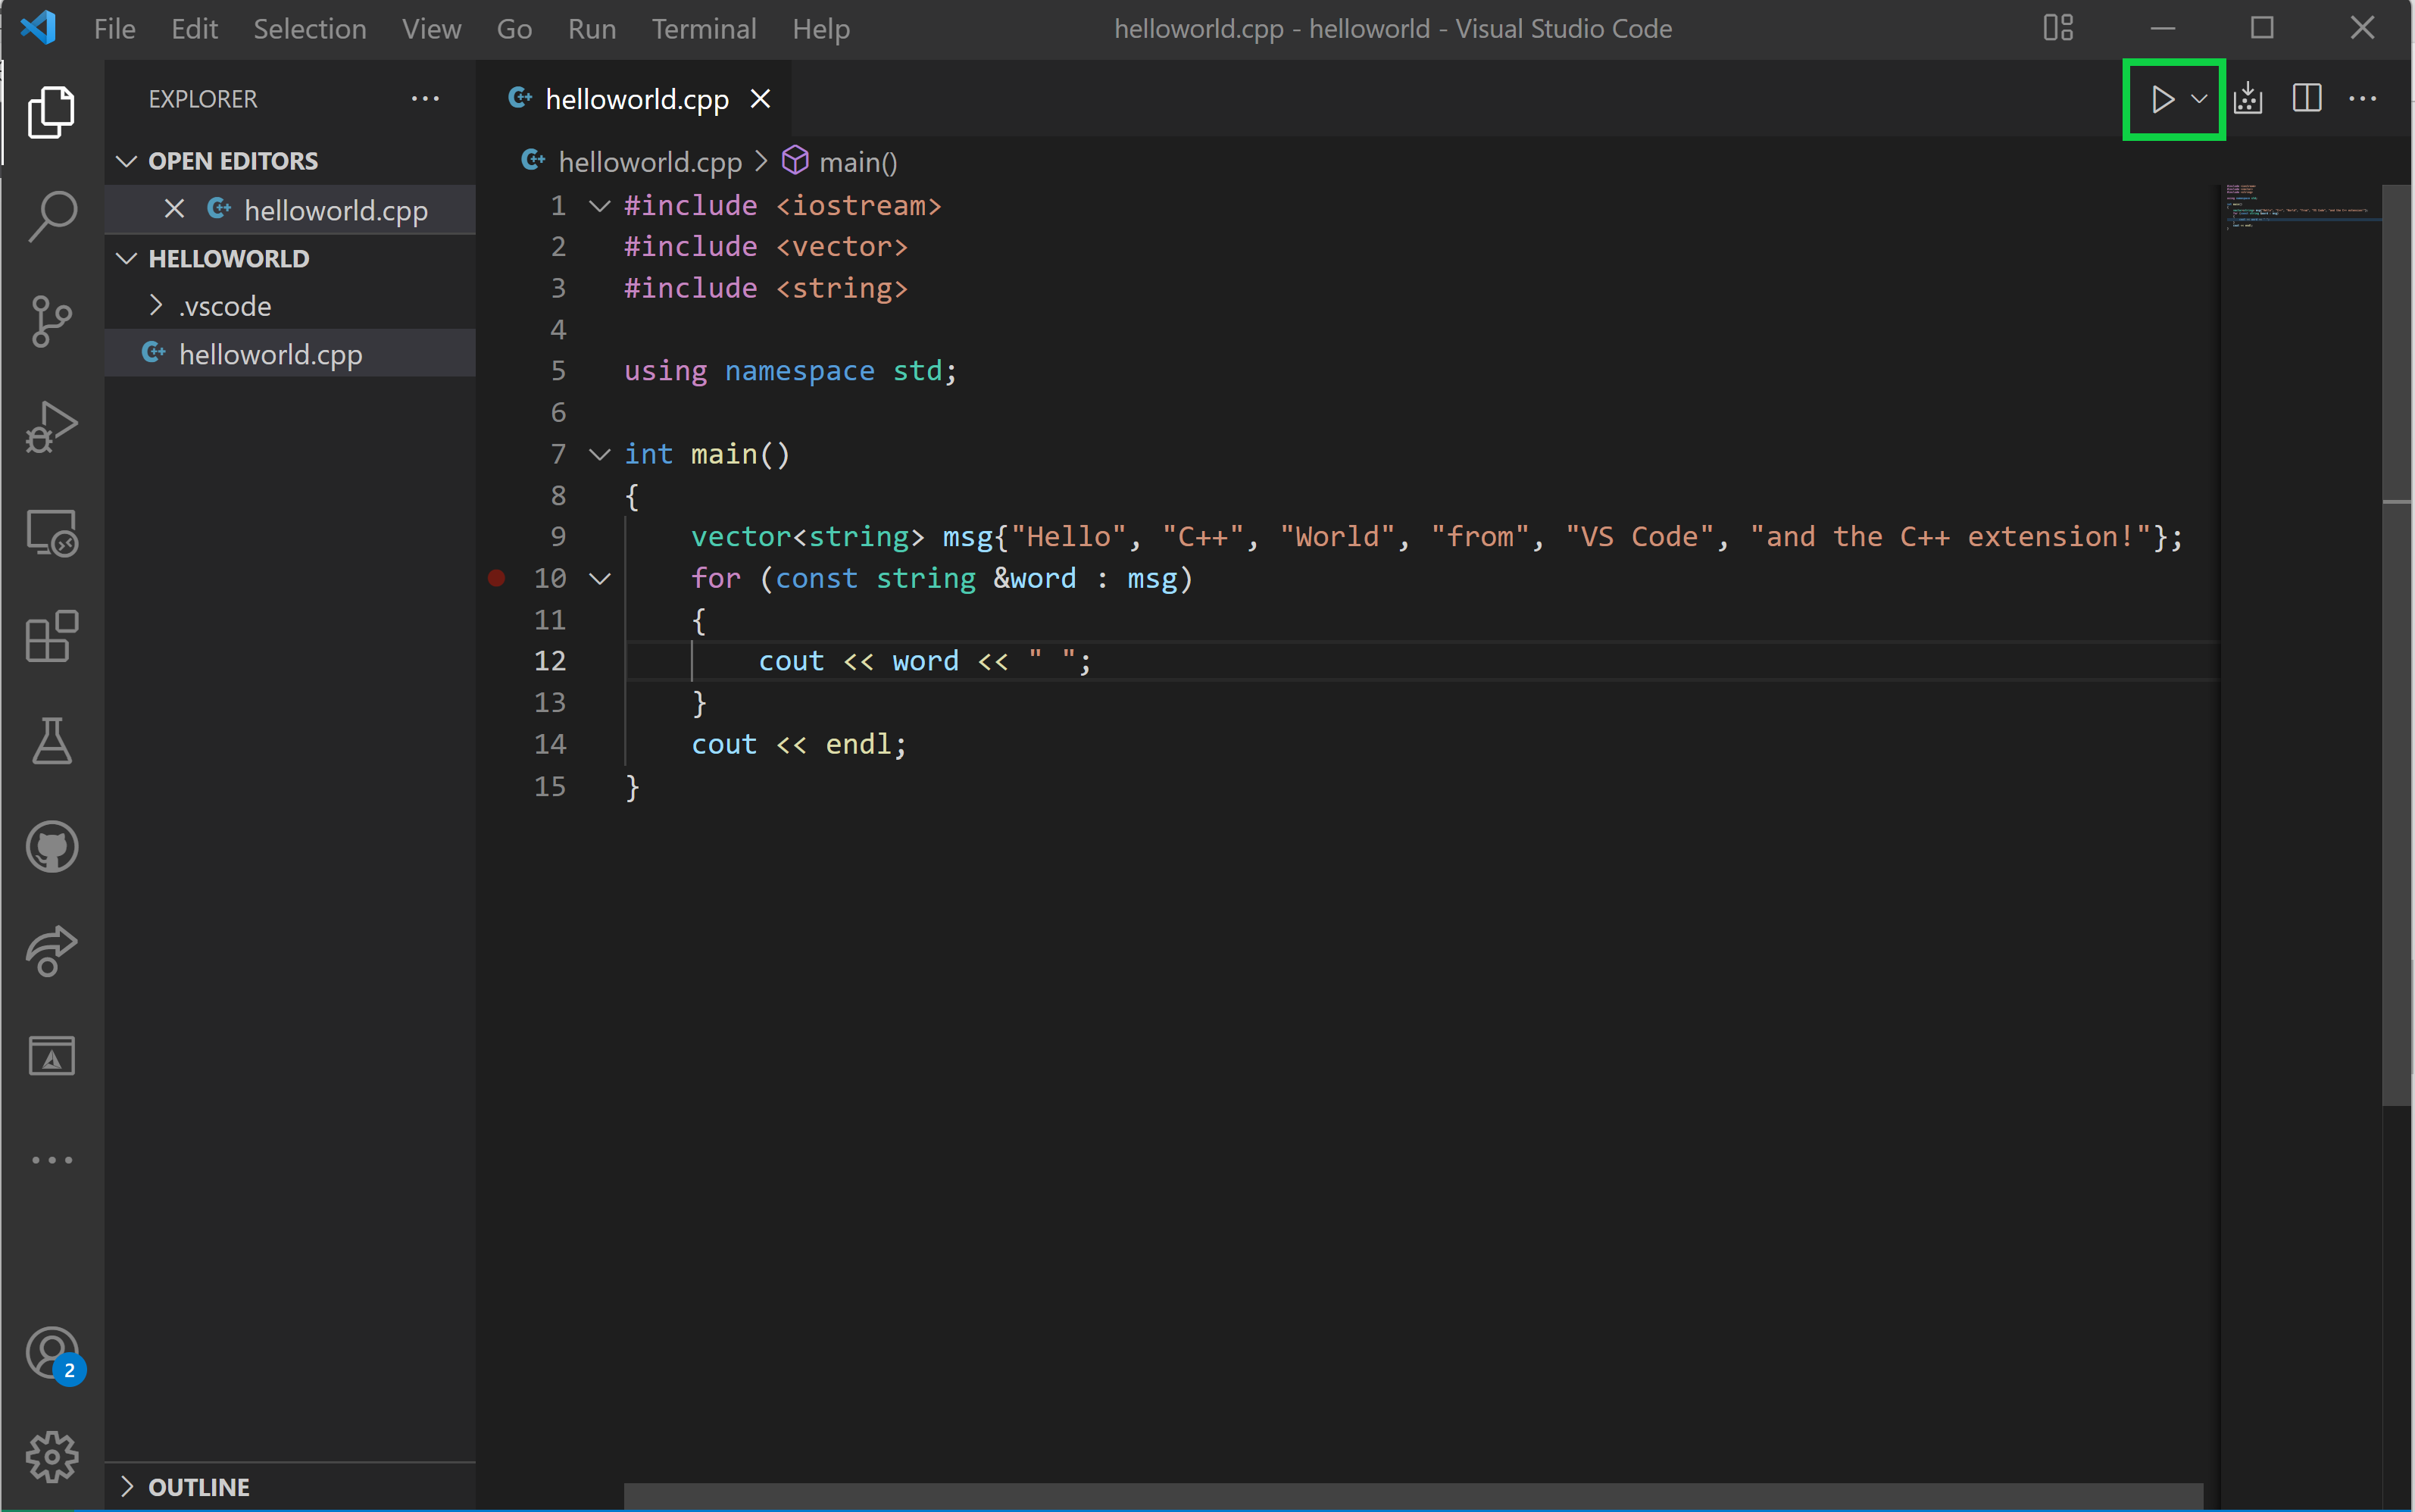
With the 1.9.7 update, you’ll see a play button in the top right corner of the editor whenever a C or C++ file is active. It’s the same play button used by the Python extension, Java extension, and Code Runner extension.
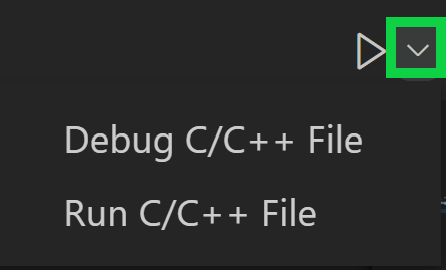
The play button has two modes: “Run C/C++ File” and “Debug C/C++ File.” The default mode is “Run C/C++ File,” and you can use the drop-down to switch modes.
If you already have a launch.json file in your workspace, the play button will read from it when figuring out how to run and debug your C++ file. If you don’t have launch.json, the play button will create a temporary “quick debug” configuration on the fly, eliminating the need for launch.json altogether!
We also simplified F5 (Run > Start Debugging) to use the same temporary “quick debug” configurations as the play button when your project doesn’t have launch.json. If you need to create launch.json to customize debugging, select Run > Add Configuration… from the main menu.
Note: We’re still rolling out the run/debug play button, so you might not see it by default, but you can opt in by enabling C_Cpp: Debug Shortcut in User settings.
What do you think?
Download the C++ extension for Visual Studio Code today, give it a try, and let us know what you think. If you run into any issues, or have any suggestions, please report them in the Issues section of our GitHub repository. We can be reached via the comments below or in email at visualcpp@microsoft.com. You can also find our team on Twitter at @VisualC.
 Light
Light Dark
Dark
3 comments
Dude! THANK YOU for that bit about the Run button. I teach teens about C++, and they really get tripped by all the JSON config files.
Hi wejns
Mn
Good job.
I use vscode for remote C++ debugging on linux and macos systems, but recently I am seriously thinking about switching from Visual Studio to VIsual Studio Code even on windows.