Improving code generation time with C++ Build Insights
Code generation time is a significant contributor to total build time for optimized builds. During this step of the compilation process, source code is passed through several algorithms that transform your program into an optimized version that can be executed more efficiently. In general, the optimization of a C++ function happens quickly and poses no problem. In exceptional cases, however, some functions can become large and complex enough to put pressure on the optimizer and noticeably slow down your builds. In this article, we show how you can use C++ Build Insights to determine if slow code generation is a problem for you. We demonstrate two ways to diagnose these issues: first manually with the vcperf analysis tool, and then programmatically with the C++ Build Insights SDK. Throughout the tutorial, we show these techniques being used to improve the build time of Chakra, the open-source JavaScript engine, by 7%.
How to obtain and use vcperf
The examples in this article make use of vcperf, a tool that allows you to capture a trace of your build and to view it in the Windows Performance Analyzer (WPA). The latest version is available in Visual Studio 2019.
1. Follow these steps to obtain and configure vcperf and WPA:
- Download and install the latest Visual Studio 2019.
- Obtain WPA by downloading and installing the latest Windows ADK.
- Copy the
perf_msvcbuildinsights.dllfile from your Visual Studio 2019’s MSVC installation directory to your newly installed WPA directory. This file is the C++ Build Insights WPA add-in, which must be available to WPA for correctly displaying the C++ Build Insights events.- MSVC’s installation directory is typically:
C:\Program Files (x86)\Microsoft Visual Studio\2019\{Edition}\VC\Tools\MSVC\{Version}\bin\Hostx64\x64. - WPA’s installation directory is typically:
C:\Program Files (x86)\Windows Kits\10\Windows Performance Toolkit.
- MSVC’s installation directory is typically:
- Open the
perfcore.inifile in your WPA installation directory, and add an entry for theperf_msvcbuildinsights.dllfile. This tells WPA to load the C++ Build Insights plugin on startup.
You can also obtain the latest vcperf and WPA add-in by cloning and building the vcperf GitHub repository. Feel free to use your built copy in conjunction with Visual Studio 2019!
2. Follow these steps to collect a trace of your build:
- Open an elevated x64 Native Tools Command Prompt for VS 2019.
- Obtain a trace of your build:
- Run the following command:
vcperf /start MySessionName. - Build your C++ project from anywhere, even from within Visual Studio (vcperf collects events system-wide).
- Run the following command:
vcperf /stop MySessionName outputFile.etl. This command will stop the trace, analyze all events, and save everything in the outputFile.etl trace file.
- Run the following command:
- Open the trace you just collected in WPA.
Using the Functions view in WPA
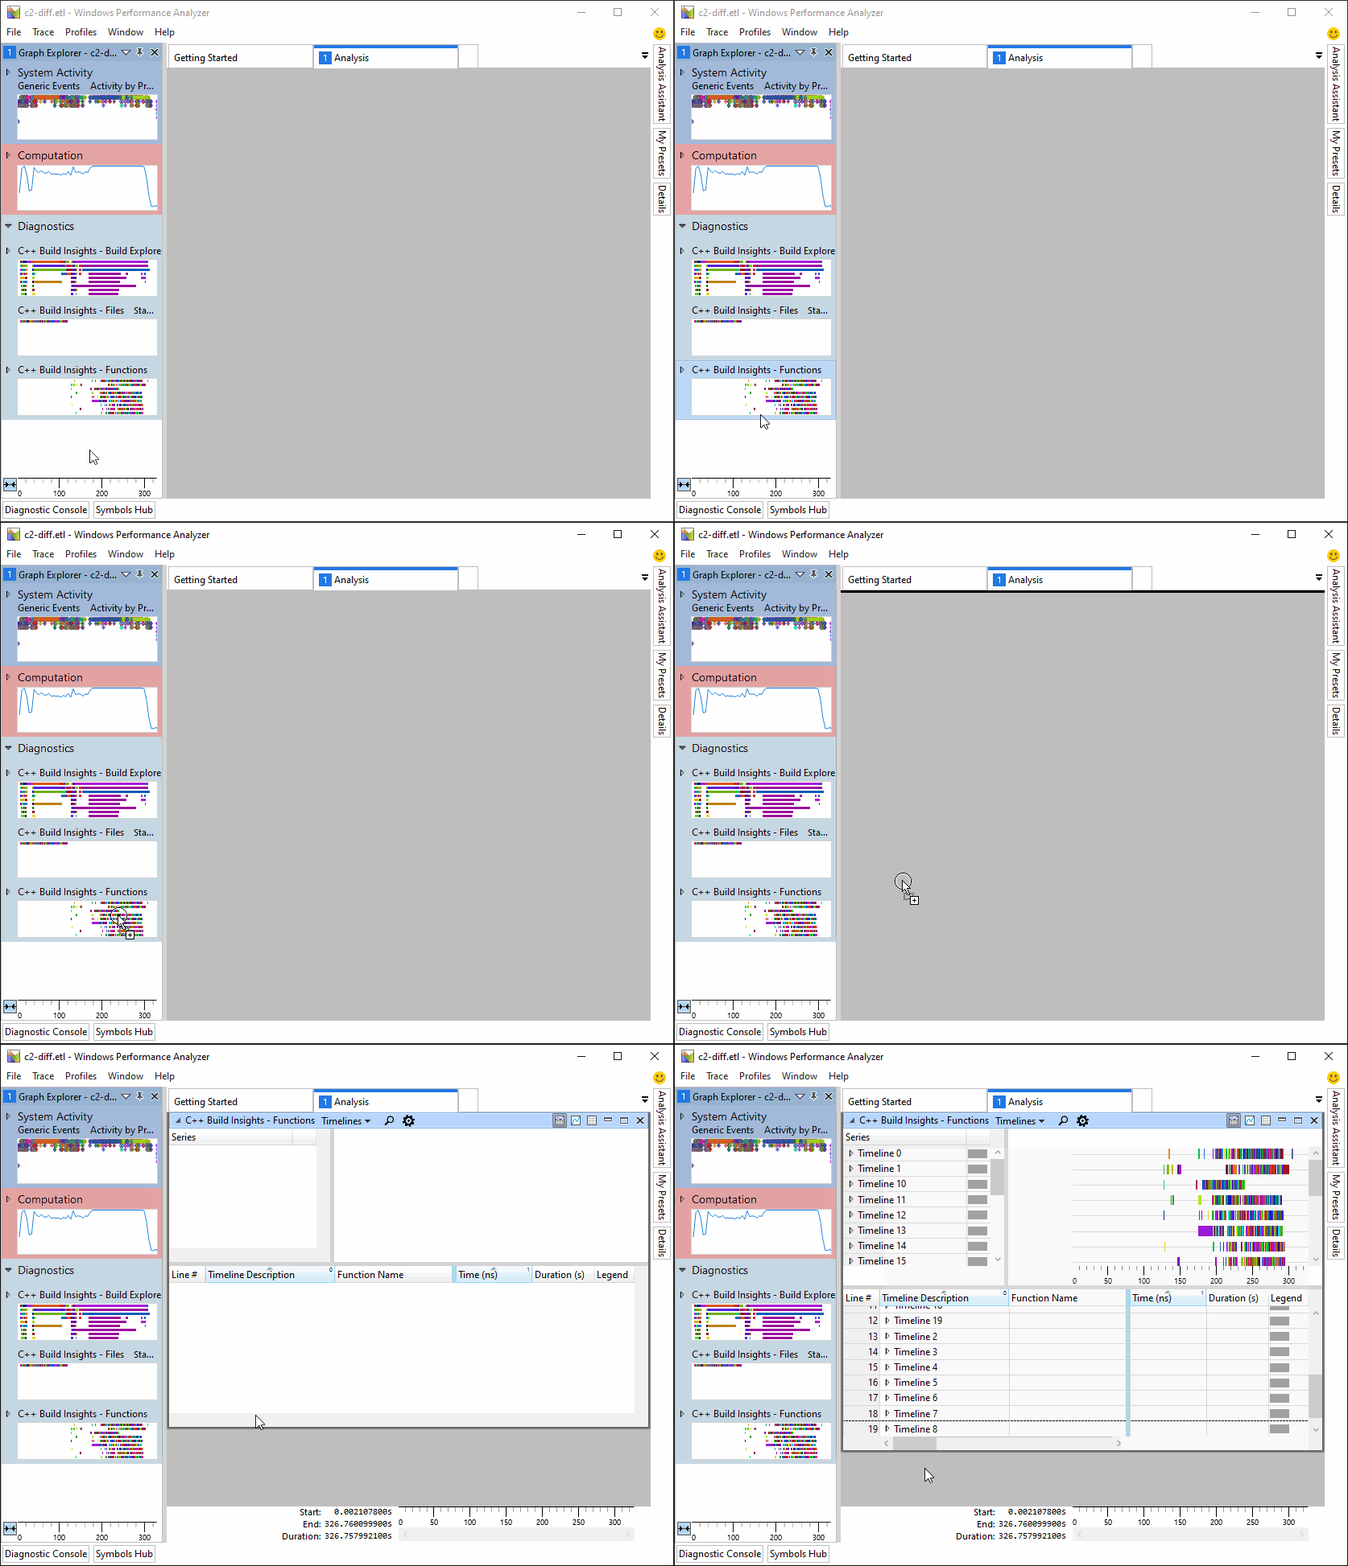
C++ Build Insights has a dedicated view to help diagnose slow code generation time: the Functions view. After opening your trace in WPA, you can access the view by dragging it from the Graph Explorer pane to the Analysis window, as shown below.
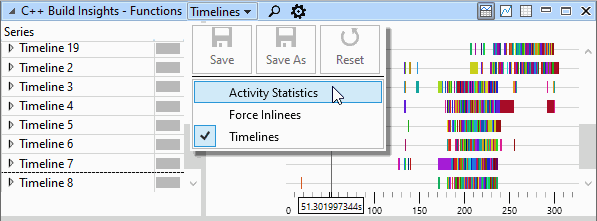
The Functions view offers 3 presets that you can select from when navigating your build trace:
- Timelines
- Activity Statistics
- Force Inlinees
Click on the drop-down menu at the top of the view to select the one you need. This step is illustrated below.
In the next 3 sections, we cover each of these presets in turn.
Preset #1: Timelines
When the Timelines preset is active, focus your attention on the graph section at the top of the view. It gives an overview of where function code generation bottlenecks occur in your parallel build. Each timeline represents a thread. The timeline numbers match the ones in the Build Explorer view. In this graph, a colored bar represents a function being optimized. The longer the bar, the more time was consumed optimizing this function. Hover over each colored bar to see the name of the function being optimized. The position of the bar on the x axis indicates the time at which the function optimization started. Place a Functions view underneath a Build Explorer view to understand how the code generation of a function affects the overall build, and if it’s a bottleneck. The Timelines preset is shown in the image below.
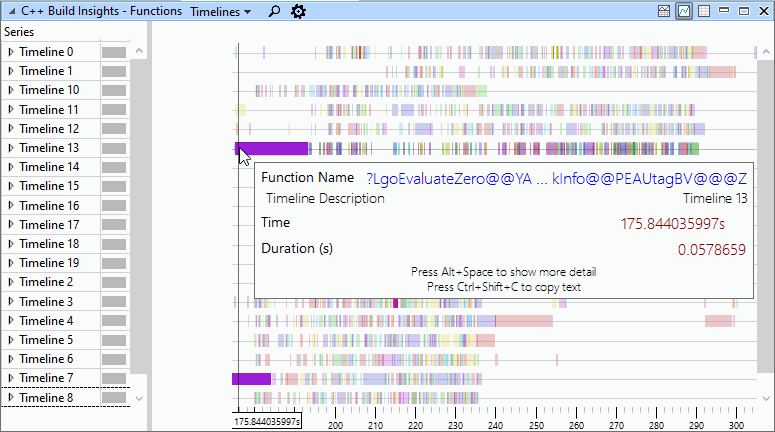
N.B. Accurate parallelism for code generation is only available starting with Visual Studio 2019 version 16.4. In earlier versions, all code generation threads for a given compiler or linker invocation are placed on one timeline. In version 16.4 and above, each code generation thread within a compiler or linker invocation is placed on its own timeline.
Preset #2: Activity Statistics
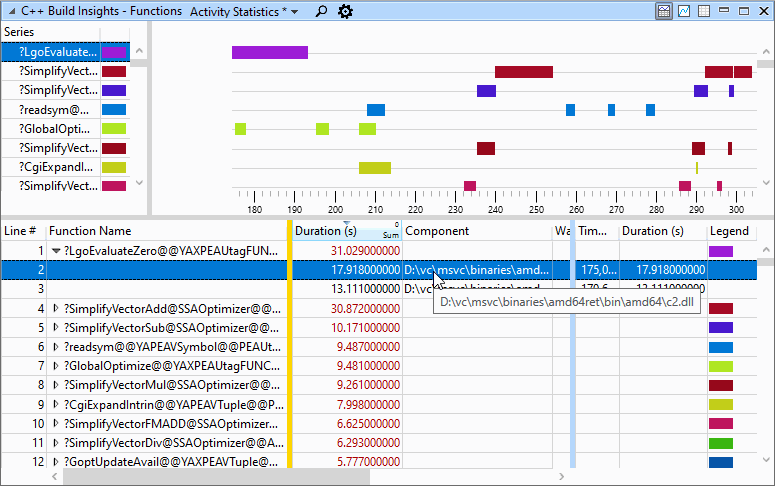
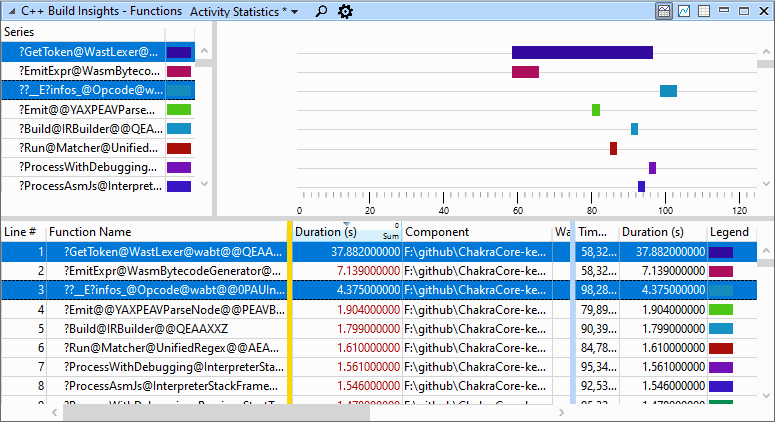
The Activity Statistics preset shows code generation statistics for the functions in your build. When using this preset, focus your attention on the table at the bottom of the view. By default, functions are sorted by their code generation duration in descending order. Use this preset if you want to quickly identify the functions that take the most time to optimize in your entire build. If you are interested in only a section of your build, click and drag the mouse over the desired time span in the graph section at the top of the view. The values in the table below the graph will automatically adjust to the selected time span. The table displays statistics such as: code generation time, file or DLL in which the function is found, and the compiler or linker invocation that was being executed during the generation of a function. Use the Build Explorer view to get more information on an invocation, if desired. Similar to the Timelines preset, the colored bars in the graph section at the top of the view indicate the time and duration when the code generation for a given function occurred, except that the information is grouped by function name instead of by thread. The Activity Statistics preset is shown below.
Preset #3: Force Inlinees
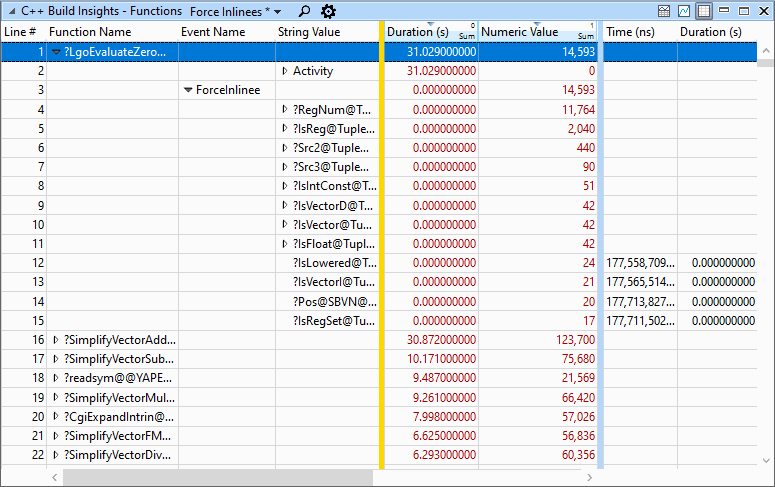
The inlining of large function call graphs into a single root function can result in very large functions that take a long time to optimize. An overabundant use of the __forceinline keyword is a common cause of this problem, so C++ Build Insights includes a dedicated preset to identify force-inlining issues quickly. When using the Force Inlinees preset, focus your attention on the table at the bottom of the view. Expand a function and its ForceInlinee node to see all the other functions that have been force-inlined in it. Functions that don’t have any force-inlinees are filtered out. The String Value field contains the name of the force-inlinee, and the Numeric Value field indicates how much this force-inlinee caused the root-level function to grow in size. The Numeric Value is roughly equivalent to the number of intermediate instructions in the function being inlined, so higher is worse. The force-inlinees are sorted by size (i.e. Numeric Value) in descending order, allowing you to quickly see the worst offenders. Use this information to try removing some __forceinline keywords on large functions. These functions don’t suffer as much from call overhead and are less likely to cause a performance degradation if inlining is omitted. Be careful when using the Numeric Value field, as the same function can be force-inlined multiple times and Numeric Value is a sum aggregation by default. Expand the String Value column for a force-inlinee to see the individual sizes of all inlinees of the same name. The Force Inlinees preset is shown below.
A note on the function names displayed in the Functions view
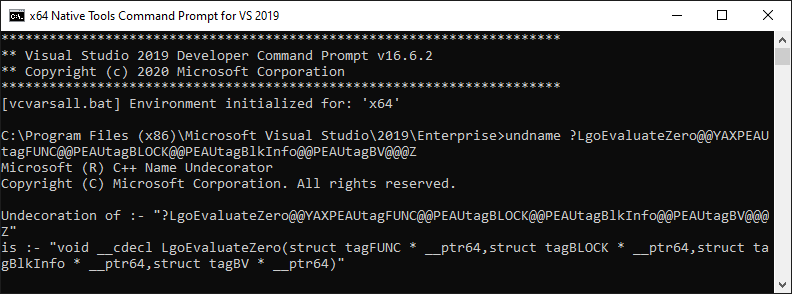
The Functions view shows mangled C++ function names. You can use the undname utility to demangle the names. To do so, right click on the cell containing the name in WPA, click on Copy Cell, and pass that value to undname, as shown below. The undname utility is available in an x64 Native Tools Command Prompt for VS 2019.
Putting it all together: using the Functions view to speed up Chakra builds
In this case study, we use the Chakra open-source JavaScript engine from GitHub to demonstrate how vcperf can be used to achieve a 7% build time improvement.
Use these steps if you would like to follow along:
- Clone the ChakraCore GitHub repository.
- Change the directory to the root of the freshly cloned repository and run the following command:
git checkout c72b4b7. This is the commit that was used for the case study below. - Open the
Build\Chakra.Core.slnsolution file, starting from the root of the repository. - Obtain a trace for a full rebuild of the solution:
- Open an elevated command prompt with vcperf on the PATH.
- Run the following command:
vcperf /start Chakra - Rebuild the x64 Test configuration of the
Build\Chakra.Core.slnsolution file in Visual Studio 2019. - Run the following command:
vcperf /stop Chakra chakra.etl. This will save a trace of the build in chakra.etl.
- Open the trace in WPA.
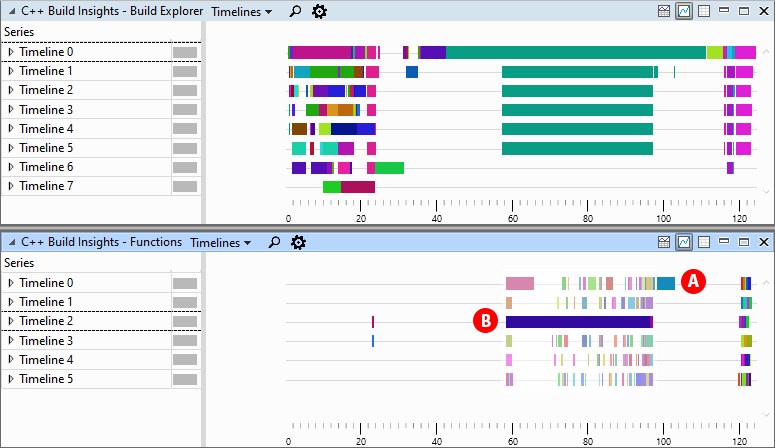
We bring in the Build Explorer and Functions views and place them one on top of the other. The Functions view shows two long code generation activities, labeled A and B below. These activities align with an invocation bottleneck shown in the Build Explorer view above. We surmise that reducing code generation time for A and B should help overall build time, given that they are on the critical path. Let’s investigate further.
We switch over to the Activity Statistics preset in the Functions view, and find out that the two functions corresponding to A and B are named infos_ and GetToken, respectively.
Fixing infos_: evaluating initializers at compile time
Looking at the code for Chakra, we find that infos_ is a large global array of Opcode::Info objects. It is defined in lib\wabt\src\opcode.cc, as shown below. The Opcode::Info elements are initialized with the 450+ entries found in lib\wabt\src\opcode.def.
// static
Opcode::Info Opcode::infos_[] = {
#define WABT_OPCODE(rtype, type1, type2, type3, mem_size, prefix, code, Name, \
                    text)                                                     \
  {text,        Type::rtype, Type::type1,                                     \
   Type::type2, Type::type3, mem_size,                                        \
   prefix,      code,        PrefixCode(prefix, code)},
#include "src/opcode.def"
#undef WABT_OPCODE

    {"<invalid>", Type::Void, Type::Void, Type::Void, Type::Void, 0, 0, 0, 0},
};
How is this array related to the infos_ function that we’re seeing in our Chakra trace? And why is this function slow to generate?
Global variables sometimes cannot be initialized at compile time because their initialization involves the execution of some code (e.g. a constructor). In this case, the compiler generates a function known as a dynamic initializer which will be called during program startup to properly initialize the variable. You can easily recognize dynamic initializers in the Functions view because their mangled name always starts with ??__E.
The Chakra trace that we captured earlier tells us that a dynamic initializer function was generated for infos_. The reason why this function takes a long time to generate is because the initialization code for the 450+-element infos_ array is very large and is causing the compiler’s optimization phase to take more time to complete.
In the case of infos_, all the information required to initialize its elements is known at compile time. It is possible to prevent the generation of a dynamic initializer by enforcing compile-time initialization as follows:
- (optionally) making the
infos_arrayconstexpr; and - making the
PrefixCodefunctionconstexpr.
The reason why step 1 is a good idea is that compilation will fail if infos_ ever changes by mistake in a way that prevents compile-time initialization. Without it, the compiler will silently revert back to generating a dynamic initializer function. Step 2 is required because PrefixCode is called during the initialization of each Opcode::Info element, and compile-time initialization of infos_ cannot happen if any part of its initialization is not constexpr.
See the code for this fix on GitHub.
Fixing GetToken: using the reduced optimizer for large functions
The C code for GetToken is generated (that’s right, the C code itself is generated) by re2c, the open-source software lexer generator. The resulting function is very large and suffers from long optimization time due to its size. Because the C code is generated, it might not be trivial to modify it in a way that would fix our build time issue. When situations like this arise, you can use the ReducedOptimizeHugeFunctions switch. This switch prevents the optimizer from using expensive optimizations on large functions, resulting in improved optimization time. You can set the threshold for when the reduced optimizer kicks in by using the ReducedOptimizeThreshold:# switch. # is the number of instructions that the function must have before triggering the reduced optimizer. The default value is 20,000.
- When building with link-time code generation (LTCG) pass these switches to the linker using
/d2:”-ReducedOptimizeHugeFunctions”and/d2:”-ReducedOptimizeThreshold:#”. - When building without LTCG, pass these switches to the compiler using
/d2ReducedOptimizeHugeFunctionsand/d2ReducedOptimizeThreshold:#.
For our Chakra example, we use Visual Studio 2019 to modify the ChakraCore project’s properties and add the /d2:”-ReducedOptimizeHugeFunctions” switch, as shown below. Because the configuration we are building makes use of LTCG, the switch is added to the linker.
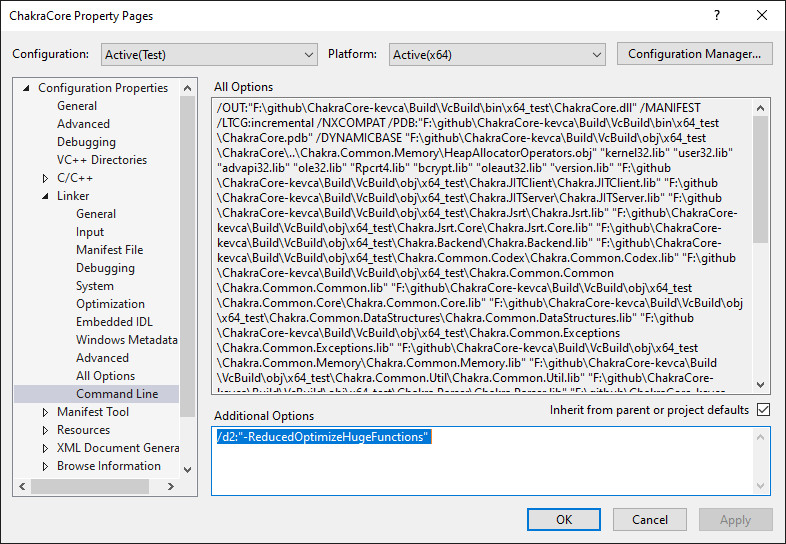
N.B. Using the ReducedOptimizeHugeFunctions switch may reduce the performance of generated code for large functions. If using this switch for performance-critical code, consider profiling your code before and after the change to make sure the difference is acceptable.
See the code for this fix on GitHub.
Alternative solutions: splitting code and removing __forceinline
It’s possible that you can’t use the methods described above for your project. This can be because:
- you have large global arrays that can’t be initialized at compile-time; or
- the performance degradation incurred with the use of the
ReducedOptimizeHugeFunctionsswitch is unacceptable.
Slow code generation time for a function is almost always due to the function being large. Any approach that reduces the size of the function will help. Consider the following alternative solutions:
- Manually split a very large function into 2 or more subfunctions that are called individually. This splitting technique can also be used for large global arrays.
- Use the Force Inlinees preset of the Functions view to see if an overuse of the
__forceinlinekeyword may be to blame. If so, try removing__forceinlinefrom the largest force-inlined functions.
N.B. Alternative solution 2 may cause a performance degradation if __forceinline is removed from small functions that are frequently force-inlined. Using this solution on large force-inlined functions is preferred.
Evaluating our Chakra solution
We capture another trace after fixing the dynamic initializer for infos__ and using the ReducedOptimizeHugeFunctions switch for GetToken. A comparison of the Build Explorer view before and after the change reveals that total build time went from 124 seconds to 115 seconds, a 7% reduction.
Build Explorer view before applying solution:

Build Explorer view after applying solution:

The Activity Statistics preset in our Functions view for the fixed trace shows that infos__ is no longer present and that GetToken’s code generation time has gone down to around 5 seconds.

Identifying slow code generation using the C++ Build Insights SDK
Sometimes, it may be useful to detect functions with long code generation time automatically, without having to inspect a trace in WPA. For example, you may want to flag problematic functions during continuous integration (CI) or locally as a post-build step. The C++ Build Insights SDK enables these scenarios. To illustrate this point, we’ve prepared the FunctionBottlenecks SDK sample. When passed a trace, it prints out a list of functions that have a duration that is at least 1 second and longer than 5% of the duration of their containing cl.exe of link.exe invocation. The list of functions is sorted by duration in descending order. Since generous use of __forceinline is a common cause of functions that are slow to optimize, an asterisk is placed next to each entry where force inlining may be a problem.
Let’s repeat the Chakra case study from the previous section, but this time by using the FunctionBottlenecks sample to see what it finds. Use these steps if you want to follow along:
- Clone the C++ Build Insights SDK samples GitHub repository on your machine.
- Build the `Samples.sln` solution, targeting the desired architecture (x86 or x64), and using the desired configuration (debug or release). The sample’s executable will be placed in the
out/{architecture}/{configuration}/FunctionBottlenecksfolder, starting from the root of the repository. - Follow the steps from the Putting it all together: using the Functions view to speed up Chakra builds section to collect a trace of the Chakra solution. Use the
/stopnoanalyzecommand instead of the/stopcommand when stopping your trace. The/stopnoanalyzecommand is used for obtaining a trace that is compatible with the SDK. - Pass the collected trace as the first argument to the FunctionBottlenecks executable.
As shown below, when passed the trace for the unmodified project, FunctionBottlenecks correctly identifies the GetToken function and the dynamic analyzer for the infos_ array.

After applying the solutions described above in this article, the FunctionBottlenecks sample confirms that the situation is improved: GetToken has gone down from 38 to 5 seconds, and infos_ is no longer an issue.

Going over the sample code
The FunctionBottlenecks analyzer processes a trace in 2 passes. The first pass is accomplished by two member functions. The first is OnStopInvocation and is used to cache the duration of all invocations.
void OnStopInvocation(Invocation invocation)
{
    using namespace std::chrono;

    // Ignore very short invocations
    if (invocation.Duration() < std::chrono::seconds(1)) {
        return;
    }

    cachedInvocationDurations_[invocation.EventInstanceId()] =
        duration_cast<milliseconds>(invocation.Duration());
}
The second is ProcessForceInlinee and is used to cache the aggregated size of all functions that were force-inlined into a given top-level function.
void ProcessForceInlinee(Function func, ForceInlinee inlinee)
{
    forceInlineSizeCache_[func.EventInstanceId()] +=
        inlinee.Size();
}
The second pass is where we decide whether a function is a bottleneck based on the information gathered in pass 1. This is done in OnStopFunction.
void OnStopFunction(Invocation invocation, Function func)
{
    using namespace std::chrono;

    auto itInvocation = cachedInvocationDurations_.find(
        invocation.EventInstanceId());

    if (itInvocation == cachedInvocationDurations_.end()) {
        return;
    }

    auto itForceInlineSize = forceInlineSizeCache_.find(
        func.EventInstanceId());

    unsigned forceInlineSize =
        itForceInlineSize == forceInlineSizeCache_.end() ?
            0 : itForceInlineSize->second;

    milliseconds functionMilliseconds =
        duration_cast<milliseconds>(func.Duration());

    double functionTime = static_cast<double>(
        functionMilliseconds.count());

    double invocationTime = static_cast<double>(
        itInvocation->second.count());

    double percent = functionTime / invocationTime;

    if (percent > 0.05 && func.Duration() >= seconds(1))
    {
        identifiedFunctions_[func.EventInstanceId()]=
            { func.Name(), functionMilliseconds, percent,
              forceInlineSize };
    }
}
As shown above, the bottleneck functions are added to the identifiedFunctions_ container. This container is a std::unordered_map that holds values of type IdentifiedFunction.
struct IdentifiedFunction
{
    std::string Name;
    std::chrono::milliseconds Duration;
    double Percent;
    unsigned ForceInlineeSize;

    bool operator<(const IdentifiedFunction& other) const {
        return Duration > other.Duration;
    }
};
We use the OnEndAnalysis callback from the IAnalyzer interface to sort the identified functions by duration in descending order and print the list to standard output.
AnalysisControl OnEndAnalysis() override
{
    std::vector<IdentifiedFunction> sortedFunctions;

    for (auto& p : identifiedFunctions_) {
        sortedFunctions.push_back(p.second);
    }

    std::sort(sortedFunctions.begin(), sortedFunctions.end());

    for (auto& func : sortedFunctions)
    {
        bool forceInlineHeavy = func.ForceInlineeSize >= 10000;

        std::string forceInlineIndicator = forceInlineHeavy ?
            ", *" : "";

        int percent = static_cast<int>(func.Percent * 100);

        std::string percentString = "(" +
            std::to_string(percent) + "%" +
            forceInlineIndicator + ")";

        std::cout << std::setw(9) << std::right <<
            func.Duration.count();
        std::cout << " ms ";
        std::cout << std::setw(9) << std::left <<
            percentString;
        std::cout << " " << func.Name << std::endl;
    }

    return AnalysisControl::CONTINUE;
}
Tell us what you think!
We hope the information in this article has helped you understand how you can use the Functions view with vcperf and WPA to diagnose slow code generation in your builds. We also hope that the provided SDK sample will serve as a good foundation on which to build your own analyzers.
Give vcperf a try today by downloading the latest version of Visual Studio 2019, or by cloning the tool directly from the vcperf GitHub repository. Try out the FunctionBottlenecks sample from this article by cloning the C++ Build Insights samples repository from GitHub, or refer to the official C++ Build Insights SDK documentation to build your own analysis tools.
Have you found code generation issues in your builds using vcperf or the C++ Build Insights SDK? Let us know in the comments below, on Twitter (@VisualC), or via email at visualcpp@microsoft.com.
This article contains code snippets from WABT: The WebAssembly Binary Toolkit, Copyright (c) 2015-2020 WebAssembly Community Group participants, distributed under the Apache License, Version 2.0.

 Light
Light Dark
Dark
0 comments