Finding build bottlenecks with C++ Build Insights
C++ Build Insights offers more than one way to investigate your C++ build times. In this article, we discuss two methods that you can use to identify bottlenecks in your builds: manually by using the vcperf analysis tool, or programmatically with the C++ Build Insights SDK. We present a case study that shows how to use these tools to speed up the Git for Windows open source project. We hope these tutorials will come in handy when analyzing your own builds.
How to obtain and use vcperf
The examples in this article make use of vcperf, a tool that allows you to capture a trace of your build and to view it in the Windows Performance Analyzer (WPA). The latest version is available in Visual Studio 2019.
1. Follow these steps to obtain and configure vcperf and WPA:
- Download and install the latest Visual Studio 2019.
- Obtain WPA by downloading and installing the latest Windows ADK.
- Copy the perf_msvcbuildinsights.dll file from your Visual Studio 2019’s MSVC installation directory to your newly installed WPA directory. This file is the C++ Build Insights WPA add-in, which must be available to WPA for correctly displaying the C++ Build Insights events.
- MSVC’s installation directory is typically:
C:\Program Files (x86)\Microsoft Visual Studio\2019\{Edition}\VC\Tools\MSVC\{Version}\bin\Hostx64\x64. - WPA’s installation directory is typically:
C:\Program Files (x86)\Windows Kits\10\Windows Performance Toolkit.
- MSVC’s installation directory is typically:
- Open the perfcore.ini file in your WPA installation directory and add an entry for the perf_msvcbuildinsights.dll file. This tells WPA to load the C++ Build Insights add-in on startup.
You can also obtain the latest vcperf and WPA add-in by cloning and building the vcperf GitHub repository. Feel free to use your built copy in conjunction with Visual Studio 2019!
2. Follow these steps to collect a trace of your build:
- Open an elevated x64 Native Tools Command Prompt for VS 2019.
- Obtain a trace of your build:
- Run the following command:
vcperf /start MySessionName. - Build your C++ project from anywhere, even from within Visual Studio (vcperf collects events system-wide).
- Run the following command:
vcperf /stop MySessionName outputFile.etl. This command will stop the trace, analyze all events, and save everything in the outputFile.etl trace file.
- Run the following command:
- Open the trace you just collected in WPA.
Using the Build Explorer view in WPA
The first thing you’ll want to do when first opening your trace in WPA is to open the Build Explorer view. You can do so by dragging it from the Graph Explorer pane to the Analysis window, as shown below.
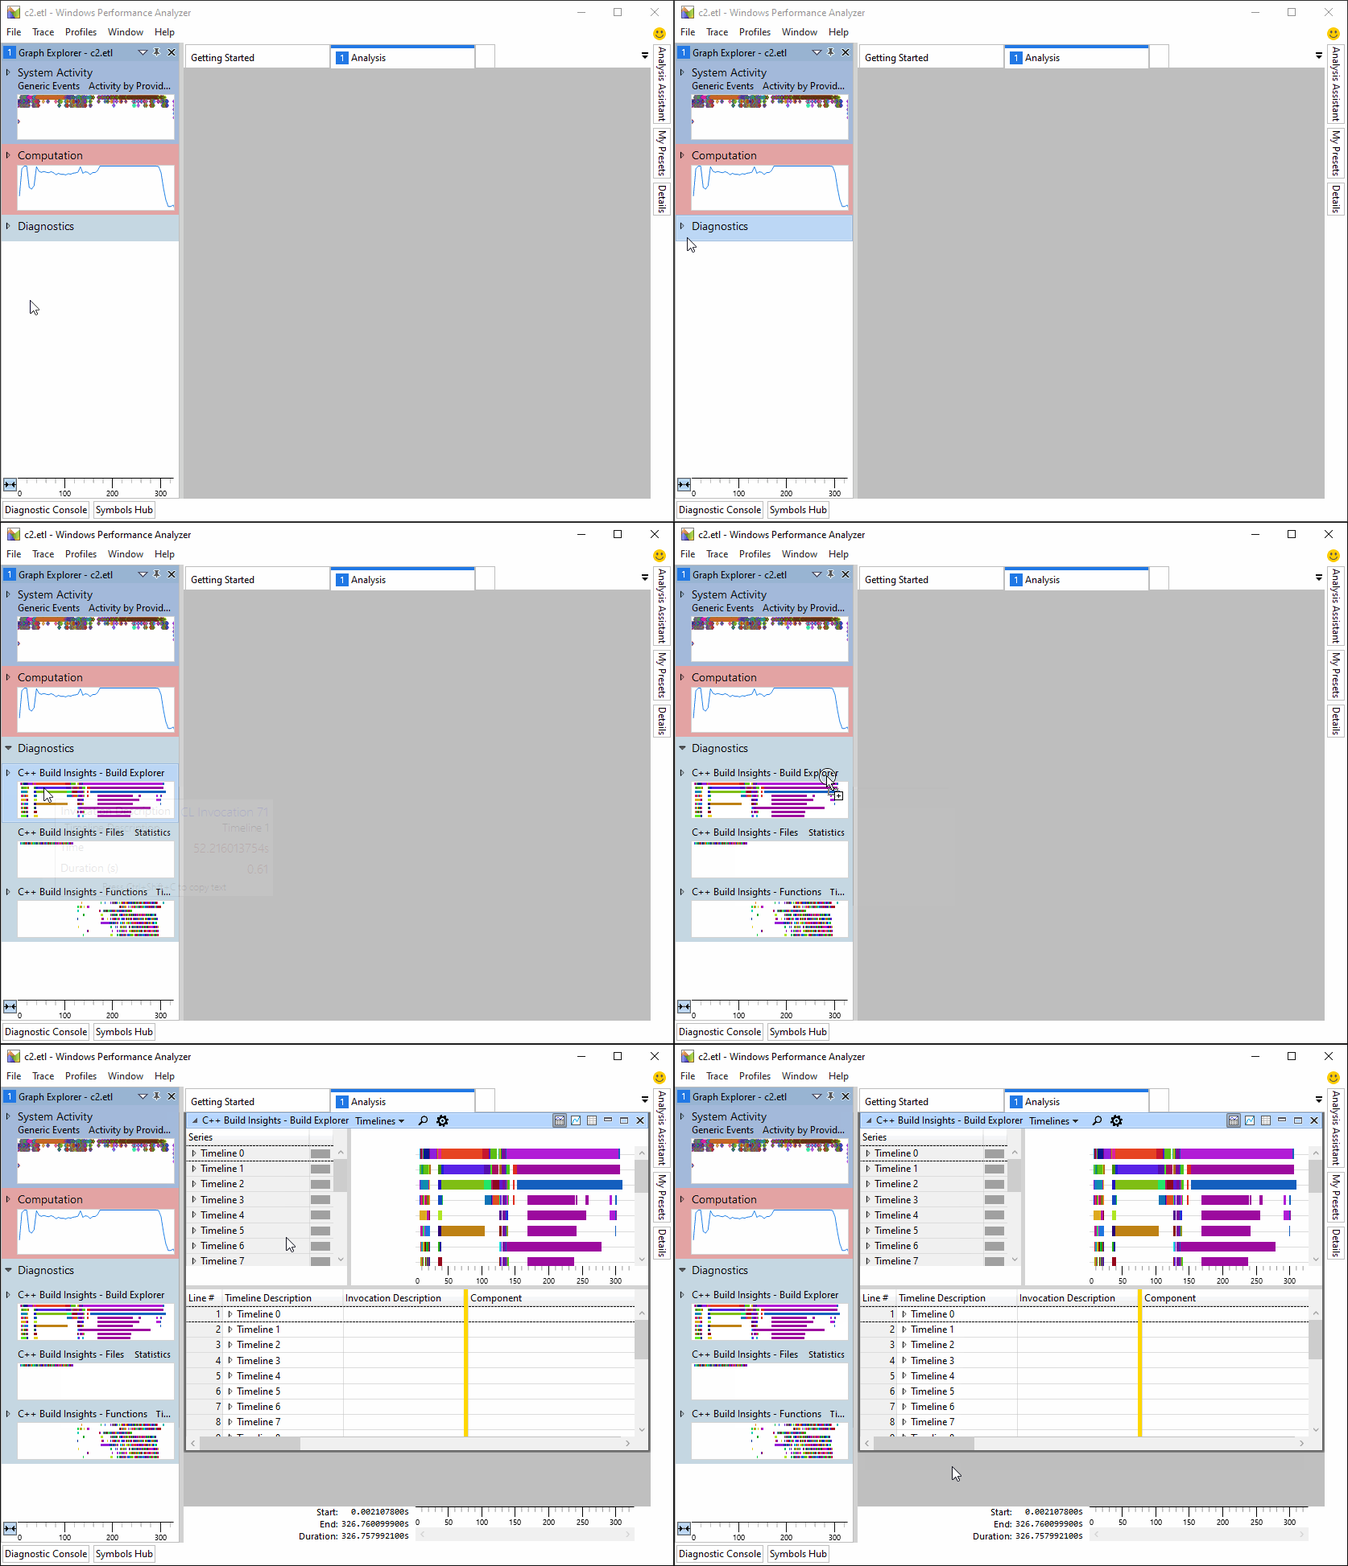
The Build Explorer view offers 4 presets that you can select from when navigating your build trace:
- Timelines
- Invocations
- Invocation Properties
- Activity Statistics
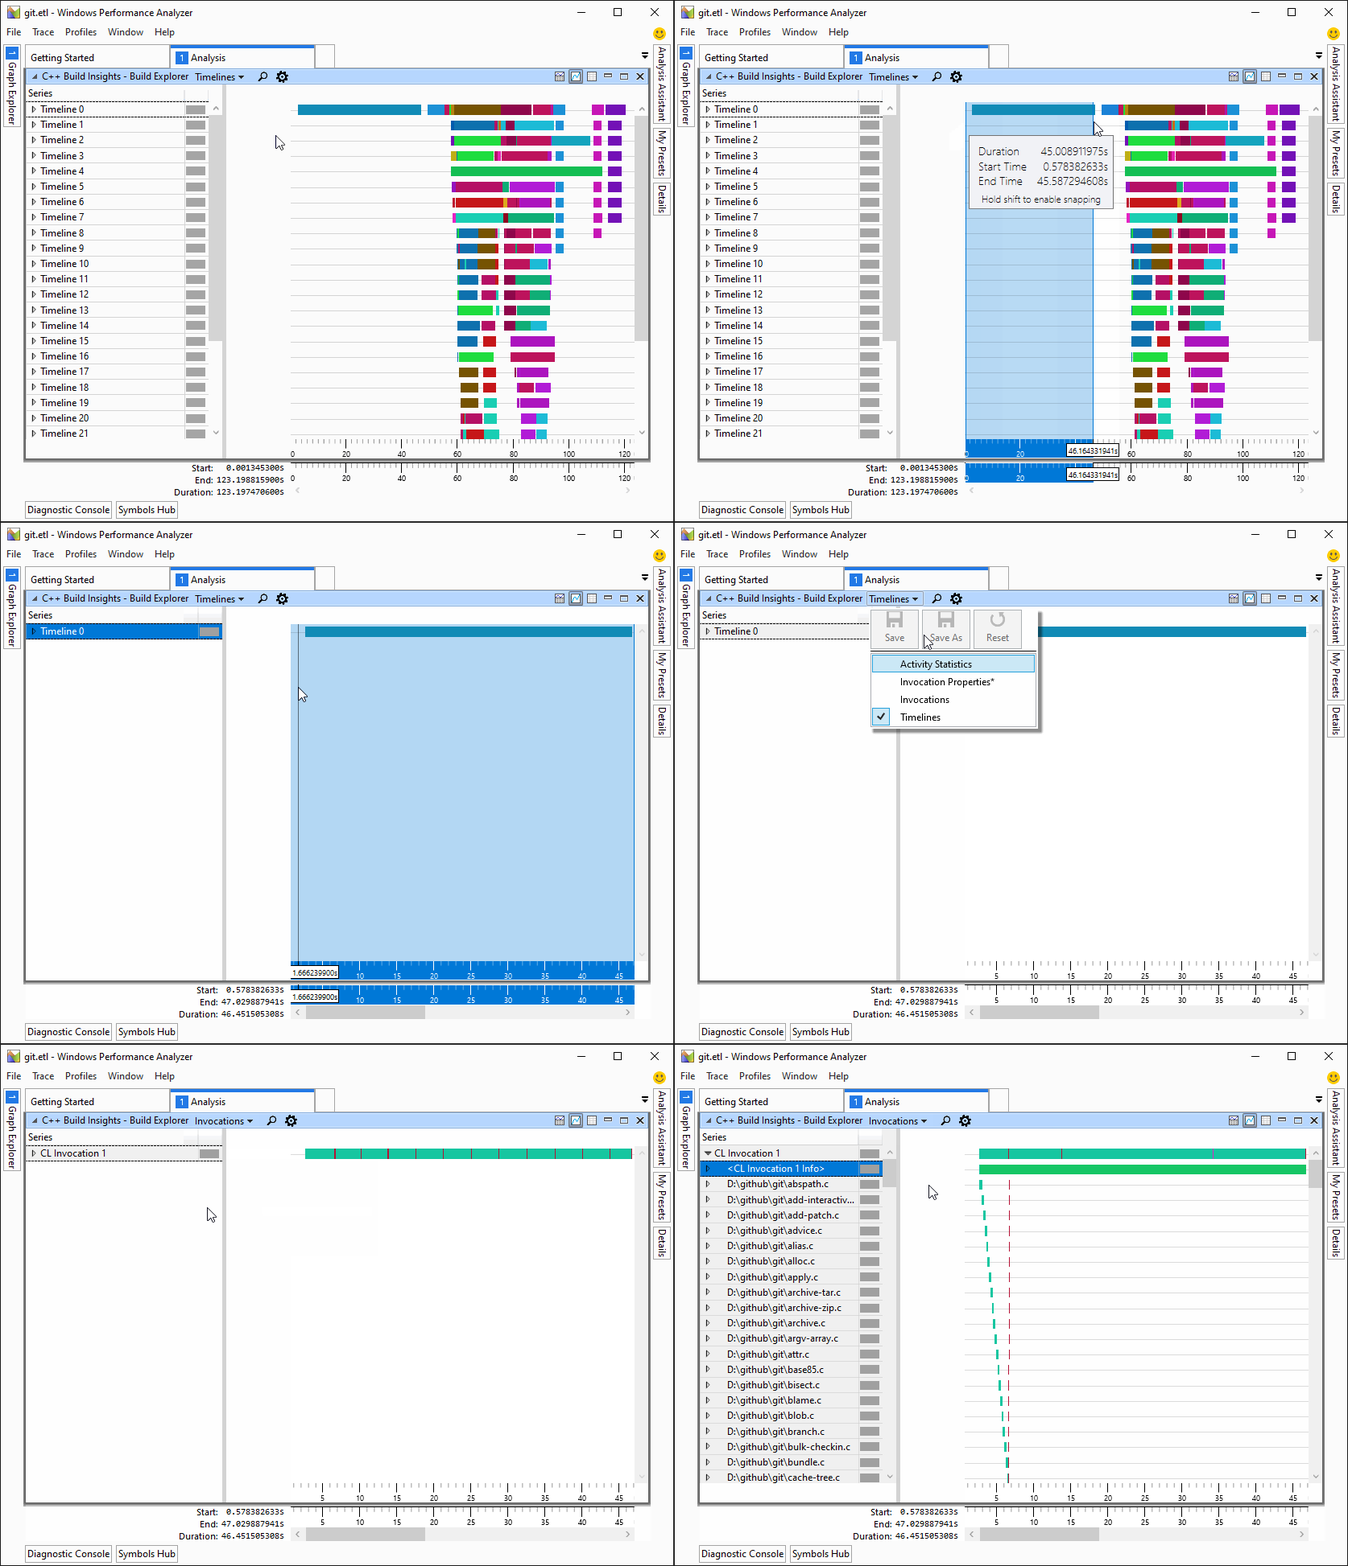
Click on the drop-down menu at the top of the view to select the one you need. This step is illustrated below.
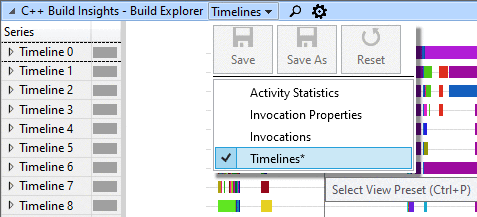
In the next 4 sections, we cover each of these presets in turn.
Preset #1: Timelines
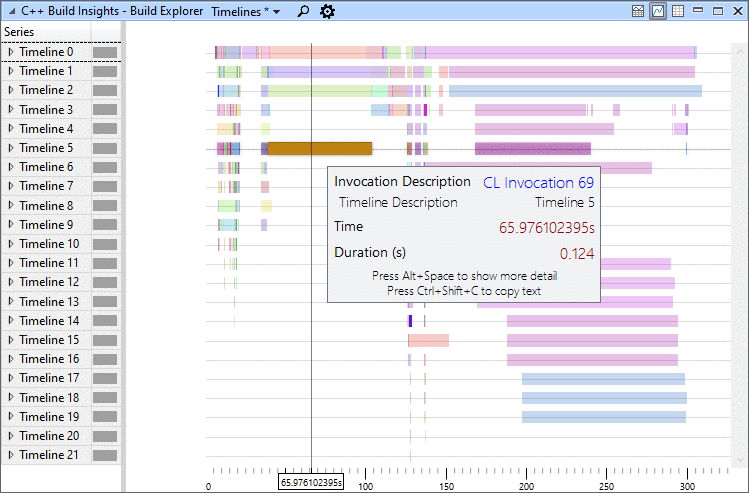
The Timelines preset shows how parallel invocations are laid out in time over the course of your build. Each timeline represents a virtual thread on which work happens. An invocation that does work on multiple threads will occupy multiple timelines.
N.B. Accurate parallelism for code generation is only available starting with Visual Studio 2019 version 16.4. In earlier versions, all code generation for a given compiler or linker invocation is placed on one timeline.
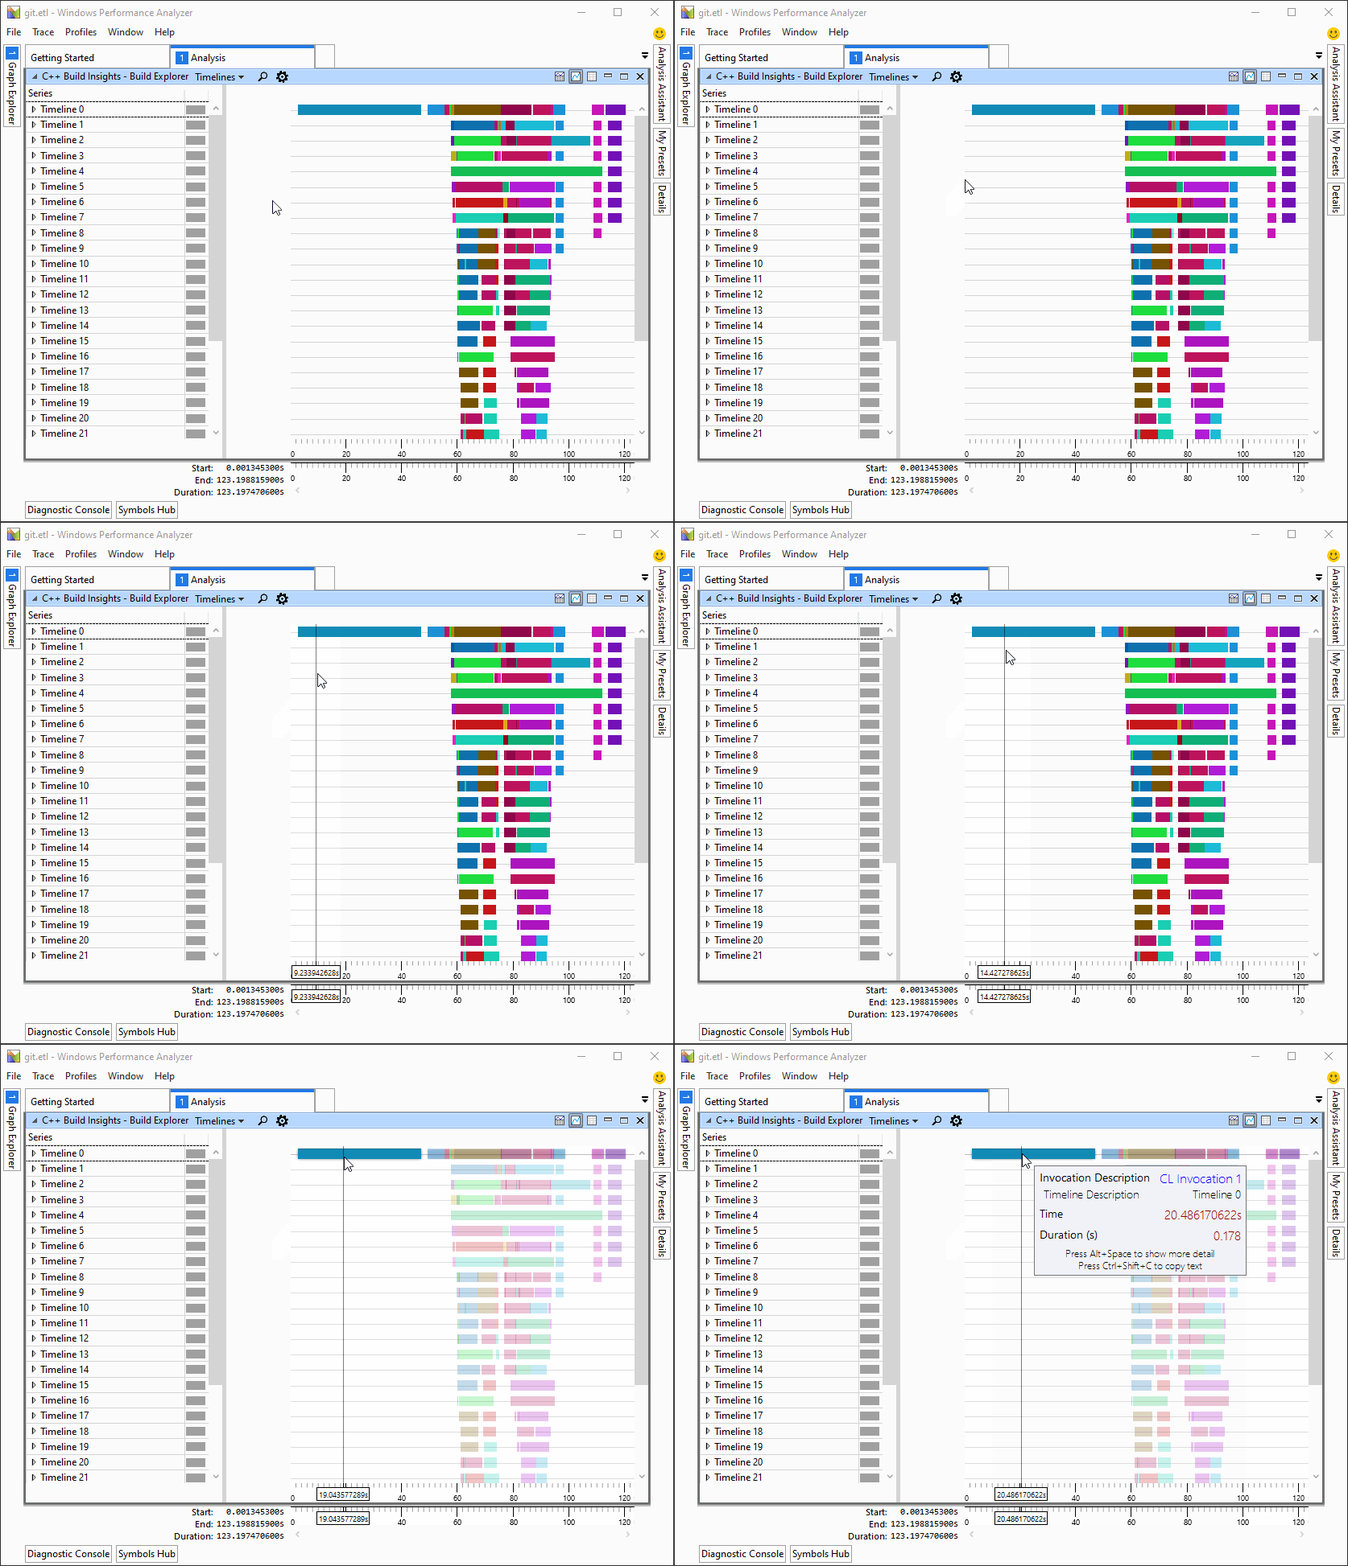
When viewing the Timelines preset, hover over a colored bar to see which invocation it corresponds to. The following image shows what happens when hovering over a bar on the 5th timeline.
Preset #2: Invocations
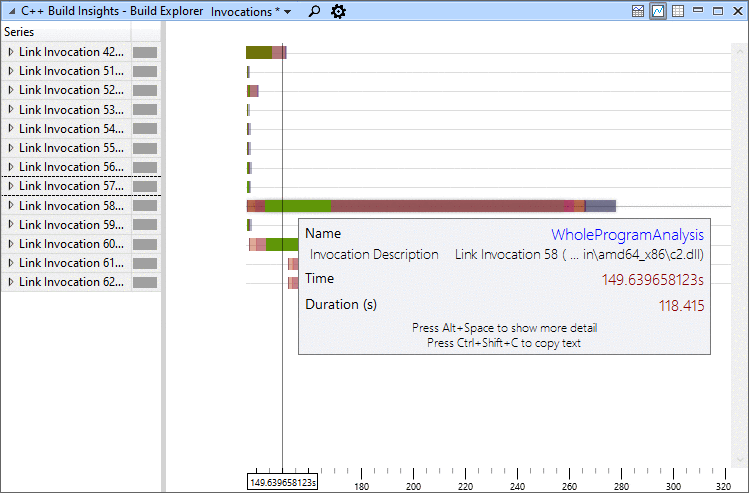
The Invocations preset shows each invocation on its own timeline, regardless of parallelism. It gives a more detailed look into what’s happening within the invocations. With this preset, hovering over a colored bar displays the activity being worked on by an invocation at any point in time. In the example below, we can see that the green bar in Linker 58 corresponds to the whole program analysis activity, a phase of link time code generation. We can also see that the output for Linker 58 was c2.dll.
Preset #3: Invocation Properties
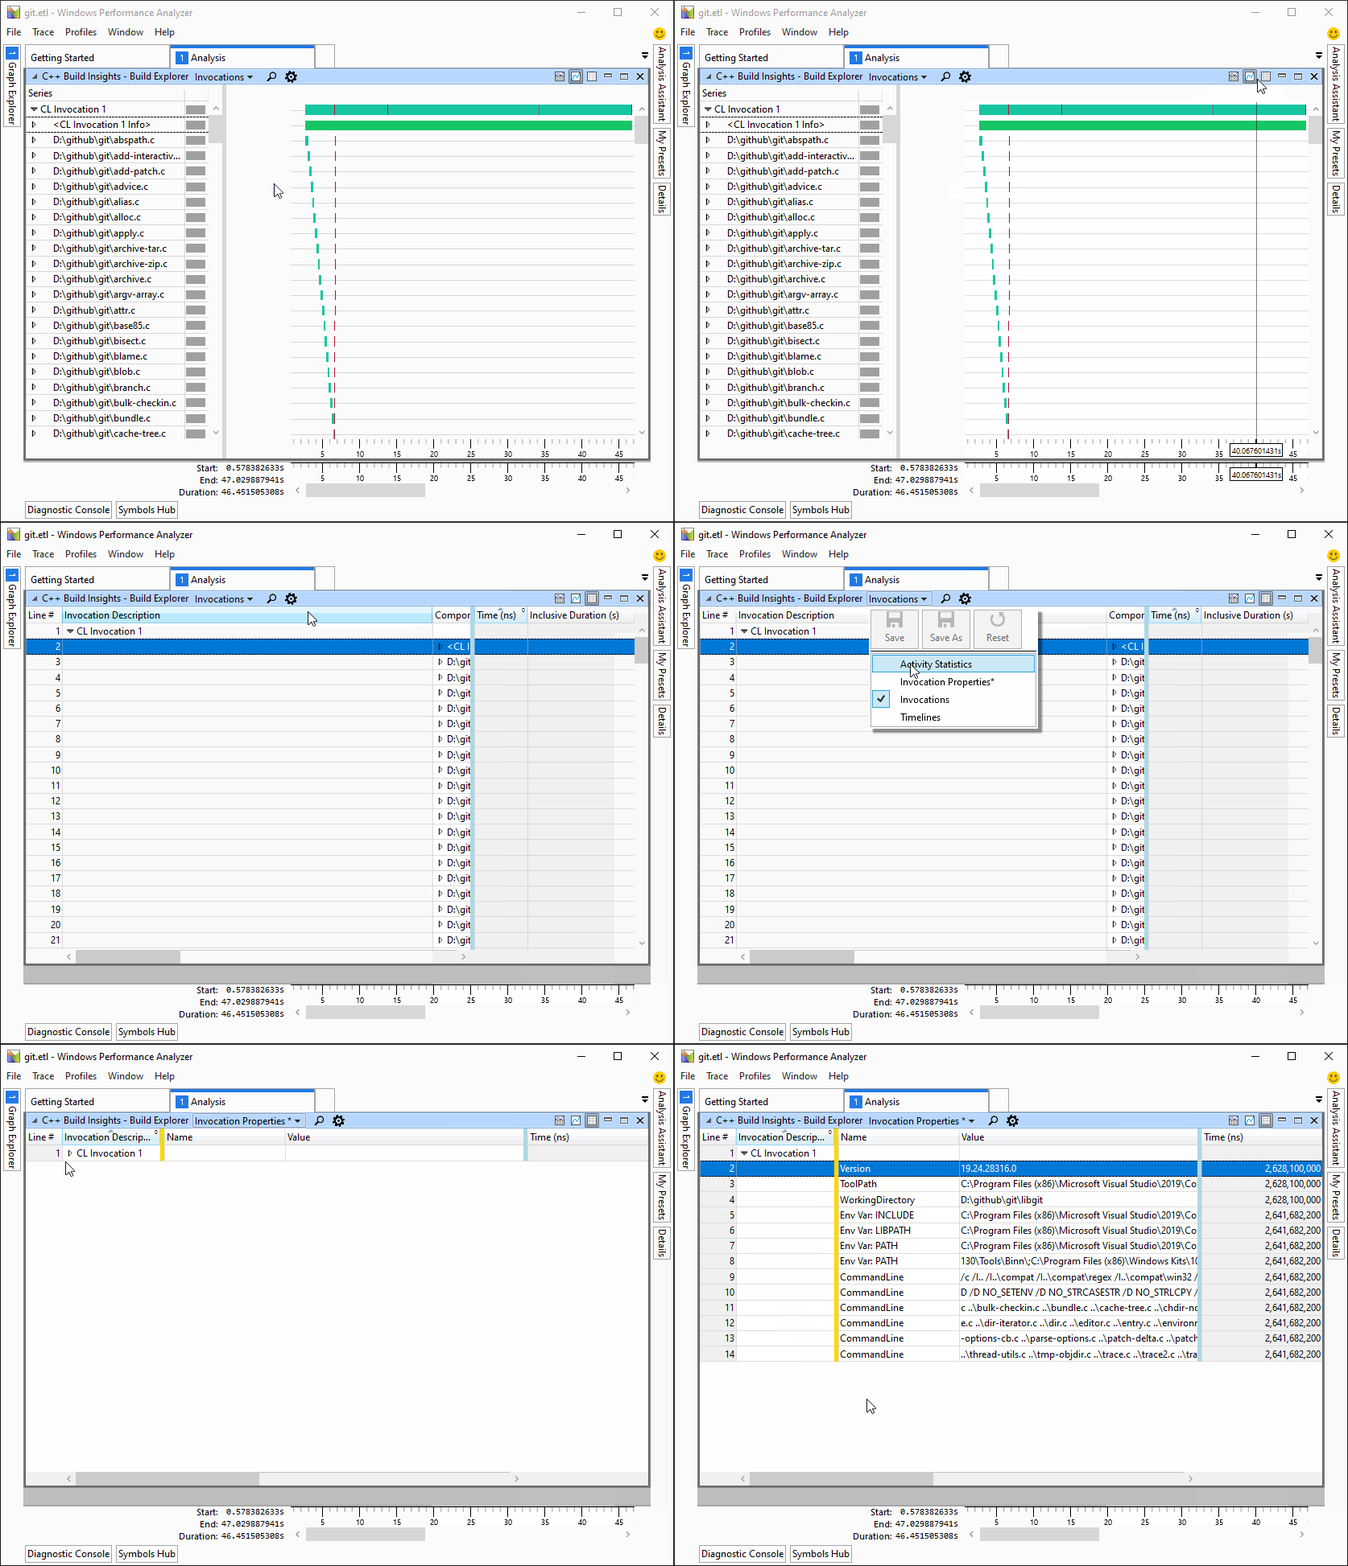
The Invocation Properties preset shows various properties for each invocation in the table at the bottom of the view. Find the invocation you are interested in to see miscellaneous facts about it such as:
- The version of CL or Link that was invoked.
- The working directory.
- Key environment variables such as PATH, or _CL_.
- The full command line, including arguments coming from response (.RSP) files or environment variables.
N.B. Command line or environment variables are sometimes shown in multiple entries if they are too long.

Preset #4: Activity Statistics
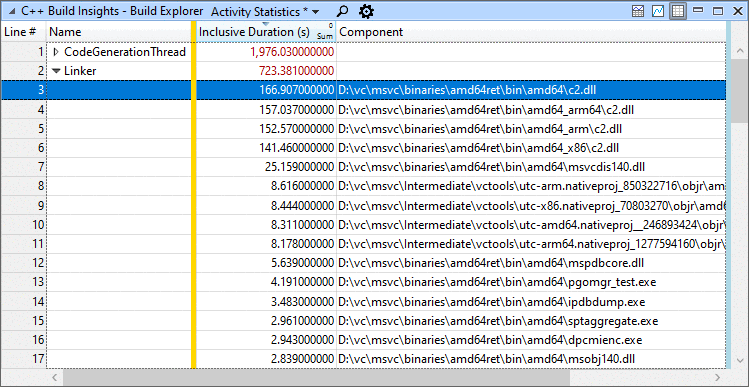
The Activity Statistics preset shows aggregated statistics for all build activities tracked by the Build Explorer view. Use it to learn, for example, the total duration of all linker and compiler invocations, or if your build times are dominated by parsing or code generation. Under this preset, the graph section of the view shows when each activity was active, while the table section shows the aggregated duration totals. Drill down on an activity to see all instances of this activity. The graph, table, and drill-down visuals are show in the sequence of images below. View the official C++ Build Insights event table for a description of each activity.


Putting it all together: a bottleneck case study
In this case study, we use a real open source project from GitHub and show you how we found and fixed a bottleneck.
Use these steps if you would like to follow along:
- Clone the Git for Windows GitHub repository.
- Switch to the vs/master branch.
- Open the git\git.sln solution file, starting from the root of the repository.
- Build the x64 Release configuration. This will pull all the package dependencies and do a full build.
- Obtain a trace for a full rebuild of the solution:
- Open an elevated command prompt with vcperf on the PATH.
- Run the following command:
vcperf /start Git - Rebuild the x64 Release configuration of the git\git.sln solution file in Visual Studio.
- Run the following command:
vcperf /stop Git git.etl. This will save a trace of the build in git.etl.
- Open the trace in WPA.
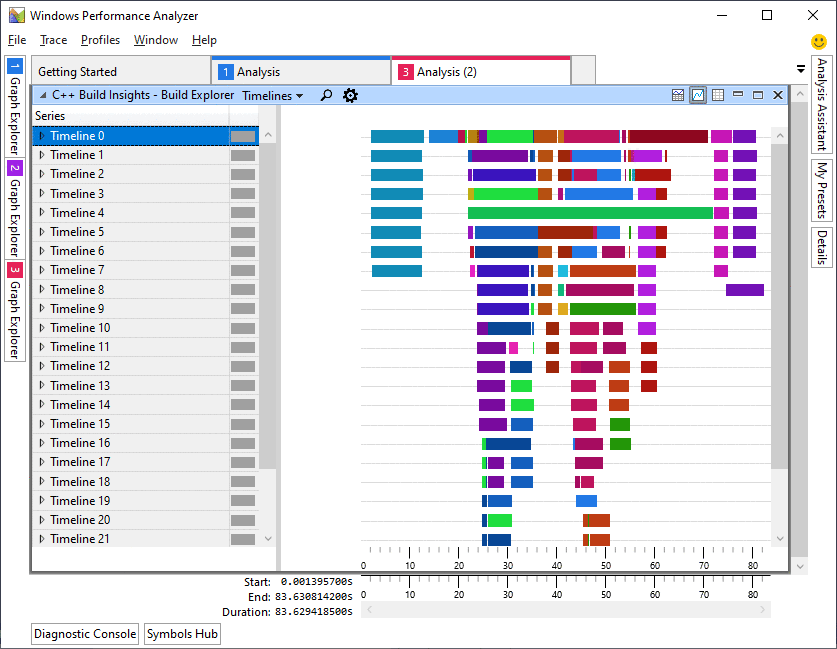
We use the Timelines preset of the Build Explorer view, and immediately notice a long-running invocation that seems to be a bottleneck at the beginning of the build.
We switch over to the Invocations preset to drill down on that particular invocation. We notice that all files are compiled sequentially. This can be seen by the small teal-colored bars appearing one after the other on the timeline, instead of being stacked one on top of the other.
We look at the Invocation Properties for this invocation, and notice that the command line does not have /MP, the flag that enables parallelism in CL invocations. We also notice from the WorkingDirectory property that the project being built is called libgit.
We enable the /MP flag in the properties page for the libgit projet in Visual Studio.
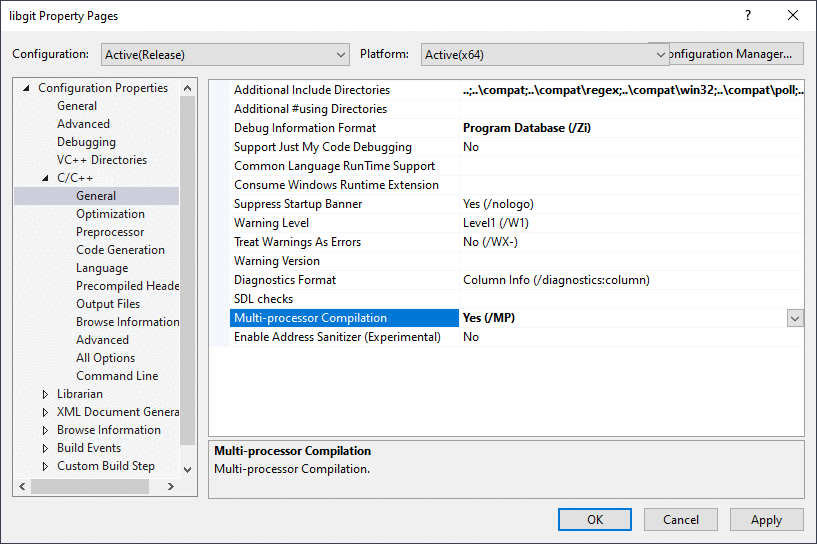
We capture another full build trace using the steps at the beginning of this section to confirm that we mitigated the issue. The build time was reduced from around 120 seconds to 80 seconds, a 33% improvement.
Identifying bottlenecks using the C++ Build Insights SDK
Most analysis tasks performed manually with vcperf and WPA can also be performed programmatically using the C++ Build Insights SDK. To illustrate this point, we’ve prepared the BottleneckCompileFinder SDK sample. It emits a warning when it finds a bottleneck compiler invocation that doesn’t use the /MP switch. An invocation is considered a bottleneck if no other compiler or linker invocation is ever invoked alongside it.
Let’s repeat the Git for Windows case study from the previous section, but this time by using the BottleneckCompileFinder to see what it finds. Use these steps if you want to follow along:
- Clone the C++ Build Insights SDK samples GitHub repository on your machine.
- Build the Samples.sln solution, targeting the desired architecture (x86 or x64), and using the desired configuration (debug or release). The sample’s executable will be placed in the
out/{architecture}/{configuration}/BottleneckCompileFinderfolder, starting from the root of the repository. - Follow the steps from the Putting it all together: a bottleneck case study section to collect a trace of the Git for Windows solution. Use the /stopnoanalyze command instead of the /stop command when stopping your trace.
- Pass the collected trace as the first argument to the BottleneckCompileFinder executable.
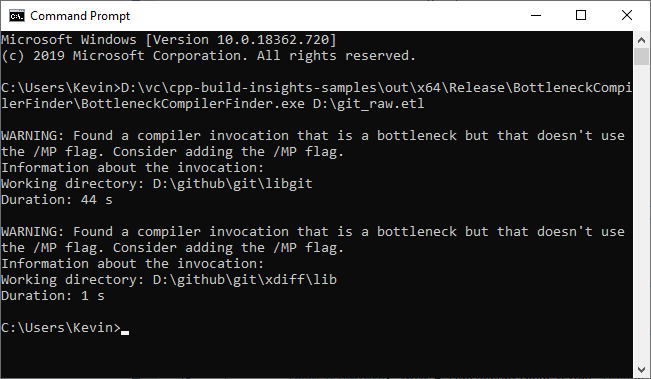
As shown below, BottleneckCompileFinder correctly identifies the libgit project and emits a warning. It also identifies one more: xdiff, though this one has a small duration and doesn’t need to be acted upon.
Going over the sample code
We first filter all start activity, stop activity, and simple events by asking the C++ Build Insights SDK to forward what we need to the OnStartInvocation, OnStopInvocation, and OnCompilerCommandLine functions. The name of the functions has no effect on how the C++ Build Insights SDK will filter the events; only their parameters matter.
AnalysisControl OnStartActivity(const EventStack& eventStack)
    override
{
    MatchEventStackInMemberFunction(eventStack, this,
        &BottleneckCompileFinder::OnStartInvocation);

    return AnalysisControl::CONTINUE;
}

AnalysisControl OnStopActivity(const EventStack& eventStack)
    override
{
    MatchEventStackInMemberFunction(eventStack, this,
        &BottleneckCompileFinder::OnStopInvocation);

    return AnalysisControl::CONTINUE;
}

AnalysisControl OnSimpleEvent(const EventStack& eventStack)
    override
{
    MatchEventStackInMemberFunction(eventStack, this,
        &BottleneckCompileFinder::OnCompilerCommandLine);

    return AnalysisControl::CONTINUE;
}
Our OnCompilerCommandLine function keeps track of all compiler invocations that don’t use the /MP flag. This information will be used later to emit a warning about these invocations if they are a bottleneck.
void OnCompilerCommandLine(Compiler cl, CommandLine commandLine)
{
    auto it = concurrentInvocations_.find(cl.EventInstanceId());

    if (it == concurrentInvocations_.end()) {
        return;
    }

    // Keep track of CL invocations that don't use MP so that we can
    // warn the user if this invocation is a bottleneck.

    std::wstring str = commandLine.Value();

    if (str.find(L" /MP ") != std::wstring::npos ||
        str.find(L" -MP ") != std::wstring::npos)
    {
        it->second.UsesParallelFlag = true;
    }
}
Our OnStartInvocation and OnStopInvocation functions keep track of concurrently running invocations by adding them in a hash map on start, and by removing them on stop. As soon as 2 invocations are active at the same time, we consider all others to no longer be bottlenecks. If a compiler invocation is marked a bottleneck once we reach its stop event, it means there never was another invocation that started while it was running. We warn the user if these invocations do not make use of the /MP flag.
void OnStartInvocation(InvocationGroup group)
{
    // We need to match groups because CL can
    // start a linker, and a linker can restart
    // itself. When this happens, the event stack
    // contains the parent invocations in earlier
    // positions.

    // A linker that is spawned by a previous tool is
    // not considered an invocation that runs in
    // parallel with the tool that spawned it.
    if (group.Size() > 1) {
        return;
    }

    // An invocation is speculatively considered a bottleneck
    // if no other invocations are currently running when it starts.
    bool isBottleneck = concurrentInvocations_.empty();

    // If there is already an invocation running, it is no longer
    // considered a bottleneck because we are spawning another one
    // that will run alongside it. Clear its bottleneck flag.
    if (concurrentInvocations_.size() == 1) {
        concurrentInvocations_.begin()->second.IsBottleneck = false;
    }

    InvocationInfo& info = concurrentInvocations_[
        group.Back().EventInstanceId()];

    info.IsBottleneck = isBottleneck;
}

void OnStopInvocation(Invocation invocation)
{
    using namespace std::chrono;

    auto it = concurrentInvocations_.find(invocation.EventInstanceId());

    if (it == concurrentInvocations_.end()) {
        return;
    }

    if (invocation.Type() == Invocation::Type::CL &&
        it->second.IsBottleneck &&
        !it->second.UsesParallelFlag)
    {
        std::cout << std::endl << "WARNING: Found a compiler invocation that is a " <<
            "bottleneck but that doesn't use the /MP flag. Consider adding " <<
            "the /MP flag." << std::endl;

        std::cout << "Information about the invocation:" << std::endl;
        std::wcout << "Working directory: " << invocation.WorkingDirectory() << std::endl;
        std::cout << "Duration: " << duration_cast<seconds>(invocation.Duration()).count() <<
            " s" << std::endl;
    }

    concurrentInvocations_.erase(invocation.EventInstanceId());
}
Tell us what you think!
We hope the information in this article has helped you understand how you can use the Build Explorer view from vcperf and WPA to diagnose bottlenecks in your builds. We also hope that the provided SDK sample helped you build a mental map of how you can translate manual analyses into automated ones.
Give vcperf a try today by downloading the latest version of Visual Studio 2019, or by cloning the tool directly from the vcperf Github repository. Try out the BottleneckCompileFinder sample from this article by cloning the C++ Build Insights samples repository from GitHub, or refer to the official C++ Build Insights SDK documentation to build your own analysis tools.
Have you found bottlenecks in your builds using vcperf or the C++ Build Insights SDK? Let us know in the comments below, on Twitter (@VisualC), or via email at visualcpp@microsoft.com.

 Light
Light Dark
Dark
23 comments
Your way of explaining this topic is really praiseworthy. I would love to take inspiration from your post and write on my blog on this topic. Microsft users will be highly benefited from your information. Keep doing this good writing.
Spotting missing use of /MP can be easy to spot just by looking at the output window during a build.
I’m looking forward to see if this tool can go deeper to find bottlenecks harder / painfully to detect such has template instantiation or (big) headers pulling too much symbols.
Hi Tony,
Thanks for your suggestion. You’ll be happy to know that a post on templates is coming 🙂
As for /MP, I think C++ Build Insights makes it easier to pinpoint which invocations actually need it. It also brings problems like this to your attention without having to intentionally look for them.
Hi Tony,
The template instantiations blog post has been released! 🙂
See here: https://devblogs.microsoft.com/cppblog/profiling-template-metaprograms-with-cpp-build-insights/
Any idea when the the WPA version with this support will come out of preview?
Hi Edward,
The correct WPA version should come out of preview sometime this year. I have been told that it’s scheduled for the end of April, though this might be pushed back due to current world events. If you are not interested in getting the preview, you can clone the vcperf repository from GitHub. There are steps on the README page of the repo which explain how to get the regular WPA to work.
I can’t seem to get this to work. I already had the latest (non-beta) VS 2019 16.5.4, enrolled into the Insider Preview, downloaded the Preview ADK, installed the Windows Performance Tools (unchecking everything else), and collected a trace using vcperf. When I run WPA (v0.10.0) and try to open the trace, it gives me this error in the Diagnostic Console:
Hi e4lam,
I’ve just been told by someone on the WPA team that the current Preview version available for download has problems. I would recommend uninstalling the Preview and installing the regular WPA version available here. Then, you can follow the instructions on the README page of vcperf’s GitHub repo to configure the regular WPA to work with C++ Build Insights.
Sorry for the inconvenience, and thanks for letting us know about this new issue. I will update the instructions in the blog post.
Hi Kevin,
I listened to the episode of cppcast about build insights and vcperf, and got curious to try it out 🙂
However, I just ran into the same problem. It seems to be quite a few steps to follow to build and load the build insights add-in into WPA.
Do you have any estimate when the problems will be fixed in the preview?
Hi Erik,
I’ve just learned that you can obtain a working WPA by downloading the Windows SDK preview rather than the ADK preview. Please download version 19041.1 of the SDK preview, and select only the Windows Performance Toolkit option when installing it. The direct link to the ISO file for this preview is: https://software-download.microsoft.com/download/sg/Windows_InsiderPreview_SDK_en-us_19041_1.iso
Hi again,
I installed WPA 10.0.19041.1 from your link. Now the “missing DLL error” is gone, but I still see no “Diagnostics” panel. Is there any example trace available to just verify the WPA installation?
The tracing seems to work, given this output.
Hi Erik,
Could you please contact me at kevca at microsoft dot com? Thanks!
The 19624 InsiderPreview version of ADK appears to have this issue as well. I installed 19041 and the Graph Explorer then shows up on the left side. Four hours later trying to download/reinstall smaller SDKs…
I ran into an issue where the perfcore_managedinterop.dll / Microsoft.Performance.PerfCore4.ManagedAddIns.ManagedAddInNativeMethods.CreateManagedProxy couldn’t be found as seen in the debug above. So I then used VS / Package Manager w/ a blank project and installed Build Insights. That resolved that issue then ran into where the Microsoft.Performance.NT.Shell.dll was “missing” I wasn’t sure which package it was looking for, and the dll was in the directory w/ wpa.exe so I just uninstalled the insider preview like you said.
I’ll install insider preview version later and let you know if that resolves it. Thanks for the advice to install latest release though! This is the only page google returns searching for the above dll w/ quotes.
Hi Stephen,
Sorry for the inconvenience. As of Visual Studio 16.6 there is now a better way to install the WPA add-in. I would suggest uninstalling all preview or insider versions of the ADK that you have and simply use the latest official version of the ADK. Then, download the latest Visual Studio 2019 and follow the instructions that I have just updated in this blog post to configure WPA. Please let me know if this doesn’t work.
Thanks!
Hey Kevin, I also read your old post ( https://devblogs.microsoft.com/cppblog/introducing-c-build-insights/ ), in which it is said that the vcperf also works with VC2017 compiler.
I followed the https://github.com/microsoft/vcperf to build latest vcperf and configure WPA, then after running “vcperf /start” & “vcperf /stop”, no output etl file is generated. Then I found vcperf generates 3 etl files (merged.etl, msvc.etl, system.etl) under C:\Users\WV-SA-LI\AppData\Local\Temp\CppBuildInsights\{xxxxxxxxx-xxxxx-xxxx} folder. Then I tried to open with WPA, and I could not find the “Diagnostics” panel, which seems that no etl contains the C++ Build Insight profiling info?
Btw, I am testing with a windows VM, would that affect?
Any suggestions, thanks a lot!
Hi Sa,
What does vcperf say when you run the stop command? Does it say “Analyzing…” and then exit execution without printing anything else? If so, it might be a crash. If that’s the case, could you please report the problem on Developer Community?
Thanks!
Was it really necessary to create in WPA your own tab? I thing Generic events and an enhanced region file should do the trick? What I find with regions is that you cannot specify a substring in PayLoadIdentifier to create matching regions with no exact counterparts. That way other WPA power users would also have benefitted. Is there some public backlog which WPA features were added in recent builds? I find nowhere information what has changed or improved.
Hi Alois,
We were using the Generic Events table in earlier, unreleased versions of C++ Build Insights, but found that there were performance issues when viewing large build traces. Switching to a custom add-in significantly improved the viewing experience for those traces.
You can find release notes for WPA as part of the ADK release notes available here: https://docs.microsoft.com/en-us/windows-hardware/get-started/what-s-new-in-kits-and-tools
I tried looking at template instantiations in WPA, but I found I was missing a bit of context to really make use of the information
For example, by far the template the compiler spends the most time on in my project is std::conjunction_v. That’s great to know, but I never use that template directly, so tracking down where and why this is getting instantiated so frequently is difficult. I can which files it ends up being instantiated in, but as far as I can see there’s no further detail available. Would it be possible to add the full instantiation stack to these events, so we can see which function/template caused the current template to be instantiated?
Hello jalf,
I would recommend upgrading to the latest VS toolset to get more accurate template events. Earlier events did not distinguish between different specializations for variable templates such as std::conjunction_v, causing them to all be grouped in one entry. VS 16.6 correctly differentiates variable template specializations.
However, VS 16.6 will still not tell you precisely where the instantiations occur beyond the top level cpp file. I also think it would be beneficial to improve these events to give a more precise location. May I suggest you open a feature suggestion on Developer Community in the C++ section for this? It would make it easier for us to track this suggestion for future planning.
Thanks!
Will this work for projects that don’t use the 2019 compiler but are still using Visual Studio 2019? I.e. using the v140 compiler in VS 2019.
Hi Andrew,
Thanks for your question. C++ Build Insights only supports v141 (i.e. the VS 2017 toolset) and above, even when using VS 2019 as the IDE.
Argh so close 🙂
Thanks!