
Build 2020 Recap: What’s new in Azure Cosmos DB’s API for MongoDB?
It’s that time of the year again!
The entirety of Microsoft has been working hard this past semester to bring you new features and functionality, and the Azure Cosmos DB is no exception. The Cosmic team has worked hard to deliver disruptive new functionality that goes from automatically scaling your database capacity to expanding the Jupyter Notebooks kernel to execute C#! Check out those features, and much more, on the official Cosmos DB Build Announcements blog post.
Notice how the cat is working from home (via GIPHY)
With regards to Azure Cosmos DB’s API for MongoDB, we have been hard at work to bring you the following features that relate to #scalability, #programmability, #performance and #consistency. Let’s get started!
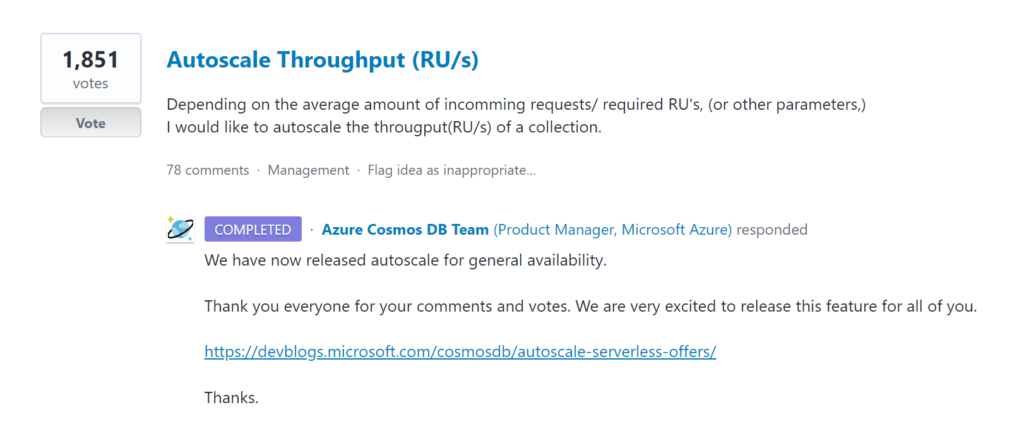
Autoscale is now available! #scalability
That’s right! One of the most requested features of Cosmos DB is now in General Availability! This means that your collections, or databases with dedicated throughput, can now dynamically change their provisioned Request Units with a maximum ceiling that you define. This effectively eliminates the need to manage database capacity and can reduce your operational costs significantly!
This is how you can create a new collection with Autoscale capacity using mongo calls. We will assume you named your database test and your collection hahaCollection in the examples below (absolutely normal resource names):
use test
db.runCommand({ customAction: "CreateCollection", collection: "hahaCollection", autoScaleSettings:{ maxThroughput: 4000 } });
This collection will have, and be billed for, 400 request units, until it needs more. If it ever needs more it will increase its capacity by a factor of 100 RU/s, to a maximum of the specified 4,000, and then return to 400 requests units afterwards if it doesn’t need have any more activity. Learn more about this behavior in this article: Frequently asked questions about autoscale.
If you have any existing collections or databases that could use some autoscalin’, you can use this command to enable it:
// For databases
use test
db.runCommand({customAction: "UpdateDatabase", autoScaleSettings: { maxThroughput: 20000 } });

// For collections
use test
db.runCommand({ customAction: "UpdateCollection", collection: "hahaCollection", autoScaleSettings:{maxThroughput: 4000} });
And that’s it! By the way, you can also use more MongoDB extension commands with Cosmos DB. You can run these on the Mongo shell in the Cosmos DB Data Explorer, or on your choice of environment.
Improved query troubleshooting with explain() #programmability
Gone are the days when you need to rely only on logs to improve your queries. While this might not stop developers from testing in production, it does allow you to get a sense of how your database operations are performing and detect any potential bottlenecks. This feature will have an output that is specific to Azure Cosmos DB’s API for MongoDB.
All you need to do is attach the.explainfunction to your find() functions. For example:
db.testCollection.find().explain()
The output would be:
{
	"stages": [{
		"stage": "$query",
		"timeInclusiveMS": 3.8064,
		"timeExclusiveMS": 3.8064,
		"in": 3,
		"out": 3,
		"details": {
			"database": "test",
			"collection": "testCollection",
			"query": {
				"$comment": ""
			},
			"pathsIndexed": [],
			"pathsNotIndexed": [],
			"shardInformation": [{
				"activityId": "someId",
				"shardKeyRangeId": "1",
				"durationMS": 2.5711,
				"preemptions": 1,
				"outputDocumentCount": 3,
				"retrievedDocumentCount": 3
			}],
			"queryMetrics": {
				"retrievedDocumentCount": 3,
				"retrievedDocumentSizeBytes": 1091,
				"outputDocumentCount": 3,
				"outputDocumentSizeBytes": 744,
				"indexHitRatio": 1,
				"totalQueryExecutionTimeMS": 0.65,
				"queryPreparationTimes": {
					"queryCompilationTimeMS": 0.19,
					"logicalPlanBuildTimeMS": 0.08,
					"physicalPlanBuildTimeMS": 0.11,
					"queryOptimizationTimeMS": 0.01
				},
				"indexLookupTimeMS": 0,
				"documentLoadTimeMS": 0.04,
				"vmExecutionTimeMS": 0.07,
				"runtimeExecutionTimes": {
					"queryEngineExecutionTimeMS": 0.02,
					"systemFunctionExecutionTimeMS": 0,
					"userDefinedFunctionExecutionTimeMS": 0
				},
				"documentWriteTimeMS": 0.01
			}
		}
	}],
	"estimatedDelayFromRateLimitingInMilliseconds": 0,
	"continuation": {
		"hasMore": false
	},
	"ok": 1
}
From the above output, you could, for example, analyze:
- How long did this query take in the server? Take a look at the `timeInclusiveMS` and `timeExclusiveMS` parameters.
- How many shards did this query need to scan for the full result? Take a look at the `shardInformation` top-level array, which will contain an object for every individual shard that was scanned.
- How did this query perform in the engine? Take a look at the
queryMetricsobject, which contains information like `totalQueryExecutionTimeMS`,queryPreparationTimesanddocumentLoadTimeMS. - How much is this query leveraging the index? Take a look at the
indexHitRatio, which shows the amount of index hits for every document returned.
Learn more in the Wire protocol support documentation article.
More #programmability updates!
- Use Azure Cosmos DB’s API for MongoDB with Rust! Check out this blog post that outlines how to get started with it.
- We have updated our docs to make use of the native Golang driver for MongoDB.
- Support for native ReadConcern and WriteConcern functionality to provide an improved request-level consistency. Learn more about how the consistency levels of MongoDB translate to Cosmos DB.
- Improved query performance for
find()operations that require to fan-out to multiple shards. This applies to accounts on server version 3.6. - New subscriptions are now using timeout-based capacity model instead of request rate limiting. How does this work? Requests span over multiple seconds up to a 60 second limit. If you have an existing account on server version 3.6, you can email us to try out this feature.
And that’s it for now! Thanks for reading our blog post and stay tuned for more updates!
 Light
Light Dark
Dark
0 comments