
Solving the River Crossing problem with SQL Graph
Are you are familiar with the classic “river crossing” problem? If not, an easy 4 minutes introduction using Wildebeest and Lions as the actors in the problem, is presented in this TED-Ed talk. If you observe carefully, the video briefly mentions using an enumeration approach to list all the possible transitions, and for each transition, the end state. It so happens that this is the classic algorithmic approach as well to solve such problems – to create a graph of all possible states (represented by vertices / nodes in the graph) and the transitions (represented by edges) which result into those states. If you search online, there are plenty of references showing you how to use Breadth-First-Search (BFS) to find the shortest path to solve the problem. David Kopec’s Classic Computer Science Problems books also present implementations of this problem in Python and other languages.
Let’s see if we can solve this classic problem, using T-SQL and the graph capabilities in Azure SQL / SQL Server!
Governing Rules
Let’s present the main “rules” of this problem, as presented in the TED talk:
- There are 3 wildebeest and 3 lions, all located on one bank (for completeness, we have the West bank, and the East bank) of a river. They are trying to cross the other river bank.
- As it turns out, wildebeest are a natural prey for the lions. Therefore, there is a “rule” which states that if the number of wildebeest either equal, or outnumber the number of lions, on the same bank of the river, they are safe. In our context, we will call this a “safe” state.
- Conversely, If the number of wildebeest are lesser than the number of lions, they are unsafe. In our context, we will refer to this as an “unsafe” or “disallowed” state, as we don’t want the wildebeest to come to harm!
- Let’s also imagine, that these animals know how to use a raft, to cross the river 😊 However, the raft can only take 2 animals at any time, and obviously, the raft is not “autonomous”, and needs an animal or 2 animals on board to move from one bank of the river to the other.
- At any given point in time, rules 2 and 3 must continuously be applied, even when 2 animals are on the raft!
Notation for states (nodes / vertices)
We will represent the current “state” of this situation by using simple notations:
- The letter W will be the prefixed with a number representing the number of wildebeest.
- Similarly, the letter L will be the prefixed with a number representing the number of lions.
- For each bank of the river, we will use notation like nWmL to represent the number of animals of each type on that bank. For example, 2W1L means that there are 2 wildebeest, and 1 lion on that side of the river.
- If there are no animals of a given type on that bank of the river, the number 0 will be prefixed to the letter representing that type of animal.
- The raft can only be on one bank of the river at any given point in time. To conveniently represent this in our notation, we will use an asterisk (*) character to denote the bank of the river where the raft is located.
- Putting everything together, we can conveniently depict the complete state. As an example, the notation below, means that the raft is on the west bank of the river, there are 1 each of wildebeest and lion on the west bank, and finally, 2 each of wildebeest and lion on the east bank:
* 1W1L | 2W2L
Notation for transitions (edges)
- We will show the movement of the boat using a > or < character, representing if the raft moved from the west bank, to the east bank, or east to west.
- Further, we will prefix the above character with the number of, and type of, animal(s) that are on the raft. For example, < 1W1L means that 1 wildebeest was on the raft with 1 lion and they went from east to west.
Boiling the ocean (river)
With the above rules and notations in hand, it is possible to enumerate all possible states and transitions, and create a true graph. If we draw out this graph on a large piece of paper, we would use some more conventions to make it readable:
- Some states are “unsafe” as defined previously, as they would result in wildebeest being harmed. Let’s denote those states with an orange fill color.
- Correspondingly, transitions which lead into that state, are deemed as impossible transitions, and are represented by dotted lines.
- Transitions which are safe are denoted by solid lines.
- The desired start and end states are when all 6 animals are safely on either bank of the river. So, you could have * 3W3L | 0W0L as a valid start, or end state, representing the case when they are all on the west bank.
- Correspondingly, 0W0L | 3W3L * represents another potential start, or end state, wherein all 6 animals are on the east bank!
Drawing this out by hand can take a while, but if you patiently do this, you will end up with a large graph like the one below:
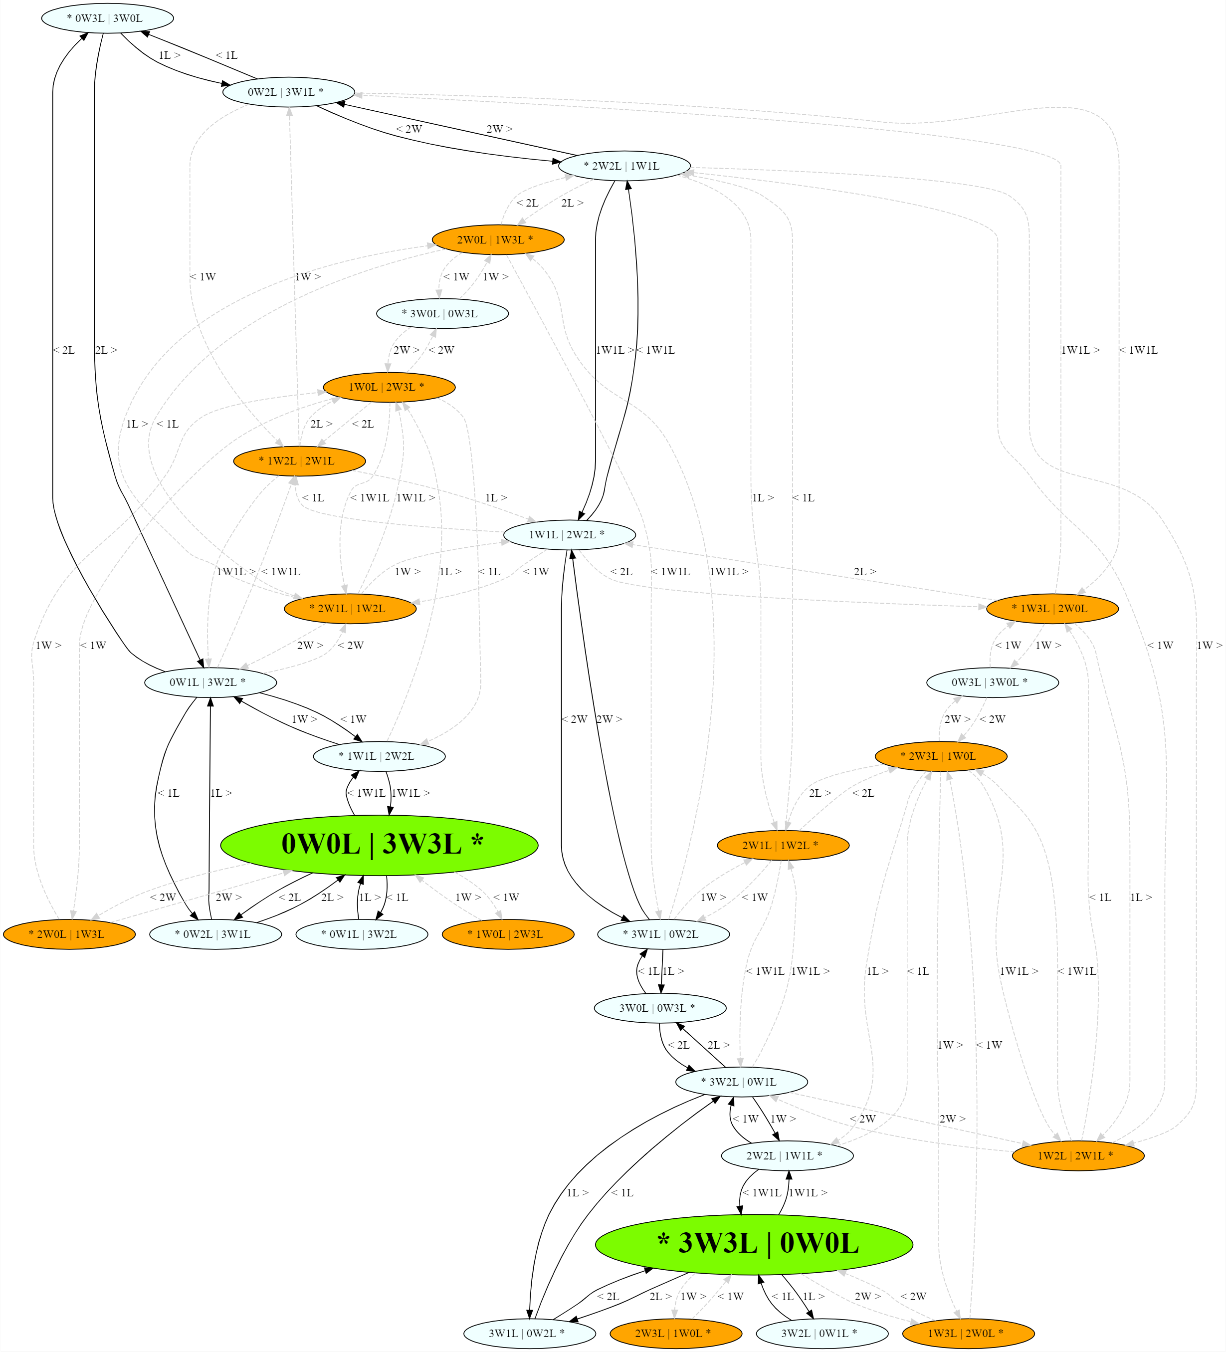
I don’t think we want to draw this by hand, or even try enumerating the states and transitions manually. It is tedious, time consuming, and error prone. Let’s see how we can use T-SQL to do this, and eventually produce the “pretty picture” graph shown above!
SQL Graph Implementation
The placement table
We first create a NODE table in SQL to represent the current state. Note that while we formally name this table as placement, we may interchangeably refer to it as the state table as well:
CREATE TABLE placement (
    w_w            SMALLINT,
    l_w            SMALLINT,
    w_e            SMALLINT,
    l_e            SMALLINT,
    boat_pos       CHAR (1),
    is_valid_state BIT,
    summary        AS       CONCAT(CASE WHEN boat_pos = 'w' THEN '* ' ELSE '' END, w_w, 'W', l_w, 'L | ', w_e, 'W', l_e, 'L', CASE WHEN boat_pos = 'e' THEN ' *' ELSE '' END)
) AS NODE;
The columns in the table should be self-explanatory, keeping in mind the previously described notations. The _w and _e suffixes are for the west and east banks, respectively. The computed column, summary, will be used to print out the same notation as we previously described.
Populating all possible states
At any given time, the possible numbers of each type of animal on a bank can be {0, 1, 2, 3}. We also have the constraint that the total number of animals of each type is 3, even if they are split across the riverbanks. So, keeping these in mind, it is easy to implement a CROSS JOIN in T-SQL to populate all the possible states into the placement table. The code shown below does exactly that and determines if the state is a “valid” or safe one (as a reminder, when the number of wildebeest is >= the number of lions, it is safe / valid state).
DECLARE @possible_numbers TABLE (
    val SMALLINT);

INSERT  INTO @possible_numbers
VALUES (0),
(1),
(2),
(3);

INSERT placement (w_w, l_w, w_e, l_e, boat_pos, is_valid_state)
SELECT w_w.val AS w_w,
       l_w.val AS l_w,
       w_e.val AS w_e,
       l_e.val AS l_e,
       river_bank AS boat_pos,
       CASE WHEN (((w_w.val > 0
                    AND w_w.val >= l_w.val)
                   OR w_w.val = 0)
                  AND ((w_e.val > 0
                        AND w_e.val >= l_e.val)
                       OR w_e.val = 0)) THEN 1 ELSE 0 END AS is_valid_state
FROM   @possible_numbers AS w_w CROSS JOIN @possible_numbers AS l_w CROSS JOIN @possible_numbers AS w_e CROSS JOIN @possible_numbers AS l_e CROSS JOIN (VALUES ('w'), ('e')) AS boat_pos(river_bank)
WHERE  w_w.val + w_e.val = 3
       AND l_w.val + l_e.val = 3
       AND ((river_bank = 'w'
             AND (w_w.val + l_w.val > 0))
            OR (river_bank = 'e'
                AND (w_e.val + l_e.val > 0)));
The “transition” table
This table represents the transitions i.e., the movement of a given number of animal(s) across the river. This is implemented as a SQL Graph EDGE table as shown below:
CREATE TABLE transition (
    pre                 VARCHAR (20),
    post                VARCHAR (20),
    transition          VARCHAR (20),
    is_valid_transition BIT
) AS EDGE;
Populating the transition table
The code may look daunting, but in simple terms is using a CROSS JOIN to evaluate each possible state against each other state in the previously populated placement table. For each such combination, it calculates if there is a feasible transition based on simple rules:
- The raft should be on the same bank as the start of the transition.
- At least 1 but not more than 2 animals on the raft at any given time.
- The end state and the start state should be different, etc.
WITH transitions_1
AS   (SELECT f.$NODE_ID AS f_node_id,
             t.$NODE_ID AS t_node_id,
             f.summary AS pre,
             t.summary AS post,
             f.boat_pos AS f_boat_pos,
             t.boat_pos AS t_boat_pos,
             f.w_w AS f_w_w,
             f.w_e AS f_w_e,
             f.l_w AS f_l_w,
             f.l_e AS f_l_e,
             t.w_w AS t_w_w,
             t.w_e AS t_w_e,
             t.l_w AS t_l_w,
             t.l_e AS t_l_e,
             abs(f.w_w - t.w_w) AS w_diff,
             abs(f.l_w - t.l_w) AS l_diff,
             f.w_w + f.l_w AS pre_nuw_w,
             f.w_e + f.l_e AS pre_nuw_e,
             t.w_w + t.l_w AS post_nuw_w,
             t.w_e + t.l_e AS post_nuw_e,
             f.is_valid_state AS f_is_valid_state,
             t.is_valid_state AS t_is_valid_state
      FROM   placement AS f CROSS JOIN placement AS t),
     transitions_2
AS   (SELECT *,
             CONCAT(CASE WHEN pre_nuw_w < post_nuw_w THEN '< ' ELSE '' END, CASE WHEN w_diff > 0 THEN CONCAT(w_diff, 'W') ELSE '' END, CASE WHEN l_diff > 0 THEN CONCAT(l_diff, 'L') ELSE '' END, CASE WHEN pre_nuw_w > post_nuw_w THEN ' >' ELSE '' END) AS transition,
             CASE WHEN f_is_valid_state = 1
                       AND t_is_valid_state = 1 THEN 1 ELSE 0 END AS is_valid_transition
      FROM   transitions_1
      WHERE  pre != post
             AND pre_nuw_w != post_nuw_w
             AND l_diff + w_diff BETWEEN 1 AND 2
             AND f_boat_pos = CASE WHEN pre_nuw_w < post_nuw_w THEN 'e' ELSE 'w' END
             AND t_boat_pos = CASE WHEN pre_nuw_w < post_nuw_w THEN 'w' ELSE 'e' END)
INSERT transition ($FROM_ID, $TO_ID, pre, post, transition, is_valid_transition)
SELECT f_node_id,
       t_node_id,
       pre,
       post,
       transition,
       is_valid_transition
FROM   transitions_2;
Finding a solution!
Once the graph is populated with the above steps, it is trivial to find a valid solution to the river crossing problem. SQL Graph provides the SHORTEST_PATH intrinsic (available in Azure SQL DB and SQL Server 2019 onwards), which implements BFS. Shreya Verma presents a good introduction to this capability in her webcast. The query below is all it takes to find a legal set of transitions to take all the animals, safely from the west bank (start state) to the east bank! And it takes less than 20 milliseconds even on a 2-vCore Azure SQL Hyperscale database.
DECLARE @start_state AS VARCHAR (20) = '* 3W3L | 0W0L';
DECLARE @end_state AS VARCHAR (20) = '0W0L | 3W3L *';

SELECT   *
FROM     (SELECT LAST_VALUE(p2.summary) WITHIN GROUP ( GRAPH PATH) AS end_state,
                 STRING_AGG(t.transition, ', ') WITHIN GROUP ( GRAPH PATH) AS steps,
                 COUNT(t.transition) WITHIN GROUP ( GRAPH PATH) AS num_trips
          FROM   placement AS p1, (SELECT *
                                   FROM   transition
                                   WHERE  is_valid_transition = 1) FOR PATH AS t, placement FOR PATH AS p2
          WHERE  MATCH(SHORTEST_PATH(p1(-(t)->p2)+))
                 AND p1.summary = @start_state) AS q
WHERE    q.end_state = @end_state;
Here’s the output of that query:
| end_state | steps | num_trips |
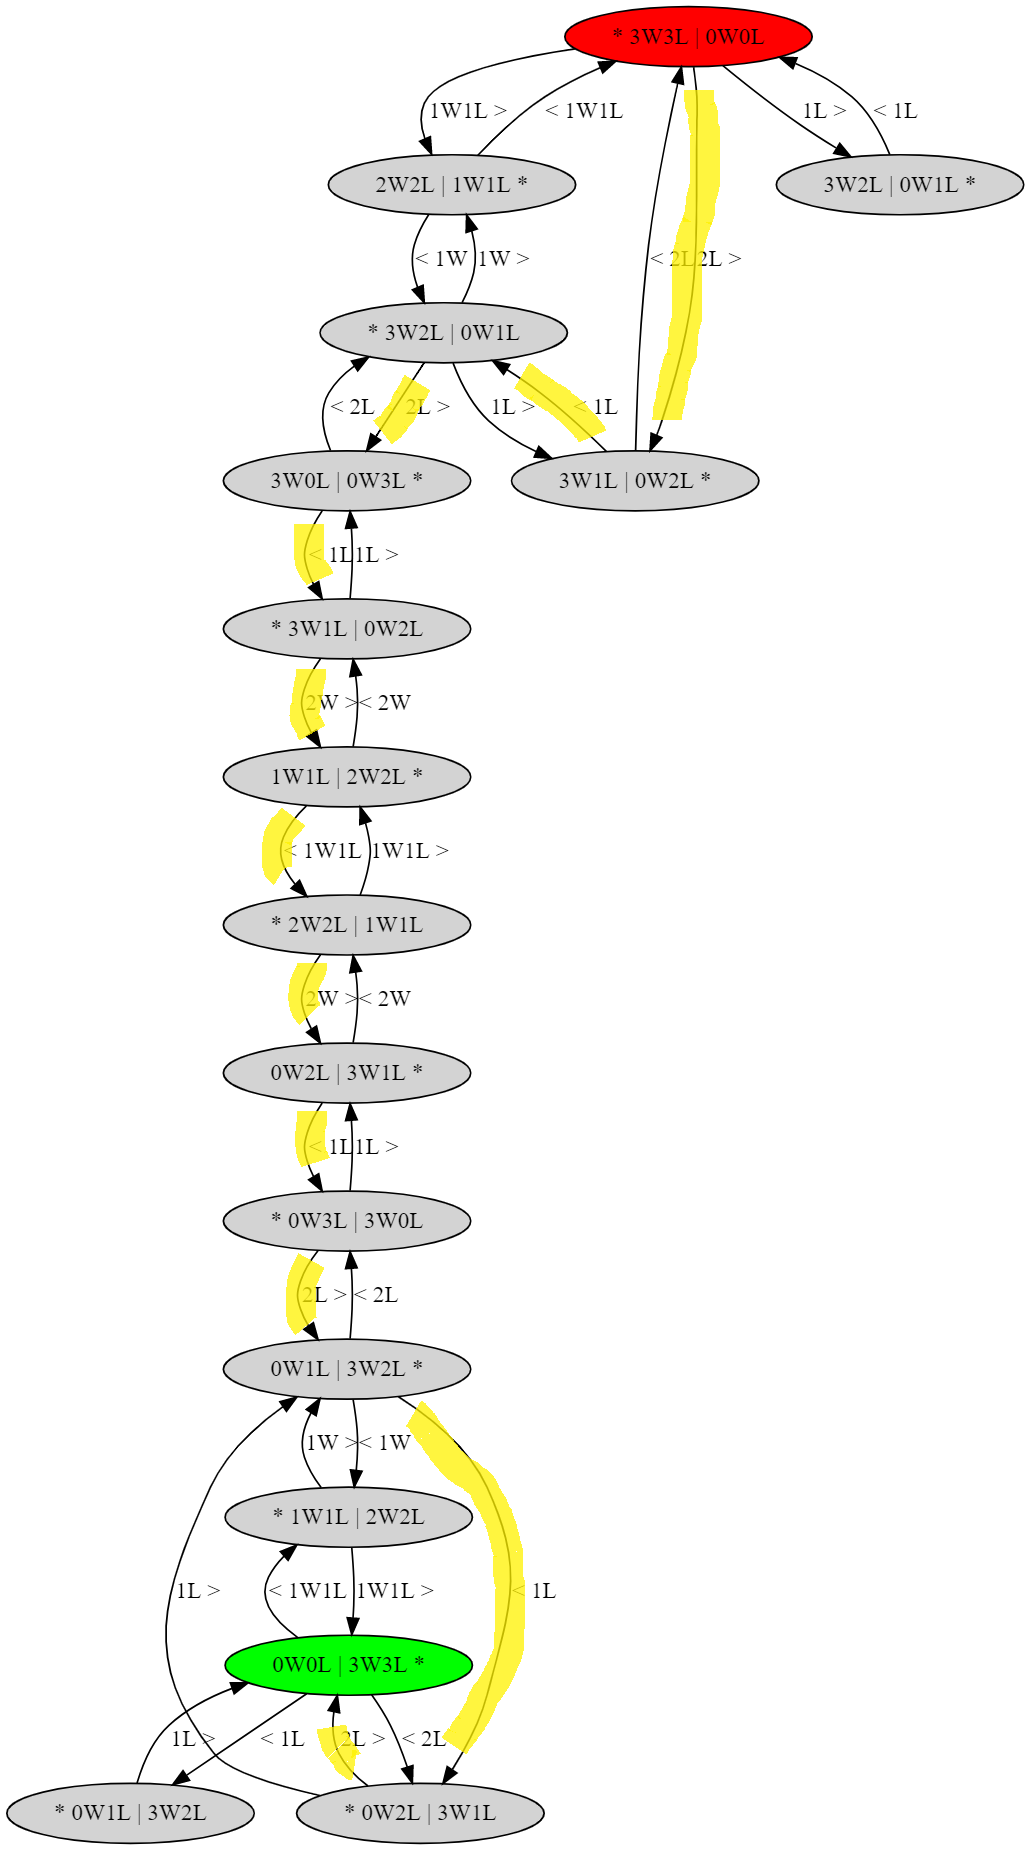
| 0W0L | 3W3L * | 2L >, < 1L, 2L >, < 1L, 2W >, < 1W1L, 2W >, < 1L, 2L >, < 1L, 2L > | 11 |
In human-readable terms, these steps can be interpreted as:
- 2 lions go from west to east.
- 1 lion comes back to west.
- 2 lions again go west to east.
- 1 lion comes back west. At this point in time, there are 3 wildebeest and 1 lion on the west bank.
- Now, leaving the 1 lion on the west bank, 2 wildebeest make the trip east.
- 1 wildebeest comes back with 1 lion to the west bank.
- 2 wildebeest go west to east.
- 1 lion now comes back from east to west.
- That lion picks up one more lion from the west, and those 2 lions move east.
- One lion comes back west.
- The 2 lions go back east, completing the epic set of trips!
This is just one way to solve the problem. There are other sets of transitions / trips which all result in the same end state, but you need a minimum of 11 trips to do so. Here’s the visualization of the graph, filtering and showing only valid transitions and states, and with the above path taken, highlighted.
Visualization
If you were wondering how we generate these neat visualizations, it is very easy. We output Graphviz DOT language notation for the directed graph, and then use Graphviz to render the visualization. A very convenient way to render these without any installation, is to use one of the many Graphviz Online viewers like this one. The code to produce Graphviz DOT syntax for the above (unfiltered) graph is shown below. Note that we leverage many of the powerful (yet simple) attributes provided by Graphviz DOT syntax, to style (colors, line styles etc.) the graph visual representation.
DECLARE @start_state AS VARCHAR (20) = '* 3W3L | 0W0L';
DECLARE @end_state AS VARCHAR (20) = '0W0L | 3W3L *';

-- OPTIONAL visualization using GraphViz's DOT syntax
-- paste the result of the below query into https://dreampuf.github.io/GraphvizOnline/
SELECT 'digraph G
{
node [style=filled]' AS s
UNION ALL
SELECT CONCAT (
		'"', summary, '" [label=< ', CASE
			WHEN summary = @start_state
				OR summary = @end_state
				THEN '<B>'
			ELSE ''
			END, summary, CASE
			WHEN summary = @start_state
				OR summary = @end_state
				THEN '</B>'
			ELSE ''
			END, ' >', CASE
			WHEN summary = @start_state
				OR summary = @end_state
				THEN ' fontsize=36 '
			ELSE ''
			END, ' fillcolor = "', CASE
			WHEN summary = @start_state
				OR summary = @end_state
				THEN 'lawngreen'
			ELSE CASE
					WHEN is_valid_state = 1
						THEN 'azure'
					ELSE 'orange'
					END
			END, '"]'
		)
FROM placement
UNION ALL
SELECT CONCAT (
		'"', pre, '" -> "', post, '"[label="', transition, '" style="', CASE
			WHEN is_valid_transition = 1
				THEN 'solid'
			ELSE 'dashed'
			END, '" color="', CASE
			WHEN is_valid_transition = 1
				THEN 'black'
			ELSE 'lightgray'
			END, '"]'
		)
FROM transition
UNION ALL
SELECT '}';
Conclusion
Graph theory and techniques are some of the most powerful tools at hand for a developer. As seen in this walkthrough, graph theoretic approaches to solving problems usually are very elegant and performant. With its built-in support for representing relational data as graphs, and traversal through that graph using simple MATCH predicates, or even more complex SHORTEST_PATH algorithms, Azure SQL and SQL Server present a convenient option for developers. We hope you found this example a fun and easy way to understand what SQL Graph can do for you. Please do leave your questions and feedback in the comments! Looking forward to your interaction!
 Light
Light Dark
Dark
3 comments
interesting!
This is an interesting implementation! However, very difficult to follow due to a complete lack of indentation in your T-SQL code.
I will need to copy the code to SSMS, indent it to comprehend it.
Thanks Tiago for the candid feedback re: formatting. Lesson learnt – I fixed it now. Hope you enjoy walking through the example yourself.